Ensemble CDD comparisons 12Z today vs 12Z Fri
GEFS: +2
EPS: -5
Thanks much Larry!
The models, overall don't look quite as hot to me as they did late last week.
We opened a bit higher, then immediately spiked to the high in the first minute at 2.267.
10 minutes later, we spiked to the low of 2.228 and recovered to 2.254, then back down to 2.242, then back up, just a bit above 2.250 for the last 90 minutes.
Very quiet.
Crude and the Dow futures are up a bit but not a factor.
Last Thursdays EIA report below:
![]()
for week ending July 31, 2020 | Released: August 6, 2020 at 10:30 a.m. | Next Release: August 13, 2020
+33 BCF Slightly bearish vs bullish expectations
| Working gas in underground storage, Lower 48 states Summary textCSVJSN | |||||||||||||||||||||||||
|---|---|---|---|---|---|---|---|---|---|---|---|---|---|---|---|---|---|---|---|---|---|---|---|---|---|
| Historical Comparisons | |||||||||||||||||||||||||
| Stocks billion cubic feet (Bcf) | Year ago (07/31/19) | 5-year average (2015-19) | |||||||||||||||||||||||
| Region | 07/31/20 | 07/24/20 | net change | implied flow | Bcf | % change | Bcf | % change | |||||||||||||||||
| East | 718 | 706 | 12 | 12 | 608 | 18.1 | 645 | 11.3 | |||||||||||||||||
| Midwest | 830 | 815 | 15 | 15 | 694 | 19.6 | 707 | 17.4 | |||||||||||||||||
| Mountain | 202 | 196 | 6 | 6 | 160 | 26.3 | 179 | 12.8 | |||||||||||||||||
| Pacific | 311 | 313 | -2 | -2 | 271 | 14.8 | 293 | 6.1 | |||||||||||||||||
| South Central | 1,214 | 1,211 | 3 | 3 | 939 | 29.3 | 1,021 | 18.9 | |||||||||||||||||
| Salt | 336 | 339 | -3 | -3 | 222 | 51.4 | 266 | 26.3 | |||||||||||||||||
| Nonsalt | 878 | 872 | 6 | 6 | 716 | 22.6 | 754 | 16.4 | |||||||||||||||||
| Total | 3,274 | 3,241 | 33 | 33 | 2,673 | 22.5 | 2,845 | 15.1 | |||||||||||||||||
Totals may not equal sum of components because of independent rounding. | |||||||||||||||||||||||||
Working gas in storage was 3,274 Bcf as of Friday, July 31, 2020, according to EIA estimates. This represents a net increase of 33 Bcf from the previous week. Stocks were 601 Bcf higher than last year at this time and 429 Bcf above the five-year average of 2,845 Bcf. At 3,274 Bcf, total working gas is within the five-year historical range.
For information on sampling error in this report, see Estimated Measures of Sampling Variability table below.

Note: The shaded area indicates the range between the historical minimum and maximum values for the weekly series from 2015 through 2019. The dashed vertical lines indicate current and year-ago weekly periods.
https://www.investing.com/economic-calendar/natural-gas-storage-386
Latest ReleaseAug 06, 2020 Actual 33B Forecast 30B Previous 26B
| Release Date | Time | Actual | Forecast | Previous | |
|---|---|---|---|---|---|
| Aug 06, 2020 | 10:30 | 33B | 30B | 26B | |
| Jul 30, 2020 | 10:30 | 26B | 26B | 26B | |
| Jul 23, 2020 | 10:30 | 37B | 36B | 45B | |
| Jul 16, 2020 | 10:30 | 45B | 47B | 56B | |
| Jul 09, 2020 | 10:30 | 56B | 58B | 65B | |
| Jul 02, 2020 | 10:30 | 65B | 78B | 120B |
7 day temps for last weeks EIA report:
Heat in the Pac Northwest but more importantly, in the Northeast/Mid Atlantic, a very high population area.
Above temps almost everywhere east of the Missippi.
7 day temps for this Thursday's EIA, 9:30am release of data, comparing storage with the previous week.
VERY cool in the Plains/Midwest.
Very warm along the East Coast compared to average(just a tad above average). Very warm in the Rockies vs average.
The injection will be greater than the previous week.
Any guesses?
Natural gas has broken out to the upside!
But we are overbought. The information below is not a recommendation/advise from me.
https://www.tradingview.com/symbols/NYMEX-NG1%21/
 Daily Analysis")
Natural Gas Futures(NYMEX:NG1!) 2.2540.0160.71%
ThinkingAntsOk Aug 7

+++++++++++++++++++++++++++++++++++++++++++++++++++++++++++++++++++++++

Main items we can see on the chart:
a) The price was inside a range after reaching a major Support Zone
b) Currently, the price has broken the range with a solid bullish movement
c) Now we are expecting a clear correction about 3 weeks
d) If that happens we will be ready to take long positions based on our weekly perspective
Weekly Perspective
There are 2 natural gas seasonal graphs below.
The top one is very updated....1999-2019. The one below that is thru 10 years ago, 1991-2009.
They are almost identical thru early August............then really deviate tremendously!
What are some things we might learn from this? I would appreciate Larry and others chiming in with views.
1. Spring is an extraordinarily strong time frame for NG prices.......always has been. Something like 19 out of 20 years up for some embedded time frames.
2. Despite it being so dependable, in 2020 COVID caused the opposite to happen in unprecedented fashion.
3. Late June, thru July is the weakest period of the year historically. We started that period this year, with near record heat and CDD's being added to the weather forecast making it MORE bullish than the seasonal pressure.
4. That support gave way in early/mid July with the heat dialed in and the forecasts cooling off.
5. The August seasonal has apparently changed in the last 10 years. Used to be very weak and a continuation of the weak July(maybe it was hurricane premium coming out, when most of the production was coming from the Gulf). The more recent seasonal is nuetral for August.
6. Then, we have both graphs lining up together with Sept and Oct being very strong months historically.
7. Then, we have huge divergence which is very surprising to me based on what I "thought" which might be a bias.
I always remember November as being my most profitable month in the 1990's and it was always picking the October high and being short in November. I remember lots of Halloweens, trick or treating with the kids and having an especially fun time checking price quotes on the short positions. However, we had some very mild Novembers in the late 1990's too. ...so it makes sense.2 The 2009 seasonal shows that. However, the 2019 seasonal shows the complete opposite. The biggest difference of the year between these 2 graphs. November from the 2019 graph actually has the greatest % increase of any month. WOW!
Before commenting more, I will still need to look at HDD data for November to see if the Novembers from 2010-2019 were that much colder than the Novembers from 1991-1999 that they replaced on the 20 year chart. Memory tells me yes. Recent Halloweens for me......now trick or treating with the GRAND kids have featured everybody bundled up. Last Thanksgiving featured some major cold.
https://charts.equityclock.com/natural-gas-futures-ng-seasonal-chart
2000-2019 seasonal below

http://www.equityclock.com/charts/natural-gas-futures-ng-seasonal-chart/
 Seasonal Chart")
The above chart represents the seasonality for Natural Gas Futures (NG) Continuous Contract for the past 19 years.
Any comments are appreciated.
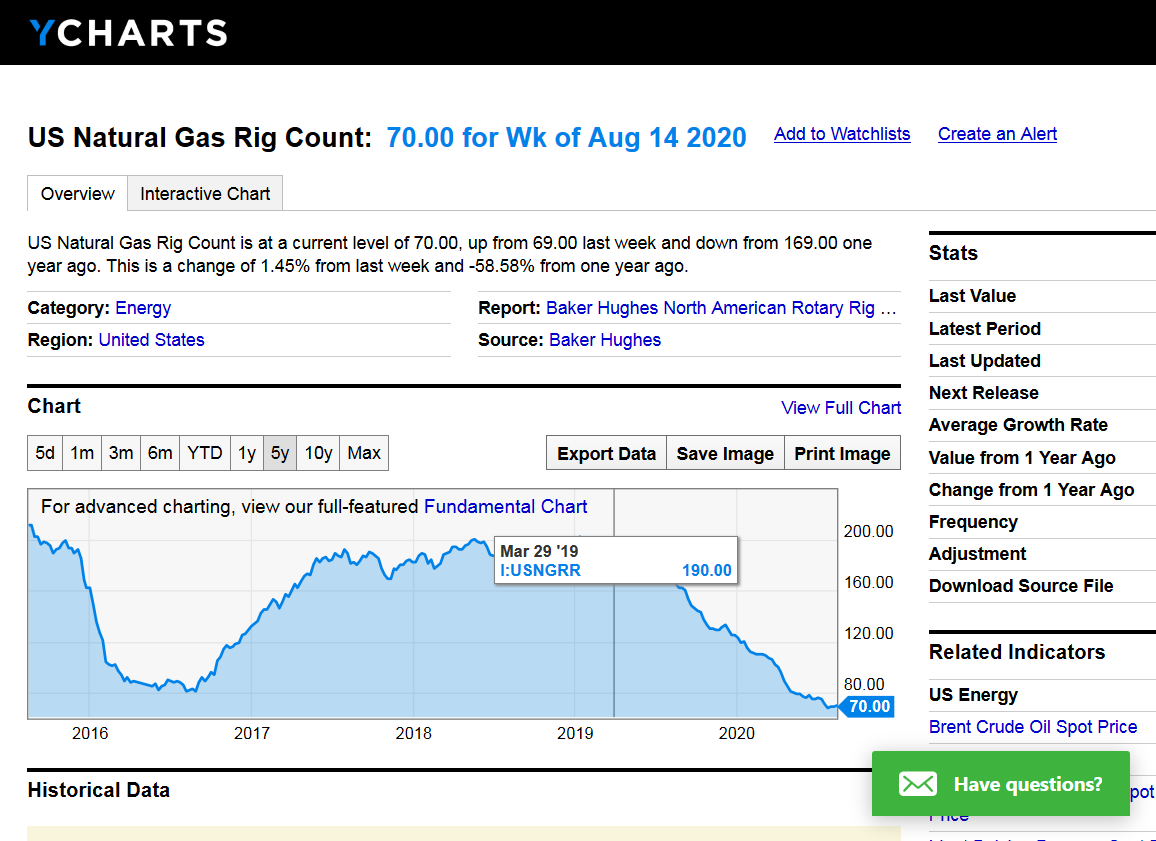
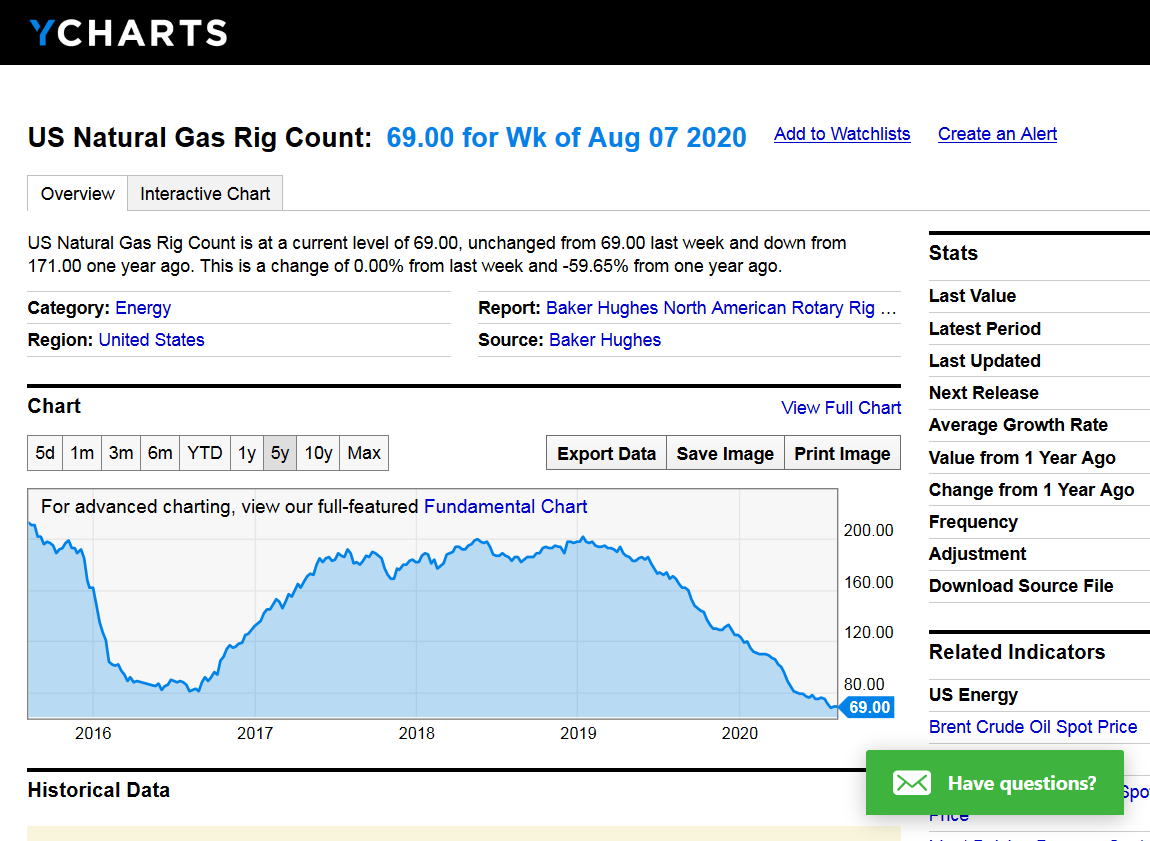
The rig count at 69, is just 1 above the lowest in history(which was recording during much of July)
https://ycharts.com/indicators/us_gas_rotary_rigs
NGI After the close Tuesday:
Natural gas futures rebounded a bit Tuesday as production declined and liquefied natural gas (LNG) demand held firmly above the 4.5 Bcf/d mark. After swinging in a roughly 10-cent range, the September Nymex gas futures contract settled at $2.171, up 1.8 cents. October climbed 2.4 cents to $2.311. Spot gas prices continued to climb across…
August 11, 2020
Wednesday Morning:
With overnight forecasts offering no major change to the weather outlook, and with analysts predicting a larger-than-average build from this week’s government inventory report, natural gas futures eased lower in early trading Wednesday. The September Nymex contract was off 3.4 cents to $2.137/MMBtu at around 8:45 a.m. ET. The latest forecast from Bespoke Weather Services…
August 12, 2020
Markets
![]()
Weekly Natural Gas Storage Report
for week ending August 7, 2020 | Released: August 13, 2020 at 10:30 a.m. | Next Release: August 20, 2020
+58 BCF Nuetral (a tad bearish)
| Working gas in underground storage, Lower 48 states Summary text CSV JSN | |||||||||||||||||||||||||
|---|---|---|---|---|---|---|---|---|---|---|---|---|---|---|---|---|---|---|---|---|---|---|---|---|---|
| Historical Comparisons | |||||||||||||||||||||||||
| Stocks billion cubic feet (Bcf) | Year ago (08/07/19) | 5-year average (2015-19) | |||||||||||||||||||||||
| Region | 08/07/20 | 07/31/20 | net change | implied flow | Bcf | % change | Bcf | % change | |||||||||||||||||
| East | 738 | 718 | 20 | 20 | 628 | 17.5 | 666 | 10.8 | |||||||||||||||||
| Midwest | 856 | 830 | 26 | 26 | 721 | 18.7 | 732 | 16.9 | |||||||||||||||||
| Mountain | 206 | 202 | 4 | 4 | 163 | 26.4 | 181 | 13.8 | |||||||||||||||||
| Pacific | 314 | 311 | 3 | 3 | 272 | 15.4 | 292 | 7.5 | |||||||||||||||||
| South Central | 1,219 | 1,214 | 5 | 5 | 940 | 29.7 | 1,018 | 19.7 | |||||||||||||||||
| Salt | 337 | 336 | 1 | 1 | 216 | 56.0 | 261 | 29.1 | |||||||||||||||||
| Nonsalt | 883 | 878 | 5 | 5 | 723 | 22.1 | 757 | 16.6 | |||||||||||||||||
| Total | 3,332 | 3,274 | 58 | 58 | 2,724 | 22.3 | 2,889 | 15.3 | |||||||||||||||||
Totals may not equal sum of components because of independent rounding. | |||||||||||||||||||||||||
Working gas in storage was 3,332 Bcf as of Friday, August 7, 2020, according to EIA estimates. This represents a net increase of 58 Bcf from the previous week. Stocks were 608 Bcf higher than last year at this time and 443 Bcf above the five-year average of 2,889 Bcf. At 3,332 Bcf, total working gas is above the five-year historical range.
For information on sampling error in this report, see Estimated Measures of Sampling Variability table below.
Note: The shaded area indicates the range between the historical minimum and maximum values for the weekly series from 2015 through 2019. The dashed vertical lines indicate current and year-ago weekly periods.
https://www.investing.com/economic-calendar/natural-gas-storage-386
| Release Date | Time | Actual | Forecast | Previous | |
|---|---|---|---|---|---|
| Aug 20, 2020 | 10:30 | 58B | |||
| Aug 13, 2020 | 10:30 | 58B | 57B | 33B | |
| Aug 06, 2020 | 10:30 | 33B | 30B | 26B | |
| Jul 30, 2020 | 10:30 | 26B | 26B | 26B | |
| Jul 23, 2020 | 10:30 | 37B | 36B | 45B | |
| Jul 16, 2020 | 10:30 | 45B | 47B | 56B |
Thursdays Weather https://www.marketforum.com/forum/topic/57515/
The U.S. Energy Information Administration (EIA) reported a 58 Bcf injection into natural gas storage inventories for the week ending Aug. 7, coming in on the high end of wide-ranging estimates but still sparking a small initial rally in futures prices. In the minutes leading up to the 10:30 a.m. ET storage report, the September…
![]()
August 13, 2020
As analysts continued to mull the balance implications of the latest inventory report, traders shrugged off a cooler shift in the overnight guidance to send natural gas futures a few cents higher early Friday. The September Nymex contract was up 1.5 cents to $2.197/MMBtu at around 8:40 a.m. ET. The overnight data from the American…
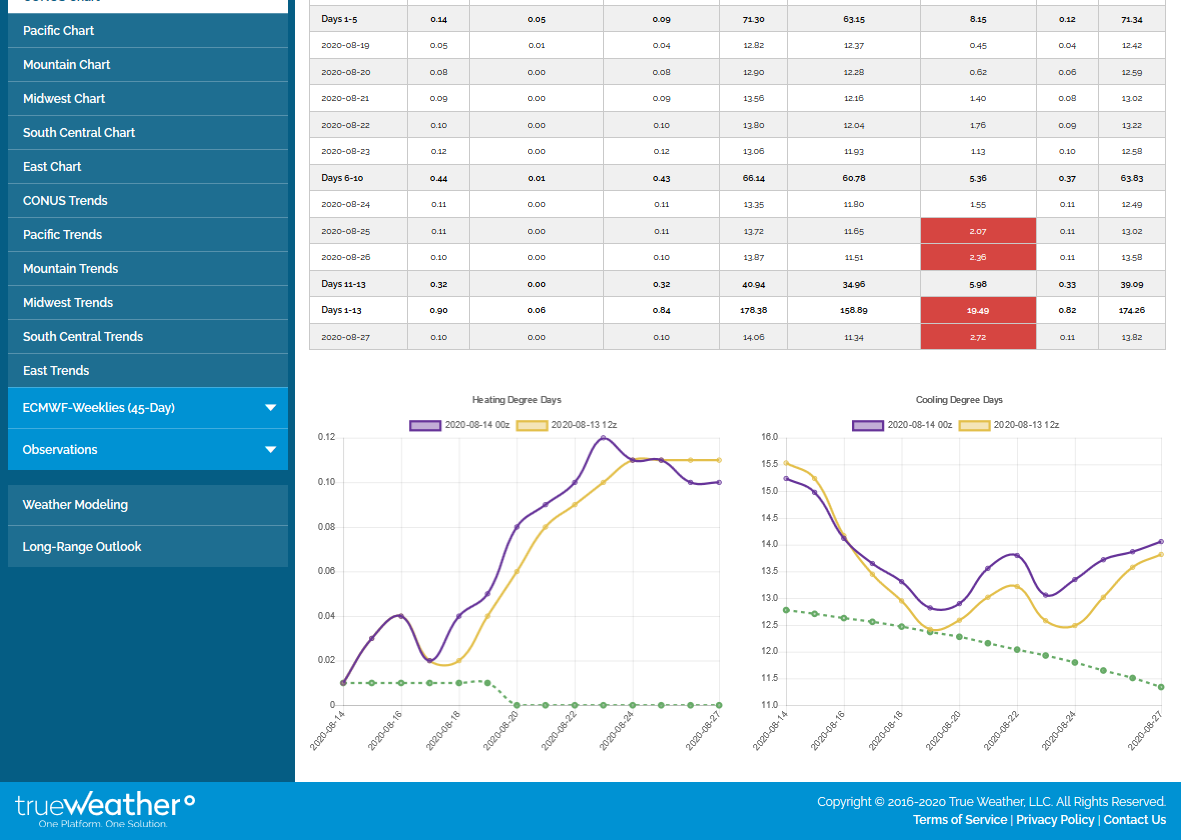
metmike: The European Ensembles were +4 deg WARMER and the pattern, to me in week 2 looks like one that is heating up after the cool weather before it, that was dialed in earlier this week with the spike lower.
As Larry and I discussed previously, there are other (bullish) factors at play, which allows the market to put the bullish spin on weather if it wants to.
Shortly after the Warmer EE was released, ng actually made new lows, so it was not reacting to it very early this morning. Then, the GFS came out with a solution similar to the previous one and COOLER than yesterday and the market went higher.
This is the warmer EE below and below that, the NOT warmer GFS.
The absolute change in DD is important, especially right when an updated model comes out but THE DIRECTION/TRAJECTORY/SLOPE of the DD in week 2 can be even more important............as it tells the market where we are headed more than any other metric.
The upward direction on ALL models, tells us the forecasts over the weekend and early next week are more likely to get hotter not cooler.
WARMER Eurpean model below
COOLER GFS Below
_8as2cpS.png)
The European model thru the first 10 days came out cooler and we've dropped from the highs in the last hour from that but we will clearly finish with monster gains.
Consistent with the outlook for it to heat back up again vs average, starting during the week 2 period:
| Week 3-4 Outlooks | ||
| Valid: 29 Aug 2020 to 11 Sep 2020 Updated: 14 Aug 2020 | ||
| Please provide comments using the online survey. | ||
Temperature Probability | Precipitation Probability (Experimental)  | |
| Click HERE for information about how to read Week 3-4 outlook maps | ||
NGI after the close Friday.
On what is typically a sleepy day in natural gas trading, Friday proved anything but as the front of the futures curve skyrocketed. Once the smoke had cleared, the September contract had surged 17.4 cents higher to $2.356, while October shot up 17.1 cents to $2.495. Spot gas prices also rallied as sweltering heat stoked…
August 14, 2020
Natural gas prices spiked on Friday by nearly 9%, even as the weekly storage report showed little movement.
Natural gas prices hit $2.367 by 2:26 pm EDT, an increase of 8.48% or $0.185, even as the EIA’s weekly storage report a day earlier showed a small increase of 58 Bcf in working gas in storage. The market had anticipated a larger build.
"Also bullish for natural gas on Friday were forecasts for hot weather and reports of increased LNG exports.
Front-month natural gas futures on Friday hit their highest since the end of last year on this data as air conditioning usage is expected to increase as people try to cope with the heat wave. This will increase the demand for natural gas.
This will be particularly true in Texas, where demand for power in general—and consequently natural gas—is expected to hit a record high today as the heatwave sets in, according to Reuters.
These record highs for power demand will come even as industrial activity has not yet returned to pre-pandemic levels.
This unprecedented power demand has led to increases in power prices in the western part of the United States, which has, in turn, boosted natural gas prices.
Front-month nat gas futures were up more than $0.15 to $2.335 on Friday afternoon.
LNG exports have also increased, with improved demand outlook over the next couple of weeks, although the EIA stated that U.S. LNG exports will remain at low levels for the remainder of the summer, with planned cargoes of LNG still being canceled. According to EIA data cited by Kallinish, 46 LNG cargoes were canceled in June, 50 canceled in July, 45 were canceled in August, and so far 30 have been canceled for September."
metmike: I don't think a heat wave anticipated since the start of the month and in the process of ending/already over in many places would cause much of a rally like that.
Natural Gas rig count was up another 1 from the all time record low of 68 on July 24th.
Splendid Saturday to you! Here's your weather: https://www.marketforum.com/forum/topic/57658/
How much will we heat up in week 2???
Modestly higher, gap higher open with week 2 forecasts, as expected on Friday, warming up.
However, we immediately closed the gap, trading just below Fridays highs which is often a bad sign.

The European model is looking WARMER than the GFS/American ensemble right now.
The gap and crap technical formation on the open has been a good indicator for price action so far(gap higher that fails from short term buying exhaustion).
We have pushed to new lows for the session and almost unch with the latest models not adding any heat.
We don't have to always trade exactly with every weather model but we might need models to heat up more overnight to keep going higher(with some confidence).
Coming off a decisive advance on Friday, natural gas futures were hovering close to even in early trading Monday as analysts highlighted a mix of potential bullish and bearish factors influencing prices to start the week. The September Nymex contract was off 1.1 cents to $2.345/MMBtu at around 8:40 a.m. ET. The latest forecast from…
August 17, 2020
metmike: European model cooler overnight..06z GFS ensemble also cooler.
Monday weather: https://www.marketforum.com/forum/topic/57723/
Monday after the close, NGI:
After another surprising rally at the end of last week, natural gas futures tapped the brakes Monday as traders appeared less confident in avoiding a storage inventory crunch ahead of winter. The September Nymex gas futures contract hit a $2.396 intraday high before settling the day at $2.339, off 1.7 cents from Friday’s close. October…
August 17, 2020