In W.Mn. and elsewhere we have a situation very similar to 1993 or worse. The prevented plant option is still being considered.
http://www.agweb.com/article/excess-rain-could-reduce-yields-34-similar-to-drought/
Btw it's sprinkling as I type this...just as it did in '93. It would rain with none predicted and just enough to tack on more wait time before field work could begin. We eventually "mudded" the crop in which later turned out to be disastrous yields in both corn and soybeans. Some plowed down their crops...we fed the low test weight corn to cattle and lost money doing that. Live and learn.
Thanks cliff,
This is true on excessive rains, though we almost never see the widespread, belt wide yield losses from excessive rains that we see with widespread major droughts. 1993 was the only time that happened.
On droughts, you can point to a dozen times going back to the 1930's when National yields were crushed.
Localized excessive rains have increased with climate change because the atmosphere can hold around 6% more moisture at a temperature of 1 deg. C warmer. Droughts, that were happening at least every decade, have only happened 1 time in the last 30 years(1988, then 2012).
Excessive rains will leach a lot of the nitrogen out of the soils, so additional applications need to be applied..........if possible.
https://crops.extension.iastate.edu/nitrogen-losses-after-heavy-rains
https://crops.extension.iastate.edu/cropnews/2014/06/estimating-nitrogen-losses-wet-corn-fields
The bad news is that this El Nino in the Pacific that has enhanced recent rainfall may stick around for another couple of months.
The good news is that the extended models here on Friday show a drier trend, working in from the north during week 2. With chilly temps, drying rates will be not be optimal but an increasingly strong May sun would help. As always, 2 week weather models are not reliable.
Cliff and MetMike
Here in LaSalle County, Illinois a few planted (for the first time) many days ago. Nearly all will, as the coffee shop says, plant again. 90% or more have not started, nor will they for most likely until after the 14th as more rain is predicted for Mon-Wed.
That being said, the funds are NOT one contract scared enough to short cover.
MetMike, you have chronicled many weather events. HOW desperate is it going to have to get to start short covering.
I bought relatively cheap calls expiring today convinced a 20 cent corn and 30-40 cent bean EXIT would commence by Wednesday. Wrong! (No doubt it commences Sunday night!)
Great to read you again tjc,
If not for the weather, corn fundamentals are horrible.
Exports have been poor(dollar pretty strong is hurting those to) the USDA has been increasing stocks and planted acres were projected to be massive.
The huge funds also have a record short position on, despite covering some of it this week.
So weather is the only chance we have here and its potentially very bullish but only if the wet weather continues for at least another 2 weeks.
You got a sample of what will happen if we come in here and the forecast suddenly turns drier. This morning spike lower at the open was the result of a couple of drier models a few hours earlier for the week 2 period.
If it would dry out in 2 weeks, planting will be late in many places but corn will still get planted.
If we go out farther than that(add another week) then we really start to lose corn acres. If we got thru the month of May and stay wet, corn acres plunge and it doesn't matter how bearish everything else is..........if you cut 4-5-6-7 million acres off of estimates for planted corn acres, the supply side suddenly goes from very bearish to bullish........until the market reconfigures prices.
If that would happen(IF) fund shorts of 300,000 contracts will cover. That's a lot of buying power and it would come with some extreme short term, hard to predict spurts.
Like, lets say next Monday, the forecast gets wetter. Funds could decide to buy 50,000+ contracts in a short period of time and they won't be waiting for the price to come down to resting orders.
If that happened, corn could have a double digit gain in 1 day. It's conceivable, if the weather got wet enough for long enough with this environment(big funds so short and leaning the wrong way) that we could have a limit up day.
This is not my prediction based on todays weather models, that are a bit drier in week 2 but I will say with high confidence, if week 2 turns excessively wet next week, the current price will be left the dust.
Another item. We have had a dozen planting delay scares in the past 3 decades. They were all temporary and all resolved at some point and as soon as a better planting weather forecast appeared, the market crashed quickly. We have bounced 20c on this with super bearish fundamentals. There is downside risk here, should the pattern turn more favorable for planting.
The day that happens and is seen to be likely, funds may pile on the short side........assuming we can still get most of the crop planted. If its too late to plant alot of the crop, when the weather finally dries out, prices will probably be closer to $4, depending on how many acres the market thinks were lost.
Another item. Things always look the most bullish at the top and the weather right now, if it represents the most bullish forecast we feed the market for the rest of the month..............then the top is going to end up being around here, for what turns out to be a weather scare.
MetMike
Is there another time period before grain close to anticipate a new weather forecast?
tjc,
Weather models come out around the clock. The GFS is 4 times a day.
11a-Noon is a key time frame, then the GFS ensembles until 12:30pm. Those are the biggies during the day session. Add 6 hours to those times for the other 3 model runs.
The European model stuff comes out after the close, until just before 3pm. This is all CDT.
It's more than what's being forecasted, it's what's already happened... our last 24" wet snowfall and subsequent cold rains have packed and sealed our soils so that air cannot get thru to dry them out. Flooded areas have become stagnant with a foul swamp-like smell. The damage has been done and not likely to be undone 'til the next "freeze-thaw" cycle. So called "Vertical tillage" won't correct these problems and may make them worse. We have the benefit of experience in wet years to look back upon and this will be our 4th wet year in a row.
Related discussions:
Mississippi Flooding 157 year high
Started by joj - May 4, 2019, 7:26 a.m.
https://www.marketforum.com/forum/topic/29279/
What if this weather is the new normal ?
Started by mcfarmer - April 30, 2019, 8:40 p.m.
https://www.marketforum.com/forum/topic/28957/
Worst floods in World History/US rain records
Started by metmike - May 4, 2019, 11:56 p.m.
https://www.marketforum.com/forum/topic/29362/
One of several stories that can be found.
Thanks cliff,
From your link:
"The National Weather Service is now projecting flood levels to reach the second- or third-highest ever at several Mississippi River towns in northeast Missouri - Hannibal, Louisiana, Clarksville and Winfield - and western Illinois towns such as Quincy, Alton and Grafton."
This clearly is the wettest that its been in the last 26 years...........since 1993 for this area.
I decided to look back on records to see when the greatest flooding on the Mississippi occurred. Turns out that the worst flooding in this countries history occurred 92 years ago (glad that the internet gives us access to weather records).
https://www.weather.gov/media/jan/JAN/Hydro/Flood_History_MS.pdf
"The Great Mississippi Flood of 1927 was the most destructive flood in United States history. This flood extended across Illinois, Indiana, Missouri, Kentucky, Texas, Oklahoma, Kansas, Tennessee, Arkansas, Mississippi, and Louisiana. At one point the river was approximately 80 miles wide near Vicksburg, MS. The flooding was a result of persistent heavy rainfall across the Central U.S. starting in August 1926 and continuing through the spring of 1927. As unprecedented amounts of run-off from the different tributaries combined, extreme water levels churned by wind overwhelmed the levees protecting the Mississippi Valley floodplains, breaching the flood defenses as the water traveled southward. It was not until August 1927 that the last of the floodwaters had flowed into the Gulf of Mexico.For Mississippi, the most significant flooding"
This is the link that goes back the farthest with regards to flooding on the lower Mississippi:
The worst flooding, by far was in 1927, followed by 1973, then 1937.
https://www.weather.gov/lix/ms_flood_history
| 1927 | January-May | The greatest flood in modern history on the Lower MS River! |
I'm looking for Upper Mississippi records now.
Here a good link with information regarding flooding along the entire Mississippi River.
https://en.wikipedia.org/wiki/Mississippi_River_floods
Main article: Great Mississippi and Missouri Rivers Flood of 1993
The flood occurred on the Mississippi and Missouri rivers and their tributaries between April to October 1993. The flooded area totaled around 30,000 square miles (80,000 km²)[14] and was the worst since the Great Mississippi Flood of 1927 as measured by duration, square miles inundated, persons displaced, crop and property damage and number of record river levels.
On further review, we DID find a worse flood than 1993 on the Upper Mississippi:
https://en.wikipedia.org/wiki/Mississippi_River_floods#Flood_of_1788
Main article: Great Flood of 1844
The largest flood ever recorded on the Missouri River and Upper Mississippi River in terms of discharge. The adjusted economic impact was not as great as subsequent floods because of the small population in the region at the time. This flood was particularly devastating since the region had few if any levees at the time. Among the hardest hit were the Wyandot who lost 100 people in the diseases that occurred after the flood. The flood also is the highest recorded for the Mississippi River at St. Louis. After the flood, Congress in 1849 passed the Swamp Act providing land grants to build stronger levees
So to review:
https://en.wikipedia.org/wiki/Mississippi_River_floods#Flood_of_1788
Worst flooding in USA history, looking at all rivers--1927
Worst flooding for the lower Mississippi River.
1. 1927
2. 1973
3. 1937
4. 2011
Worst flooding for the Upper Mississippi River using actual discharge/levels
1. 1844
2. 1993
So although recent rains have been excessive and the most in over 2 decades for the Midwest and rains HAVE increased from climate change and an atmosphere that can hold 6% more moisture, we have not exceeded records in the past.........other than at isolated locations, which is not unusual for extreme weather events.
I remember the upper Mississippi flood of 1993, as I was living in Memphis at the time. It was the first time in years, that they had to install the flood gates on the levis to protect Memphis from the high waters. And waters broke the levis on the Arkansas side, and flooded a lot of people out of their homes.
You weren't there in 2011 were you Mark?
So when levies are in place wouldn’t that raise the river level given equal amounts of flow ?
Ohio river flood of 1937
https://www.weather.gov/lmk/flood_37
The Ohio River Great Flood of January 1937 surpassed all prior floods during the previous 175 years of modern occupancy of the Ohio River Valley. The overall scope of the flood surpassed the major floods of 1884 and 1773, and geological evidence suggests the 1937 flood outdid any previous flood.
The whitewater river flood of 1913 was 39 feet compared to the next highest at 27.78. The most recent was 20.8 feet on Feb 8 of this year. 20.8 puts about 35% of my tillable ground under water.
https://water.weather.gov/ahps2/hydrograph.php?wfo=iln&gage=brki3
Scroll down for flood levels
Thanks Cutworm.
Great stuff. I'll have more on the January 37 flood here on the Ohio River when I get back. Anyone that lives close to the Ohio has heard about that one.
Flooding along the Ohio River in 1937 turned it into a 25-mile-wide lake
https://www.indystar.com/videos/news/history/retroindy/2018/06/07/ohio-river-flood-1937/109511888/
https://en.wikipedia.org/wiki/Ohio_River_flood_of_1937
"Six to 12 inches (300 mm) of rain fell in Ohio during January 13–25, 1937, totals never before or since equaled over such a large area of Ohio. January 1937 remains as the wettest month ever recorded in Cincinnati"
The runoff from all that rain is what fed into the Ohio River, which is along the southern border of Ohio.
https://www.weather.gov/lmk/flood_37
.gif)
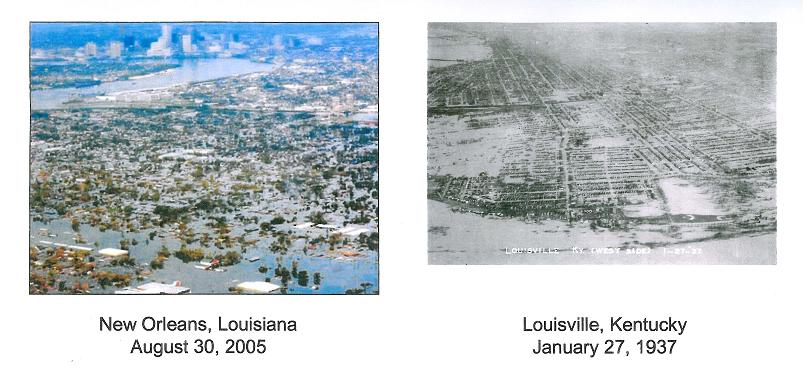 A comparison of flooding from Hurricane Katrina in New Orleans and flooding in Louisville from the great flood
Thanks for the pictures from IA cliff.
Actually, IA is not the main problem as you can see below. Those pictures represent a very small fraction of the state mostly along the far west border, in the Missouri River flood plain(and some northwest locations) and also the far east, in the Mississippi River flood plain. This is a small fraction of the land area used to grow corn in IA.
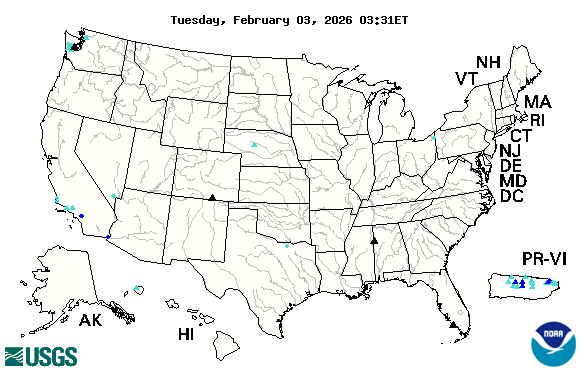
As you can see below on the first stream flow map, most of the state has stream flows shaded in green which are 25-75% of average and considered average. Blue shaded dots are 90% plus and the problem areas. Black dots are extreme.
It's the areas east/southeast of IA that have it really bad: IL/IN/OH. Also up around you in sw.MN.
For perspective, I've included the same map from 1 year ago so you can see the wet areas then that did include much of IA and you in MN.
https://waterwatch.usgs.gov/index.php?id=ww_past
The map below is from 1 year ago
This map may illustrate it a bit better. The black triangles are rivers above flood stage.....not many in IA, except along its borders. . IL, our #2 corn producer has it super wet and only a fraction of the corn crop planted.
https://waterwatch.usgs.gov/index.php?r=us&m=flood&w=map
Map of flood and high flow condition (United States)
| or |
Crop progress report from Monday:
https://release.nass.usda.gov/reports/prog1819.txt
Planting progress
Corn 15% vs 27% average
Beans 3% vs 6% average
HRS 13% vs 33% average
Winter wheat 64% gd/Ex vs 62%
Planting delayed states in corn:
Illinois 9% planted (5yr avg 43%)
Indiana 2% (5yr 17%)
Minnesota 2% (5yr 24%)
Ohio 2% (13%)
Spring #wheat:
Minnesota 2% (33%)
N. Dakota 5% (21%)
S. Dakota 8% (60%)
Montana 23% (34%)
By mcfarmer - May 6, 2019, 7:52 a.m.
It’s been wet here in NW Iowa.
We got to go Saturday and Sunday, worked nearly straight through. Sitting at about 1/3 planted now.
+++++++++++++++++++++++++++++++++++++++++++++++++++++++++++++++
By mikempt - May 6, 2019, 9:24 a.m.
The Amish in Lancaster have the corn planted
+++++++++++++++++++++++++++++++
By metmike - May 6, 2019, 11:45 a.m.
Thanks mike/mcfarm, IA, as noted yesterday is only too wet to plant along the west and east borders.
It's IL/IN/OH that are completely water logged and a looooooooong way from planting. MN is not quite as bad as the ECB but chilly temps are an additional issue there.