I’ll buy the CO2 as plant food business but if springs like we’ve had the last two years is what climate change is going to bring us you can keep it.
My little corner of the world will be greener, but it won’t be corn.
mcfarmer,
This must be one of the most frustrating things being a farmer. I can understand it.
It's true, the warming of 1 degree C over the last century had added around 6% more moisture to the atmosphere which is causing more precipitation in every season.
Individual years that are wet, like this one of course are from individual weather patterns but Springs will be wetter with climate change..........as will Summer's, Falls and Winters.
So are you sure that you don't want this, seen below with the 2 graphs?
https://www.nass.usda.gov/Charts_and_Maps/Field_Crops/soyyld.php
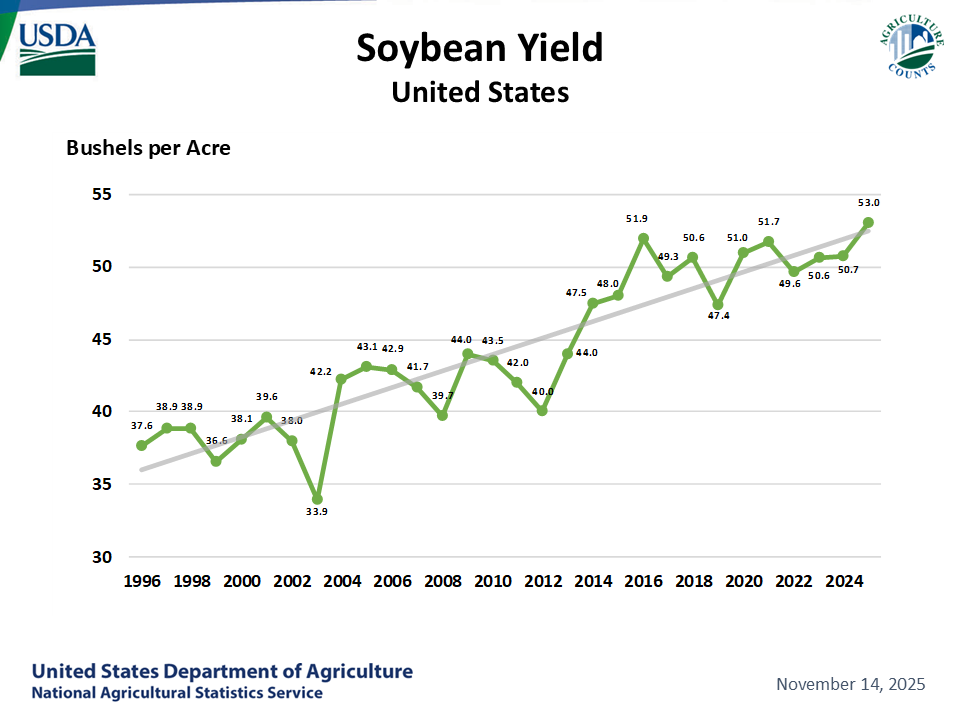
There obviously are other contributing factors with genetics and farming technology (+75%) but the +CO2 and weather(+25%) have been a big plus.
With Corn, it's a different picture because of the introduction of nitrogen fertilizer causing corn yields to triple real fast and not as much to do with CO2 or weather during that initial tripling. However, recent decades have featured a steady increase, along with a steady increase in CO2 and beneficial weather.
http://crazyeddiethemotie.blogspot.com/2014/10/corn-questions-from-food-inc-worksheet.html
https://www.agry.purdue.edu/ext/corn/news/timeless/yieldtrends.html

Let's see what's worse, wet Springs or droughts at least every 10 years like we used to have before "climate change"
Let's go back to the 1930's in the USA for an extreme version of the OLD climate:
The map below is the drought index in 1934. This was one of the worst times during a drought that lasted for much of that decade. It was not permanent climate change and more of a freak weather phenomena. Human's poor farming strategies in those days did make things worse but today's climate change makes a drought lasting that long much LESS likely to happen.
Can you imagine if we had this going on today?

It would absolutely be seen as the affects of human caused climate change............and I do believe there has been man made climate change, which is why the Cornbelt and your crops have been treated to the longest stretch of drought free conditions in recorded history.
Only 1 major, widespread drought in the Cornbelt from 1988 to 2019(2012).......over 3 decades, when the average historically was over 1/decade(if you throw out the 1930's as an aberration.
Instead of having the average 3 major droughts in the Cornbelt over the last 30 years, during (so called catastrophic) human caused climate change, there has only been 1.........along with the increasing CO2 causing yields to go up 25% from atmospheric fertilization because of the proven law of photosynthesis.
Here's what temperatures were like during the Dust Bowl 1930's.

This fact also helps to put it into perspective mcfarmer.
If we would dial down the atmospheric CO2 back to pre industrial levels from the current 411 parts per million to around 280 ppm and cool off the planet by 1 deg. C back down to where the global temperature was then, the sharp decrease in plant growth/crop yields and world food production would result in 1 billion people starving to death with in 3 years.
Food prices would likely triple as the market spiked high enough to ration demand down to the lower supplies.
But on average.................we would have drier Springs and better planting(that would lead to 3 times as many widespread major droughts like the good old days with the good old climate).
http://www.fao.org/worldfoodsituation/csdb/en/
Estimates for global cereal production, utilization and stocks raised sharply following historical adjustments for China
Release date: 04/04/2019

Of course technology is responsible for 75% of the increase in this world food production but 25% of the increase has come from that climate change(and increased CO2) associated with that fake climate crisis we keep hearing about.
The last 40 years have featured the best weather for life and crop growing on this planet in the last 1,000 years............yeah, it's also featured some wetter Springs and delayed planting.
Are you sure that you want the old climate?
Out of all the different groups, farmers should be able to appreciate the benefits of climate change the most.
However, how often do you read about 25% of the increase in soybean yields being attributed to the increase in CO2?
Never.............except here. We are to believe its all from technology. None of you guys know that climate change and the increase in CO2 causing it, are massive contributors to your bin busting crops.
How do we really know CO2 is making this sort of a contribution(obviously, we have the weather observations) where is the proof about the CO2?
Glad I asked(before you did). Here it is:
Here is irrefutable evidence using empirical data to show that the increase in CO2 is causing a huge increase in crop yields/world food production.
We can separate the CO2 effect out from other factors effecting crops and plants with many thousands of studies that hold everything else constant, except CO2.
Observing and documenting the results of experiments with elevated CO2 levels, tell us what increasing CO2 does to many hundreds of plants.
Here's how to access the empirical evidence/data from the site that has more of it than any other. Please go to this link:
http://www.co2science.org/data/data.php
Go to plant growth data base:
http://www.co2science.org/data/plant_growth/plantgrowth.php
Go to plant dry weight(biomass):
http://www.co2science.org/data/plant_growth/dry/dry_subject.php
Pick the name of a plant, any plant and go to it based on its starting letter. Let's pick soybeans. Go to the letter S,http://www.co2science.org/data/plant_growth/dry/dry_subject_s.php
Then scroll down and hit soybeans. This is what you get:
http://www.co2science.org/data/plant_growth/dry/g/glycinem.php
Glycine max (L.) Merr. [Soybean]
Statistics
| 300 ppm | 600 ppm | 900 ppm | |
| Number of Results | 238 | 25 | 3 |
| Arithmetic Mean | 48.3% | 71.2% | 61% |
| Standard Error | 2.4% | 7.9 | 11.3% |
This tells us that there were 238 studies with the CO2 elevated by 300 ppm. The mean increase in plant biomass was 48.3% from all those studies.
The individual studies are listed below that.
A very rough estimate for the increase in CO2 is something like +1% in plant growth for every 5ppm increase in CO2 but it varies a great deal from plant to plant. The increase in CO2 from 280 ppm to 411 ppm is +131 ppm which would equate to an increase of around 26%.
The increase in growth would be greatest at the lowest levels of CO2(at 280 ppm, plants were in CO2 starvation mode) but they would continue in most plants to 1,000 ppm. The studies done above that increased CO2 by 600 ppm would have elevated them to close to 1,000 ppm. You will note that going higher than that caused yields to start dropping.
It's extremely unlikely that CO2 levels will ever get close to going up another 300 ppm, let alone to the even more beneficial level of 600 ppm higher. Going to 900 ppm higher, in the studies, establishes the level at which the benefits stop.
So let's actually see how much recent wetter weather(Springs) have contributed to planting delays.The list below includes 33 year worth of data.
The last 2 years are in the top 10 and we've had 4 wet Springs in the last 10 years. 2011, 2013, 2018 and 2019. You can include 2008 in there if you want but interestingly, you have to go back to 1999 before that.
So there has been an increase in wet Springs looking at 10 years but not looking at 20 years.
National corn planting progress (since 1987) on April 28

The other thing is that this data is for April 28th, when the corn planting average is 27%. 12% behind can be caught up in a week(it won't be this year, as we will unquestionably be falling farther behind the next 2 weeks or it wouldn't be worth having this discussion right now).
Based on the above stats only 2013 and 1993 really stand out but what will matter is the planting progress in mid-May.
Here is a good discussion on that:
https://www.beefmagazine.com/grain-prices/will-2013-be-slowest-corn-planting-year-ever
So was this the slowest ever(2013)? That depends on how you judge “slowest.” We’ve always shown 1993 as the slowest year, primarily because it got started so slowly, with less than 10% of acres planted by the end of April. Like this year(2013), producers caught up some in mid-May 1993, planting 53% of the acres between May 5 and May 19 of that year.
But there are a number of years that had a lower percentage of acres planted by week 21, which this year corresponds to May 26. Only 71% of acres were planted by this week in 1995, and only 78% were planted in 1996. Only 82% were planted by now in 2009.
The national average yield in 1995 was 13.2 bu. below trend. For 1996, the yield got within 1.5 bu. of trend, while 2009 saw the current record corn yield of 164.7 bu./acre. That was 11.9 bu./acre above the 1960-present trend, and 8 bu./acre larger than the 1996-present “biotech era” trend.
“So are you sure that you don't want this, seen below with the 2 graphs?
If it means springs like this are what we have to look forward to, then maybe.
With all respect I understand your positions on the benefits of this climate shift but surely there will be negitives.
Strictly anecdotal but last year was the first I’ve ever seen a field not planted around here due to being too wet. Some areas, sure but this was an entire 320 acre piece.
We have a pond in one pasture, no water runs into it. In 1993 water ran out of the pond and into surrounding fields. Only time it has ever done it. Other than now, it’s been running out since thawing. I bought a few loads of fill dirt from the local gravel pit to build a berm and raise the lane. The guy said the water in their pit is 4 feet higher than he’s ever seen it. He’s older than I and his dad started the pit.
Like I asked, is this spring the new normal ?
yes this is the new normal...right up until the newer takes over. This is mother nature thru billions of years....cold, warm, wet, and dry...cycles of weather. Just a few years ago we used to moldboard plow every acre we farmed and then disc it 3 times before planting....glad we both do not do this anymore and also glad we do not have the time
"With all respect I understand your positions on the benefits of this climate shift but surely there will be negatives."
Yes, that's exactly what this discussion is about mcfarmer. One of the negatives with more rain, is that, at times it will be too much rain. In the yield graphs earlier, those were yields at the end of the year............after all the weather happened.......wet Springs, dry Springs, wet Summers, hot and dry Summers. I assume that the most important thing to a farmer is how big the crop is at the end of the year.
Since the extra CO2 and weather has added 25%+ to the size of C3 plants at the end of the year, AFTER all the weather was over, why would you prefer drier Springs and a smaller crop?
With corn, the increase in production from weather/CO2 is closer to 15% because it takes the C4 pathway for photosynthesis that doesn't benefit as much as C3 plants like soybeans.
http://www.co2science.org/data/plant_growth/dry/z/zeam.php
Let's say your farm has been averaging 180 BPA with this new climate.........that includes all the weather/CO2. Explain to me why you would prefer the old climate with 153 BPA(15% less) weather and CO2 levels but drier Springs(and more yield killing droughts)?
There's only one reason that I can think of to explain why picking the 180 BPA new climate yields/production is not a no brainer.
https://www.marketforum.com/forum/topic/28034/
"A cognitive bias is a systematic pattern of deviation from rationality, which occurs due to the way our cognitive system works. Accordingly, cognitive biases cause us to be irrational in the way we search for, evaluate, interpret, judge, use, and remember information."
This is why most people view climate change with tunnel vision based on them being told only bad things about it, when the good things outweigh the bad by a very wide margin.
I'm especially glad to be having this conversation with somebody that is very intelligent, understands what contributes to crop production at the end of the year and has shown objectivity when looking at facts in the past. It shows that anybody(and everybody) is effected by cognitive bias.
But maybe I'm missing something important that makes having 27 BPA lower yields at the end of the year that would be part of going back to the old climate a choice for you.
Again, I understand your frustration right now and do know that, even with the new wetter climate, extremely wet Springs like this one will still not be "the new normal".
They will just happen more frequently. You should also know that the current El Nino, a natural phenomena is likely responsible for much of this wetness(like it was in 1993). However, the atmosphere can hold 5-7% more moisture at this 1 Deg. C warmer temperature.
I can't find any specific studies that on wetter Springs in the Midwest but showed you the stats on planting that I do have.........along with following Corn belt weather closely for over 3 decades. Climate is usually defined as weather averaged over a period of 30+ years.
Here is a wonderful study that looked at Midwest Summer weather over the last 6 decades.1950-2009.
https://dailycaller.com/2018/02/14/midwest-summers-six-decade-cooling/
"Summer precipitation increased 15 percent and average temperature decreased about half a degree Celsius, according to the study."
metmike: Much of this was actually caused by the increase in tightly packed rows of corn and the evapotranspiration positive moisture feedback......which has resulted in a "micro" climate change over the Midwest that IS the new normal and IS a part of why recent yeilds have continued to set records(along with the increasing CO2).
I asked for any negative effects of this climate shift. Any you can think of ?
Gotta be able to plant corn in order to get those record (national) yields.
Thanks.
In our neck of the woods we never had a crop failure due to dry weather
The great lakes gives us moisture
Wet weather is a much greater risk "here" than dry
The times we suffer from dry is when the crop is planted late and summer heat and pollinataion get screwed up
Early plant beats the summer heat
Can't change it but it is not good for us
The world may be greener but that does not pay our bills
Still got ponds and next week looks bad
At least we did not get 4-5" like some did
3" catches us until next week
Climate change is doing us no favours "here"
By mcfarmer - May 1, 2019, 8:04 a.m.
"With all respect I understand your positions on the benefits of this climate shift but surely there will be negatives."
By metmike - May 1, 2019, 7:22 p.m.
Yes, that's exactly what this discussion is about mcfarmer. One of the negatives with more rain, is that, at times it will be too much rain.
By mcfarmer - May 2, 2019, 7:48 a.m.
" I asked for any negative effects of this climate shift. Any you can think of ?
Gotta be able to plant corn in order to get those record (national) yields."
mcfarmer,
Are you actually reading any my responses? Scroll up. One of the key issues of this entire thread is the one measurable/legit negative to the crops in the Midwest...........too much rain in the Spring causing planting delays. I've discussed and analyzed it to death in numerous posts now and can't offer much more comprehensive, empirical data and thoughts.
For you to keep repeating the same question and not let the answers and discussion in, is just more evidence of:
https://www.marketforum.com/forum/topic/28034/
"A cognitive bias is a systematic pattern of deviation from rationality, which occurs due to the way our cognitive system works. Accordingly, cognitive biases cause us to be irrational in the way we search for, evaluate, interpret, judge, use, and remember information."
Wayne,
Actually, Canada is one of the countrys that will benefit the most from climate change.
Canada is a huge country. It's biggest limiting factor with regards to agriculture and crops is that its just too cold, except in the south.
Since the effects of global warming in climate change are more pronounced in the higher latitudes(the coldest places warm the most, especially during the coldest times of year and day) the benefits are the greatest in regions that are currently too cold for growing crops.
This includes areas where corn is currently grown but are hard pressed to accumulate enough growing degree days for corn to mature before the first freeze.
Again, I understand the frustration of not being able to plant early this year because of the soils being too wet and wish that I could offer a warm and dry forecast.
One thing that I didn't mention to mcfarmer is that global warming means milder Winters and Springs so that soils will warm up quicker and cause seed germination/emergence to be faster after planting.
Planting equipment today can get fields planted many times faster than 40 years ago.
https://livinghistoryfarm.org/farminginthe70s/machines_08.html
Like everything else in agricultural technology, planters are getting bigger. In the late 2000s, John Deere came out with a corn planter that can plant 48 rows spaced 30 inches across – so, when the planter is spread out across the field it has a wing span of 120 feet.
Just to make it clear.
This is NOT the new normal.
The "new" atmosphere, with 6% more H2O is going to produce more rain then before............but not 6 times more rain or even 60% more rain.
It isn't that simple to just add 6% more rain/precip as some places might see more than that and some less but the same weather patterns as before will still dominate and be responsible for these kind of extremes/aberrations.
The current pattern is a weather pattern. The added atmospheric moisture is certainly enhancing rainfall amounts but if we went back to the "old" atmosphere, amounts would still have been excessive, likely just a bit less than this.
We are at the extreme end of the wet weather and climate spectrum here............defined in both old climate and new climate terms/standards.
This is temporary and has always been the case, these extremes represent a small portion of the weather spectrum......and not the new normal.
How do I know that?
I don't for sure. Maybe a warmer planet will cause more blocking and slow moving features that cause stalling and heavier rains.........but this pattern is NOT an example of that.
The physical laws in the atmosphere still apply to weather patterns and they will continue to change from one extreme to the other with a lot in between..........as they always have.
Additional discussions related to this can be found at:
Worst floods in World History/US rain records
Started by metmike - May 4, 2019, 11:56 p.m.
https://www.marketforum.com/forum/topic/29362/
Mississippi Flooding 157 year high
Started by joj - May 4, 2019, 7:26 a.m.
https://www.marketforum.com/forum/topic/29279/
Excess rain
Started by cliff-e - May 3, 2019, 6:55 a.m.
https://www.marketforum.com/forum/topic/29183/
Grains/Corn May 2, 2019
https://www.marketforum.com/forum/topic/29118/
Reviewing stats for historical flooding:
https://en.wikipedia.org/wiki/Mississippi_River_floods#Flood_of_1788
Worst flooding in USA history, looking at all rivers was in 1927
Worst flooding for just the lower Mississippi River.
1. 1927-worst for all rivers in history
2. 1973
3. 1937
4. 2011
Worst flooding for just the Upper Mississippi River using actual discharge/levels
1. 1844
2. 1993
So although recent rains have been excessive and the most in over 2 decades for the Midwest and rains HAVE increased from climate change and an atmosphere that can hold 6% more moisture, we have not exceeded records in the past.........other than at isolated locations, which is not unusual for extreme weather events.