
Get all the comprehensive weather here:
https://www.marketforum.com/forum/topic/83844/
Take these LONG RANGE forecasts with a grain of salt, however the SUPER El Nino increases the odds and confidence ABOVE a typical seasonal outlook.
https://www.cpc.ncep.noaa.gov/products/predictions/30day/
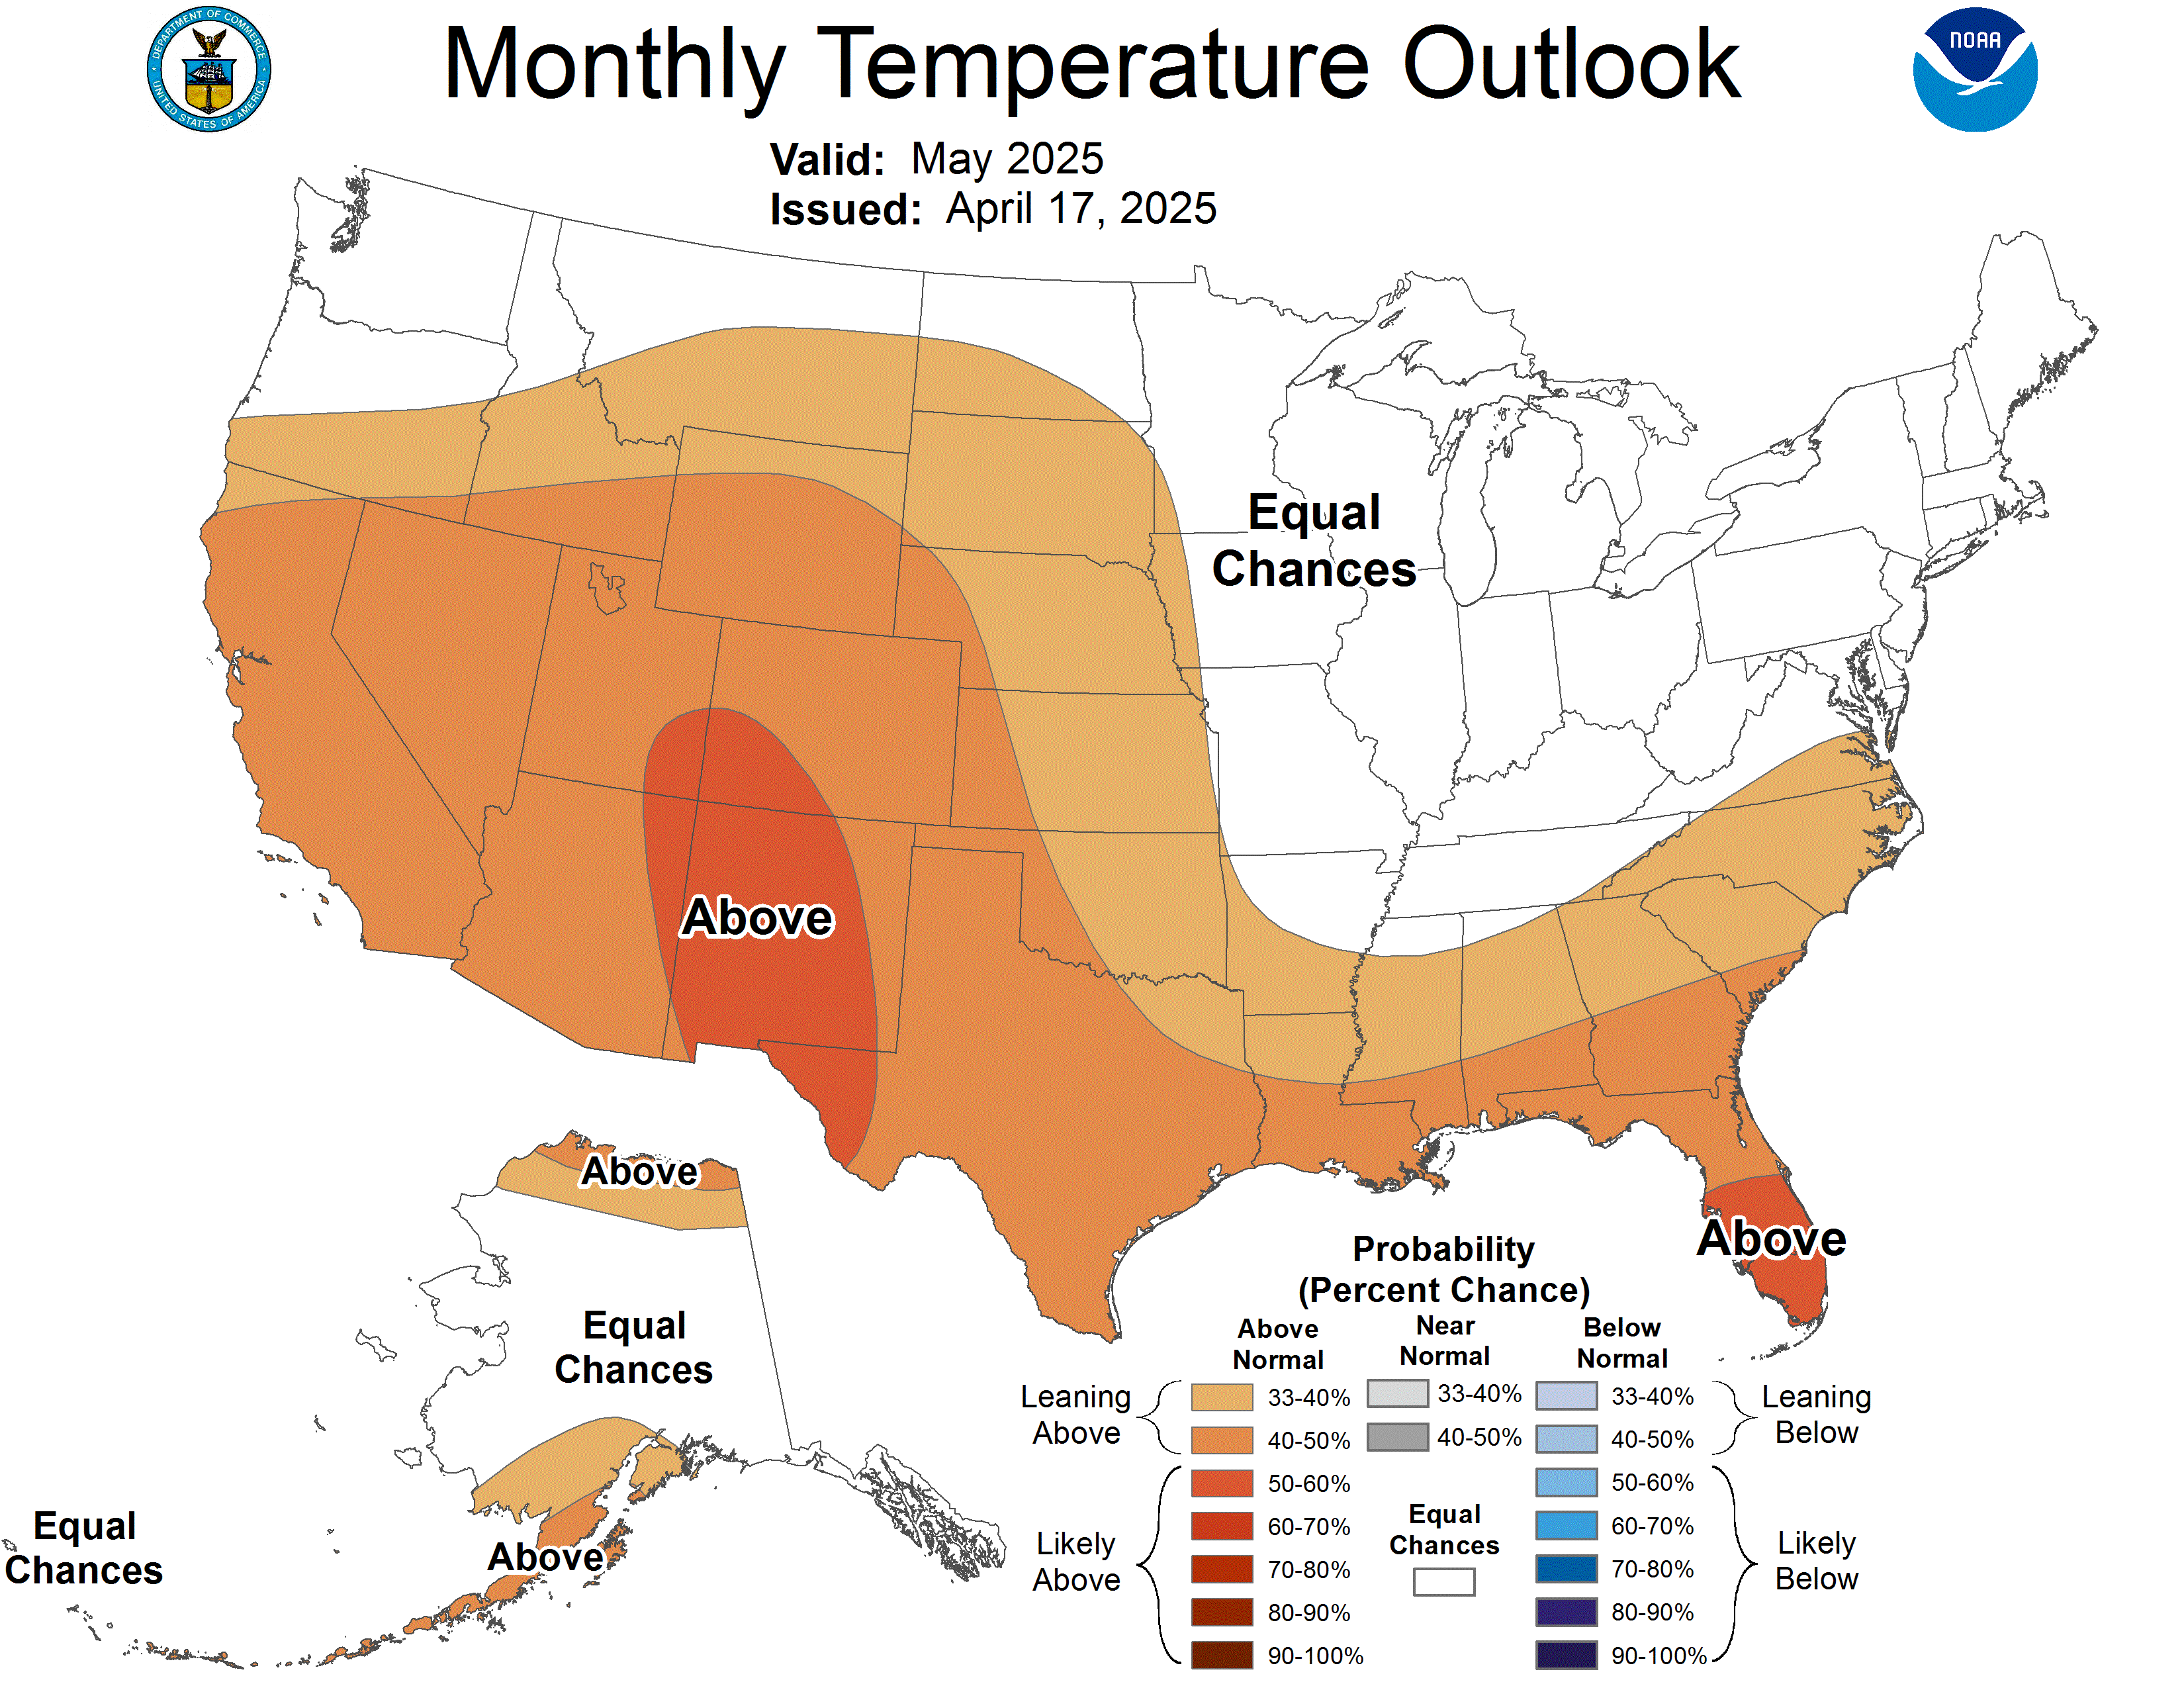
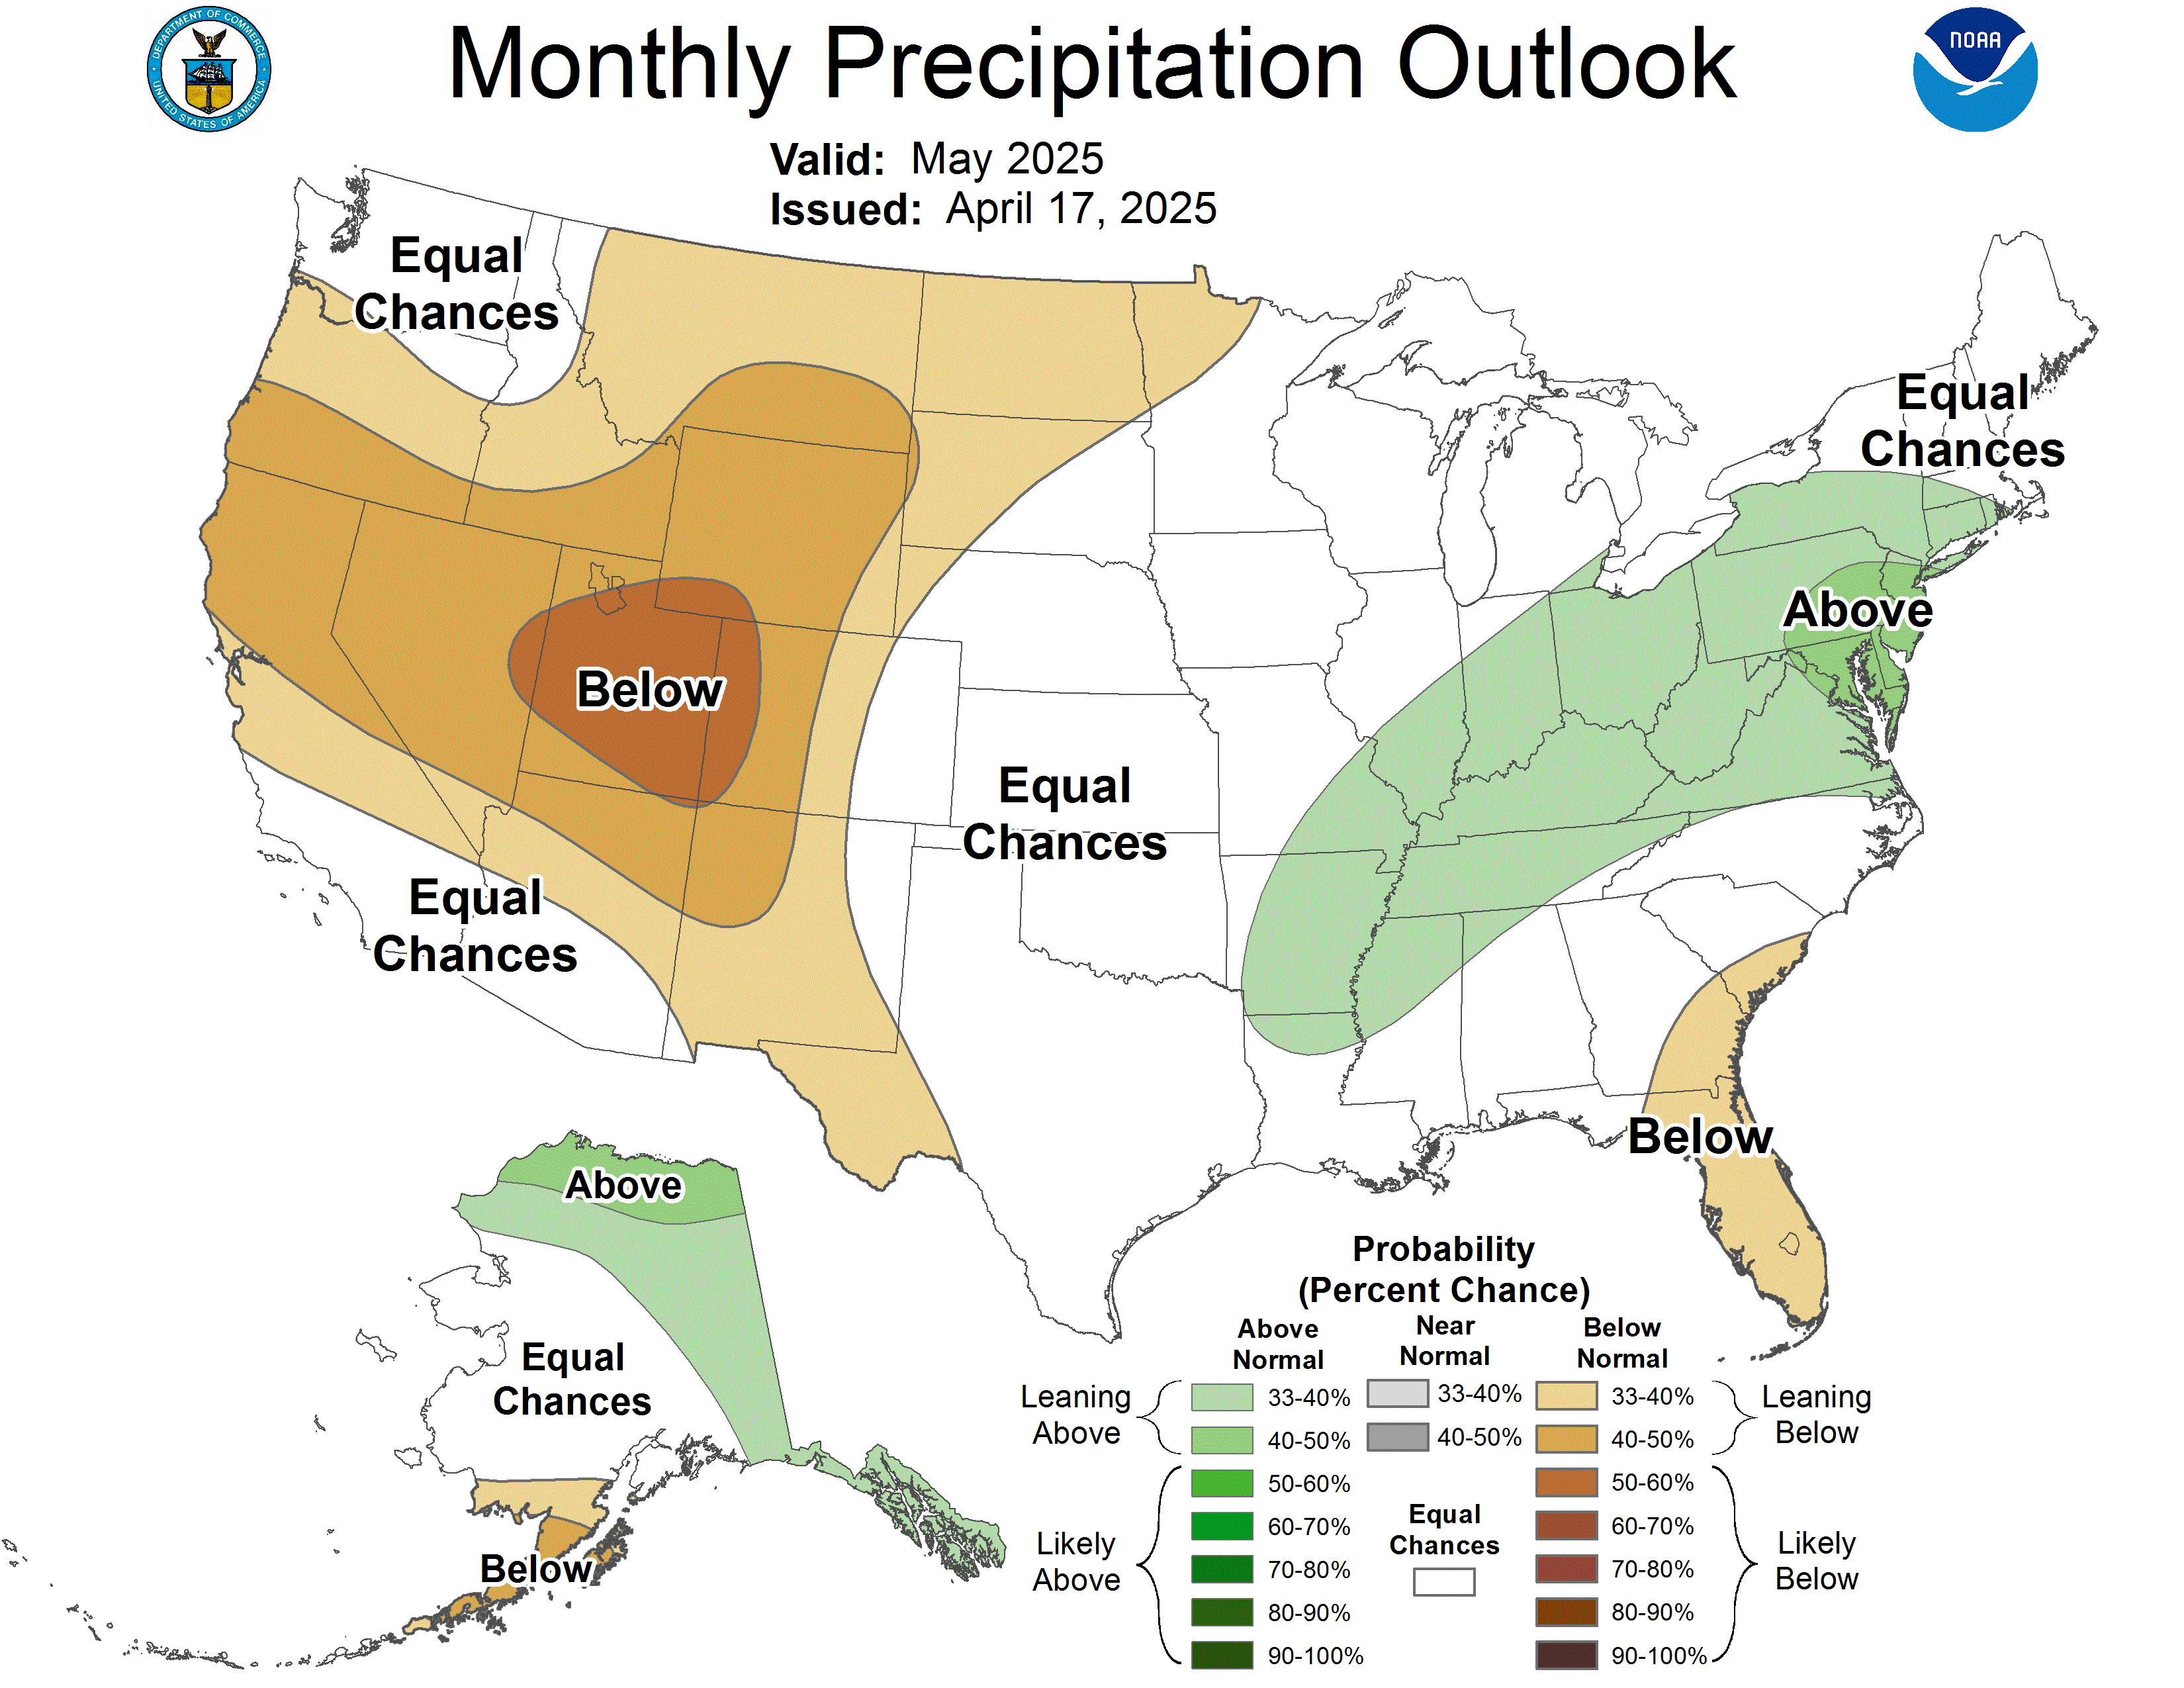
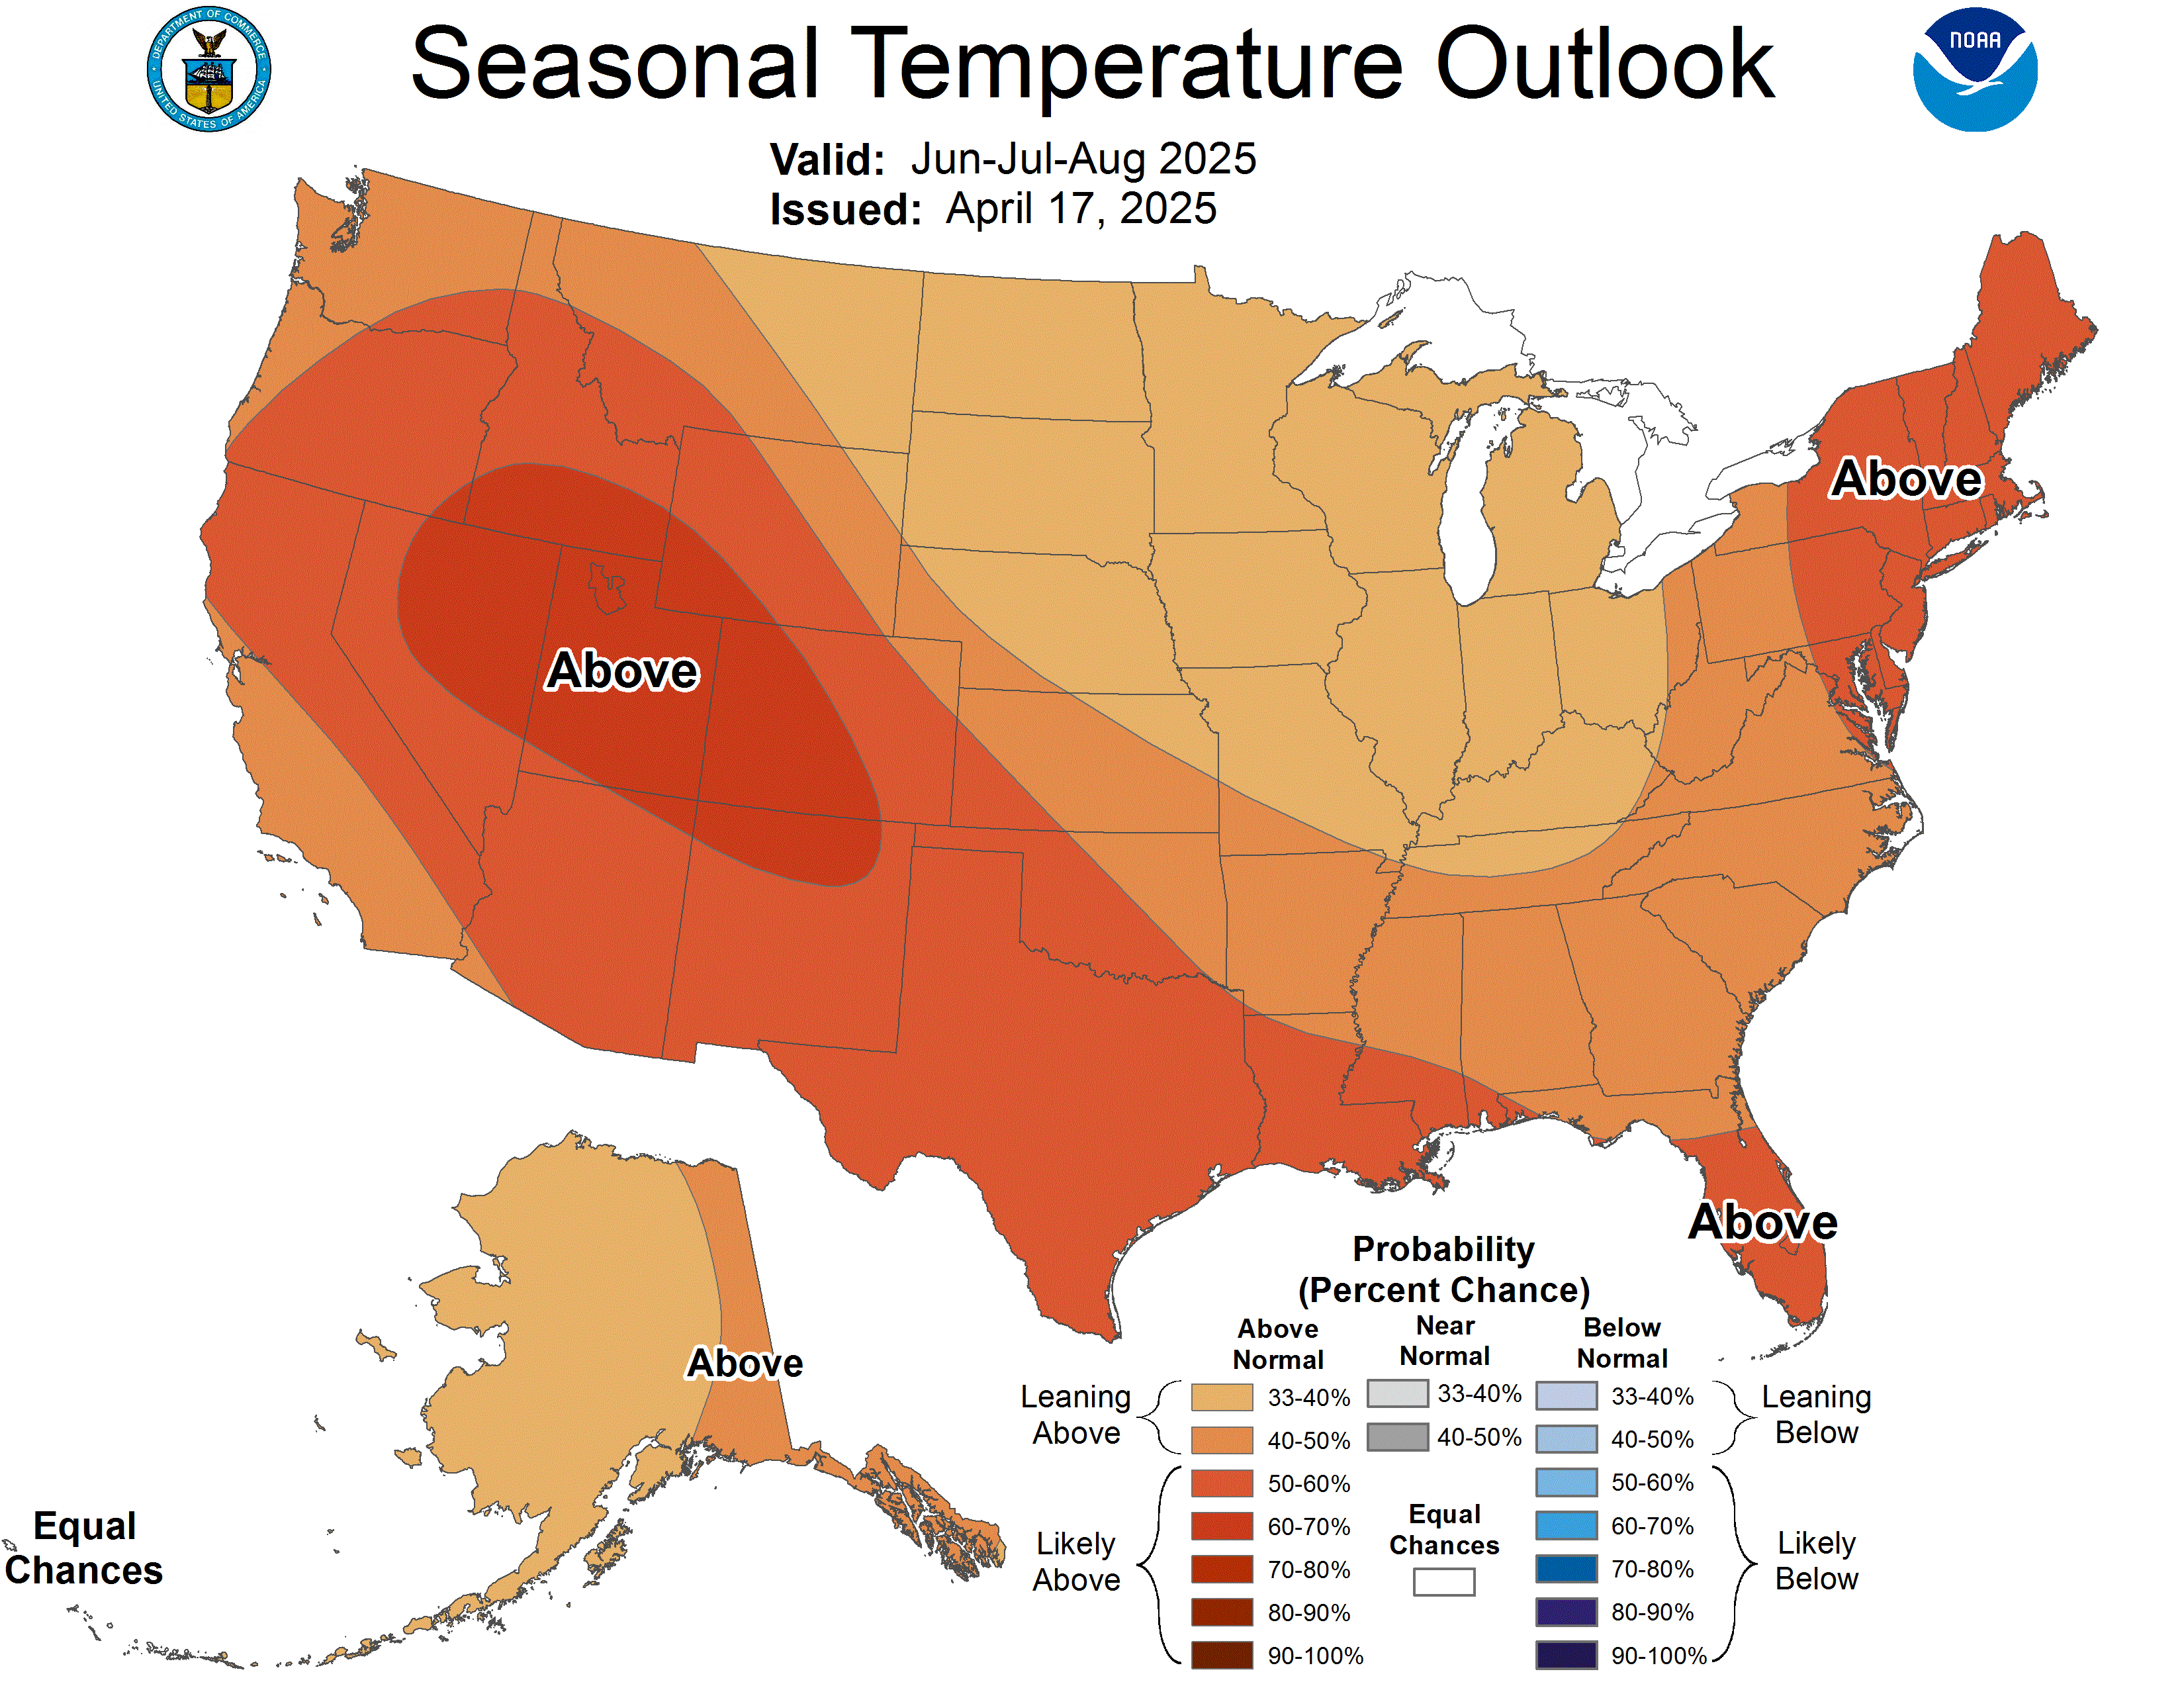
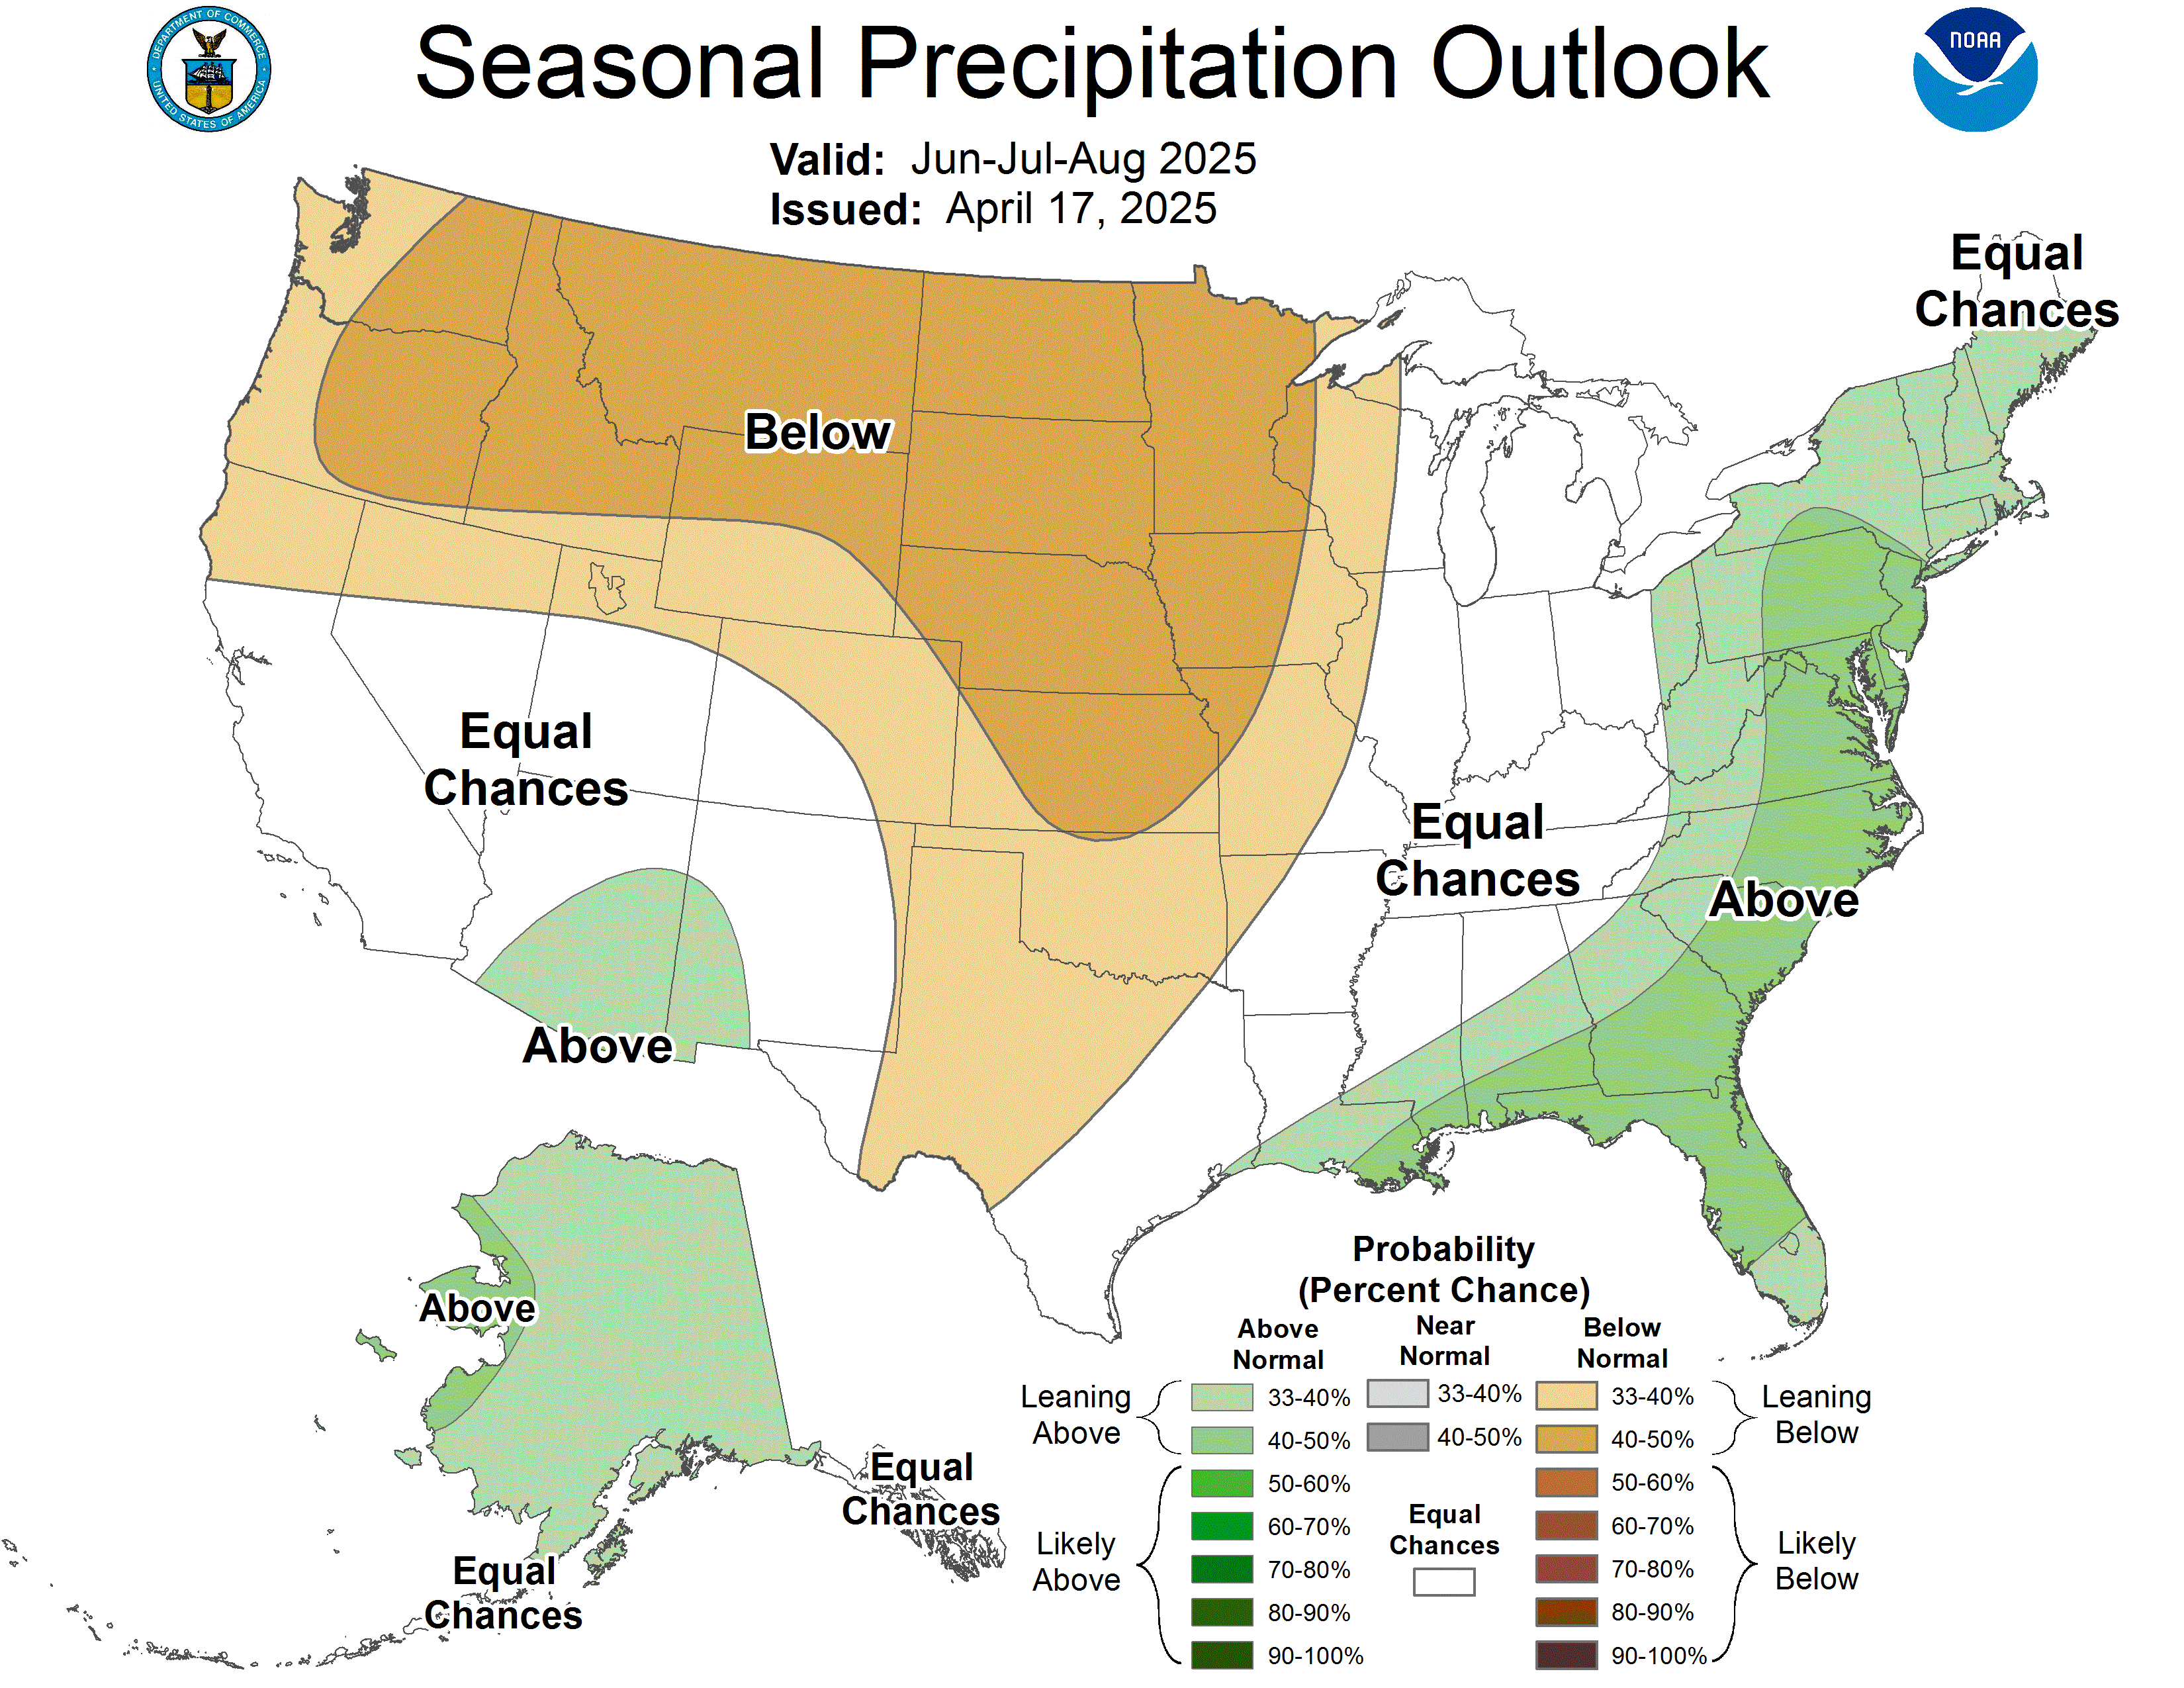
https://www.cpc.ncep.noaa.gov/products/predictions/long_range/seasonal.php?lead=2
2-17-26 El Nino, here we come-FAST!
54 responses |
Started by metmike - Feb. 17, 2026, 11:54 a.m.
https://www.marketforum.com/forum/topic/117969/
Record warm SUPER El Nino peaking this Winter:
%20Why%20This%20Winter%20Will%20Be%20The%20Most%20Impactful%20Yet!%20-%20YouTube.png)
El Nino is already strongly coupled to the atmosphere as seen below:
https://www.youtube.com/watch?v=yYk5bm5C6t4
%20Why%20This%20Winter%20Will%20Be%20The%20Most%20Impactful%20Yet!%20-%20YouTube.png) Explaining the map above:
Explaining the map above:
AI Overview
A 200mb vorticity potential map (more accurately referred to in meteorology as either a 200mb Velocity Potential map or a 200mb Potential Vorticity (PV) map) is a high-altitude weather chart used to identify where large-scale air masses are rising or sinking globally, serving as a premier tool for predicting tropical storm development and tracking climate patterns. [1, 2]The 200mb level sits near the top of the weather-producing atmosphere (the tropopause), roughly 39,000 feet (12,000 meters) above the Earth. This is where the jet stream flows and where deep tropical storms exhaust their air. [1, 2]Because "vorticity potential" usually implies Velocity Potential in tropical meteorology, or Potential Vorticity in mid-latitude storm tracking, here is how to read both maps:
1. If it is a 200mb Velocity Potential Map (Most Common)This map filters out messy wind data to show massive regions of atmospheric expansion (divergence) or squeezing (convergence). [1]
Weather forecasters use this map to track the Madden-Julian Oscillation (MJO)—a massive wave of storminess that circles the globe every 30 to 60 days.
2. If it is a 200mb Potential Vorticity (PV) MapPotential Vorticity measures the atmospheric "spin" while factoring in how stable or stretched an air column is. [1, 2]
500 mb map below which is the middle point of the atmosphere using it's weight.
This is the Nov-Dec-Jan forecast from the CFS model.
https://www.youtube.com/watch?v=yYk5bm5C6t4
%20Why%20This%20Winter%20Will%20Be%20The%20Most%20Impactful%20Yet!%20-%20YouTube.png)
Here's the J-F-M 2027 forecast from the European model. Strong agreement!
%20Why%20This%20Winter%20Will%20Be%20The%20Most%20Impactful%20Yet!%20-%20YouTube.png)
| THE 500 MB CHART |
METEOROLOGIST JEFF HABY
https://www.theweatherprediction.com/charts/500/basics/
Get all of Jeff's awesome weather tutorials here: