May 2nd, 2025 by Roy W. Spencer, Ph. D.
https://www.drroyspencer.com/2025/05/uah-v6-1-global-temperature-update-for-april-2025-0-61-deg-c/
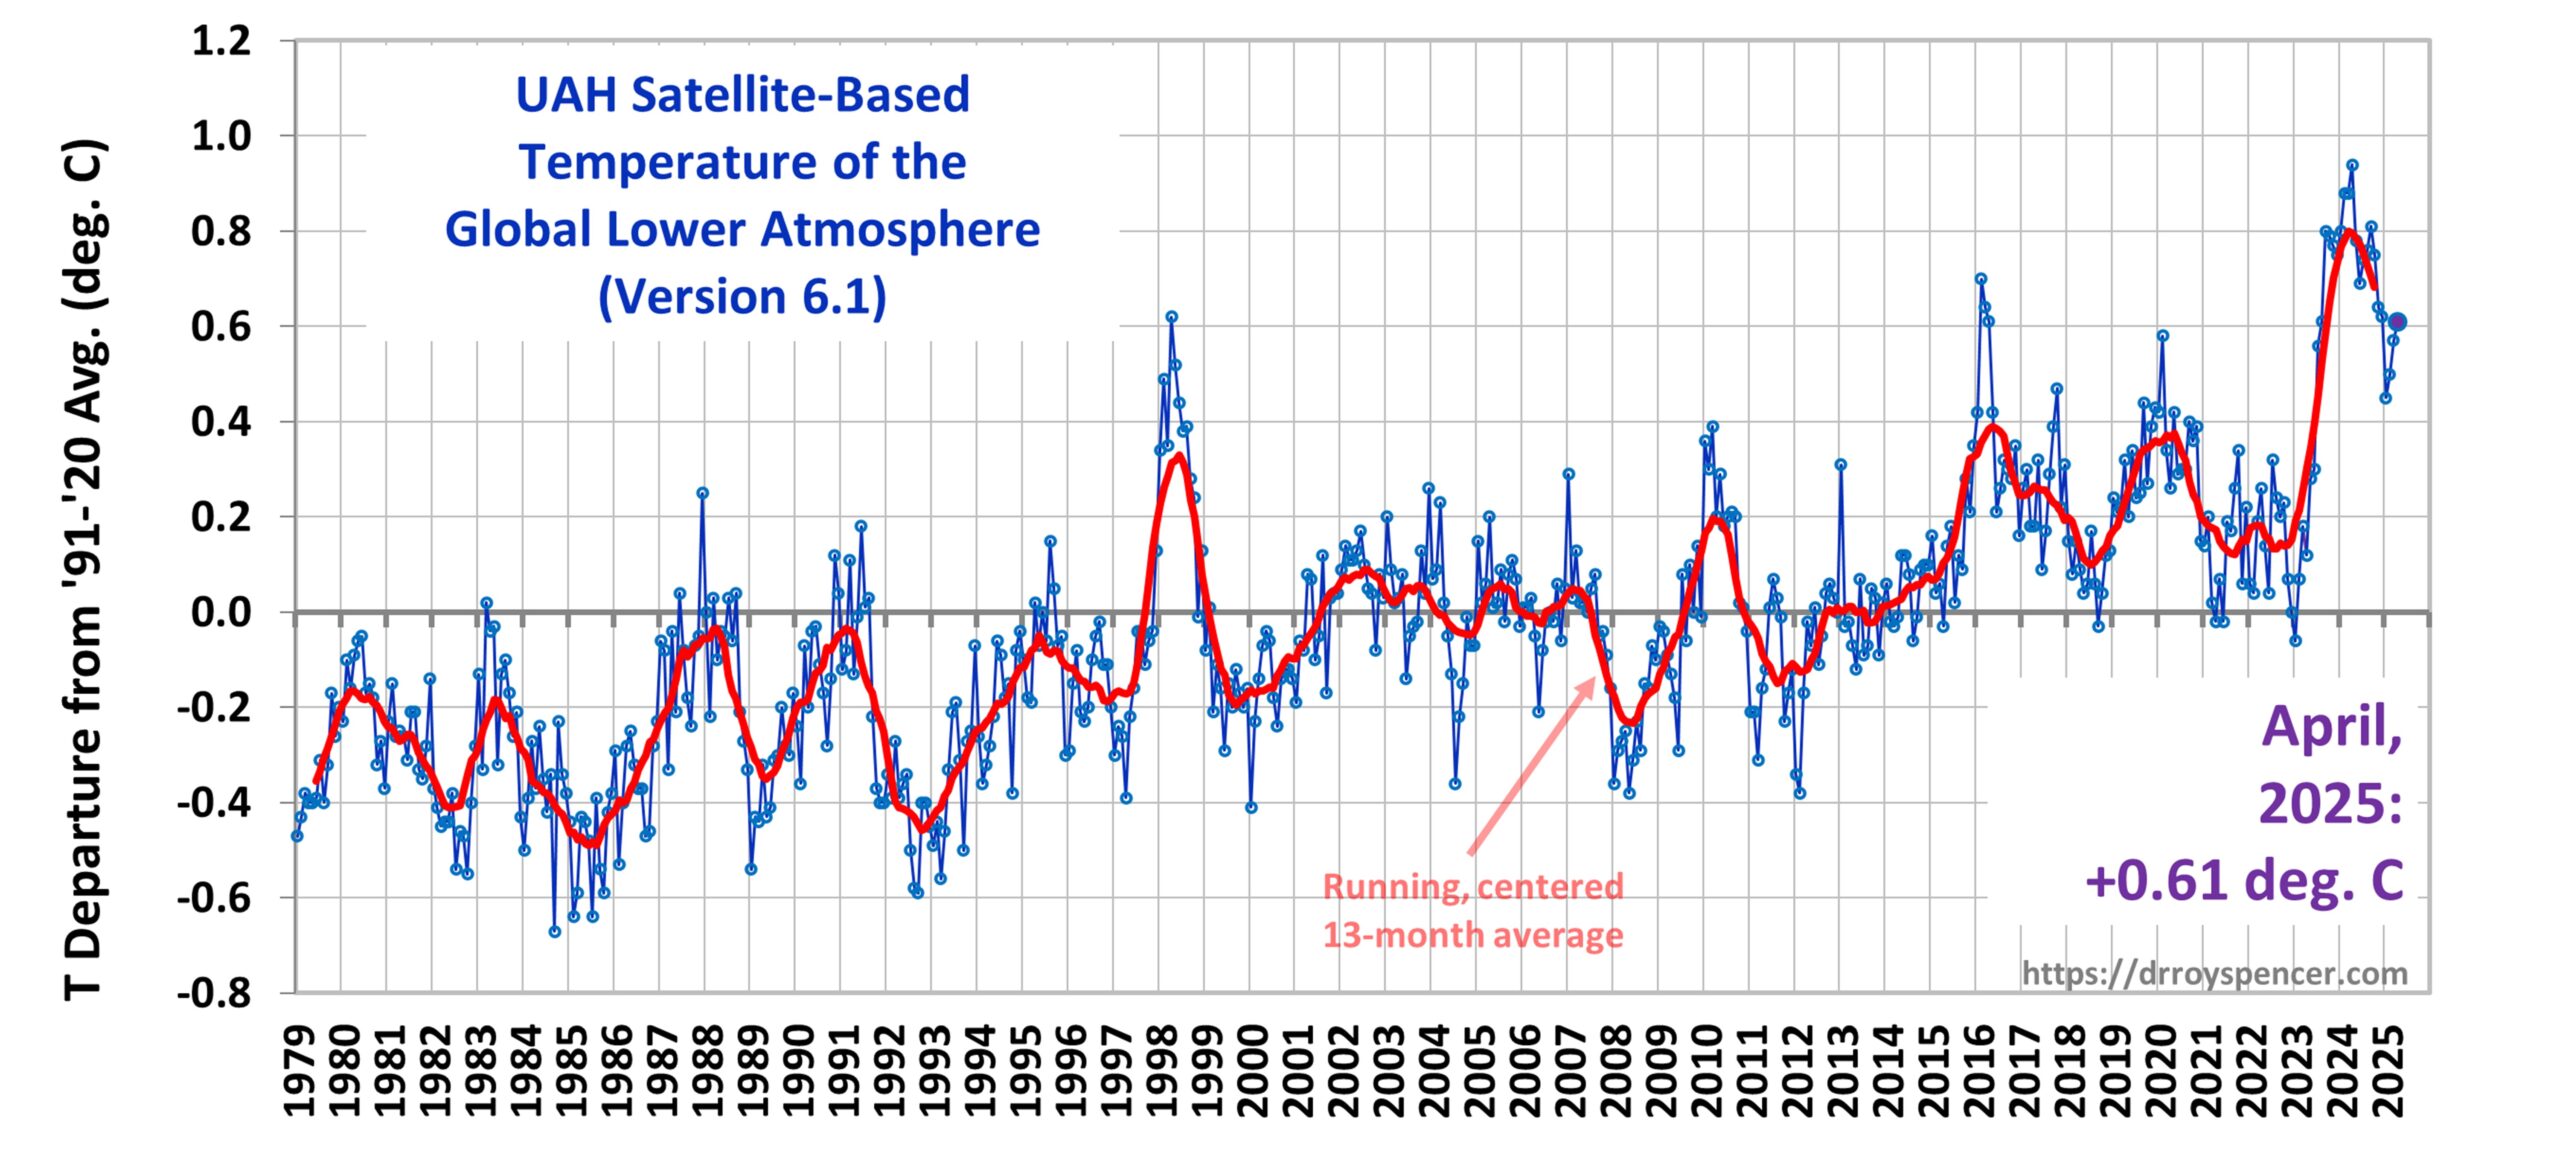
The Version 6.1 global average lower tropospheric temperature (LT) anomaly for April, 2025 was +0.61 deg. C departure from the 1991-2020 mean, up a little from the March, 2025 anomaly of +0.57 deg. C.

https://wattsupwiththat.com/2025/05/04/putting-the-alarmist-spin-on-the-earths-rotation/
+++++++++++++++++++++++++++++
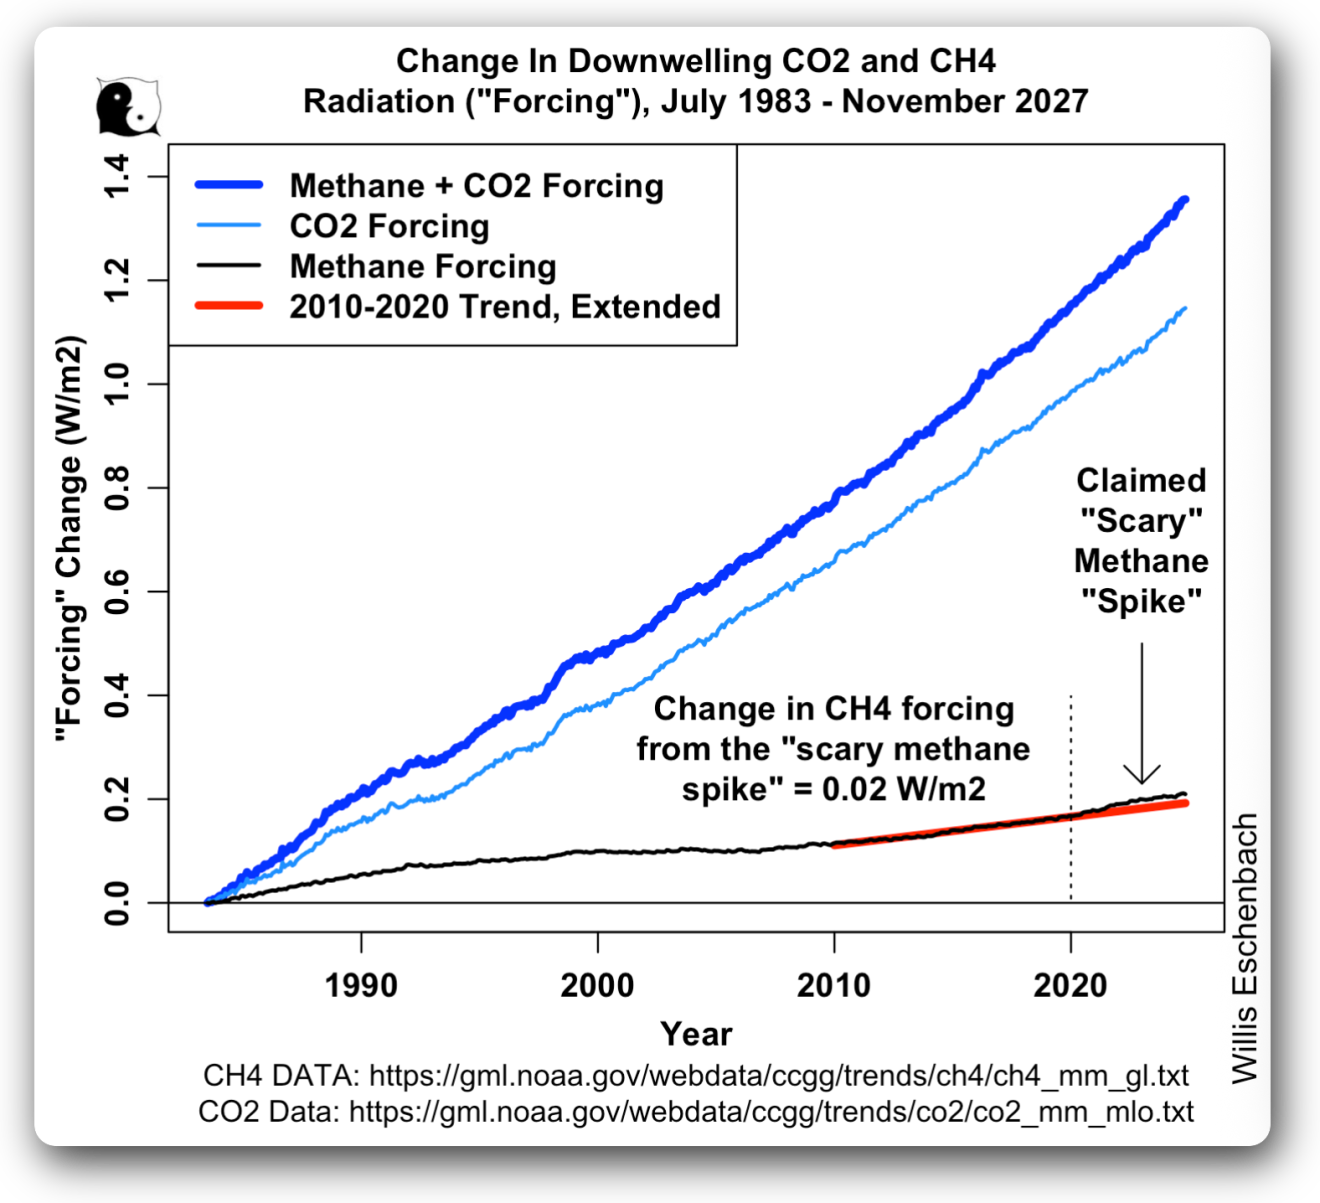
While this was not the intention of the article, which is pretty interesting, my reason to post it here is related to the graph it contains.
The graph shows us the main reason for the increase in global temperature the past 4 decades.
Contributions from increasing CO2 + contributions from CH4 = total forcing that increases the amount of long wave radiation that is absorbed, then re radiated back to the surface from the atmosphere.
https://www.climate.gov/maps-data/climate-data-primer/predicting-climate/climate-forcing
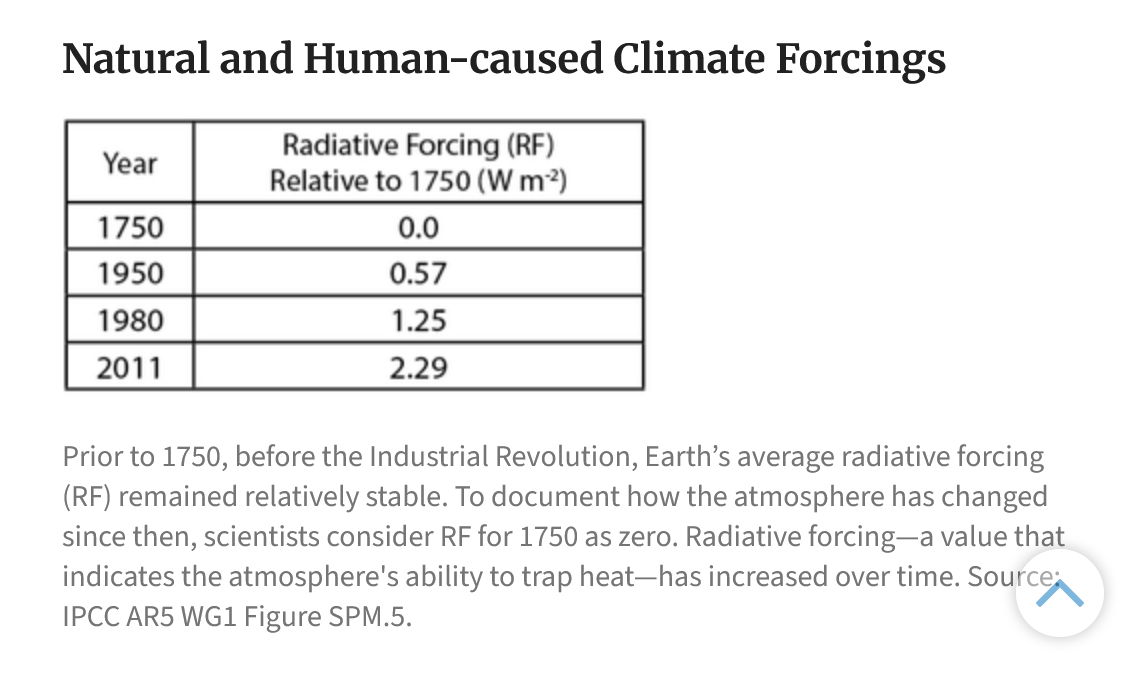
metmike: 1750 was also during The Little Ice Age!!!!! A similar climate today, along with the lower beneficial CO2 would result in shorter growing season, crop failures and crop production at less than 50% of current production. Billions of people would die FOR SURE. Not maybe but for sure because of the indisputable laws of agronomy, photosynthesis, laws of physics and laws of meteorology.
So the radiative forcing has been mostly beneficial, especially to non human life that would still prefer it to be a bit warmer than this.
++++++++++++++++++++++
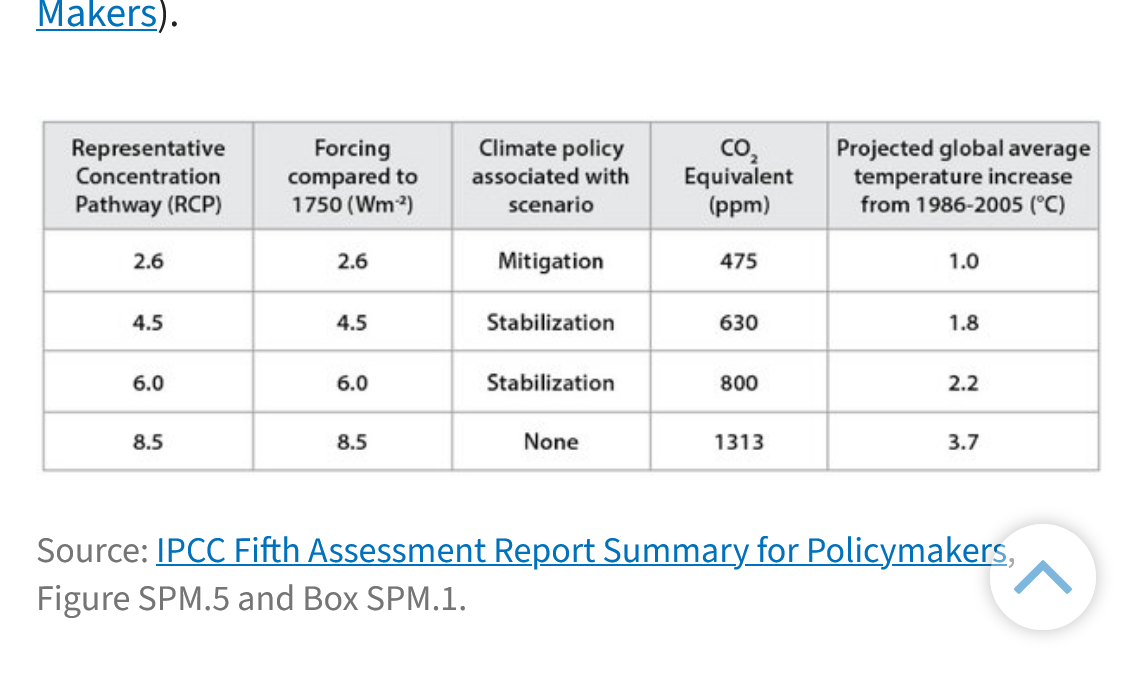
metmike: The anti science IPCC showed how fraudulent they are and how their solutions are POLITICAL not scientific when they presented the world with their projections above. Many alarmist entities jumped on the RCP 8.5 projection as if it was a reasonable possibility and use it for projecting the future if we don't curb CO2 emissions.
The 8.5 RCP pathway assumes CO2 levels of 1313. This is science FICTION not science. The current level of CO2 is just under 430 parts per million, up around 130 ppm from over 100 years ago.
A person with a lick of critical thinking, knows that an increase of 130 ppm over the past 130+ years, though accelerating a bit the last few decades will NEVER end up increasing by another 900 ppm the next 100 years.
There are several reasons for that to being impossible and for them to list something impossible in a fake science report is ludicrous.
1. The planet is massively greening up. This is gobbling up more and more of the CO2 emissions that are increasing.
2. There are not nearly enough known/discovered fossil fuels in the ground that if, completely burned would cause the atmospheric CO2 to get to anything close to 1313 ppm. Even 800 ppm is pretty absurd.
BTW, the OPTIMAL level of CO2 for most life is 900 ppm.
This site above that I'm showing is one of those using the IPCC as their source.
++++++++++++++=
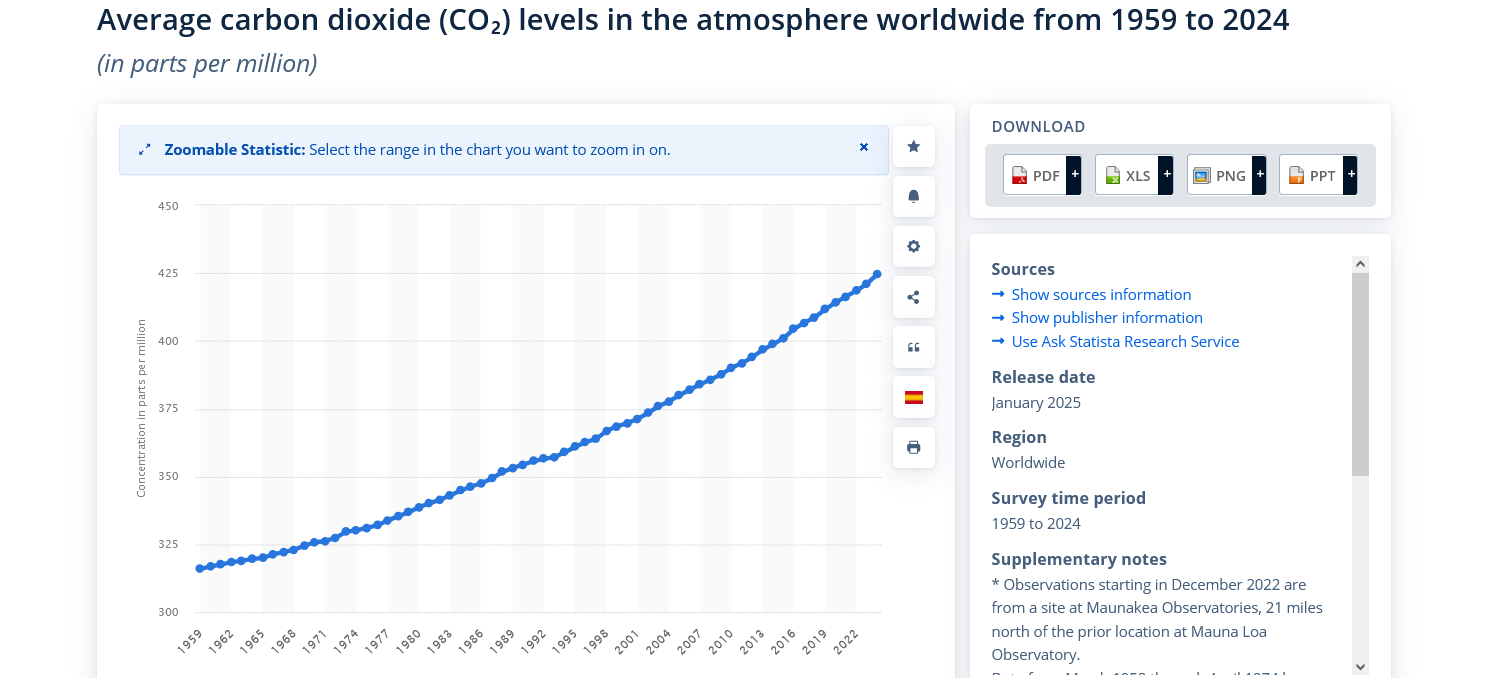
Note below, the increase in measured CO2 of just over 100 ppm in the past 65 years and the resulting graph copied.
Let's say the rate of increase DOUBLED the next 65 years. That would put us at around 628 ppm in the year 2100, which to me seems like the upper limit, especially since most of the oil supply will be used up as well as the natural gas. There will still be coal left but even that will have been replaced by nuclear and other sources.
Yet.......the IPCC wants policy makers to consider the impact of CO2 at 1313 ppm as a possibility when they make impactful decisions on energy policies.
I seriously, can't conceive of what would need to happen for CO2 levels to get that high. Again, this is proof that their work on climate is politics NOT science.
The United Nations is a wonderful organization making the world a much better place but their IPCC presents corrupt science to accomplish the agenda of transferring wealth from rich countries to poor countries.
I am on board with the objective but totally against them hijacking climate science and even rewriting climate history (to eliminate the Medieval Warm Period and Holocene Climate Optimum) to accomplish it.
This is stealing our intelligence.
https://www.statista.com/statistics/1091926/atmospheric-concentration-of-co2-historic/
+++++++++++++++++++++++++++++++++
By metmike - April 16, 2025, 4:11 p.m.
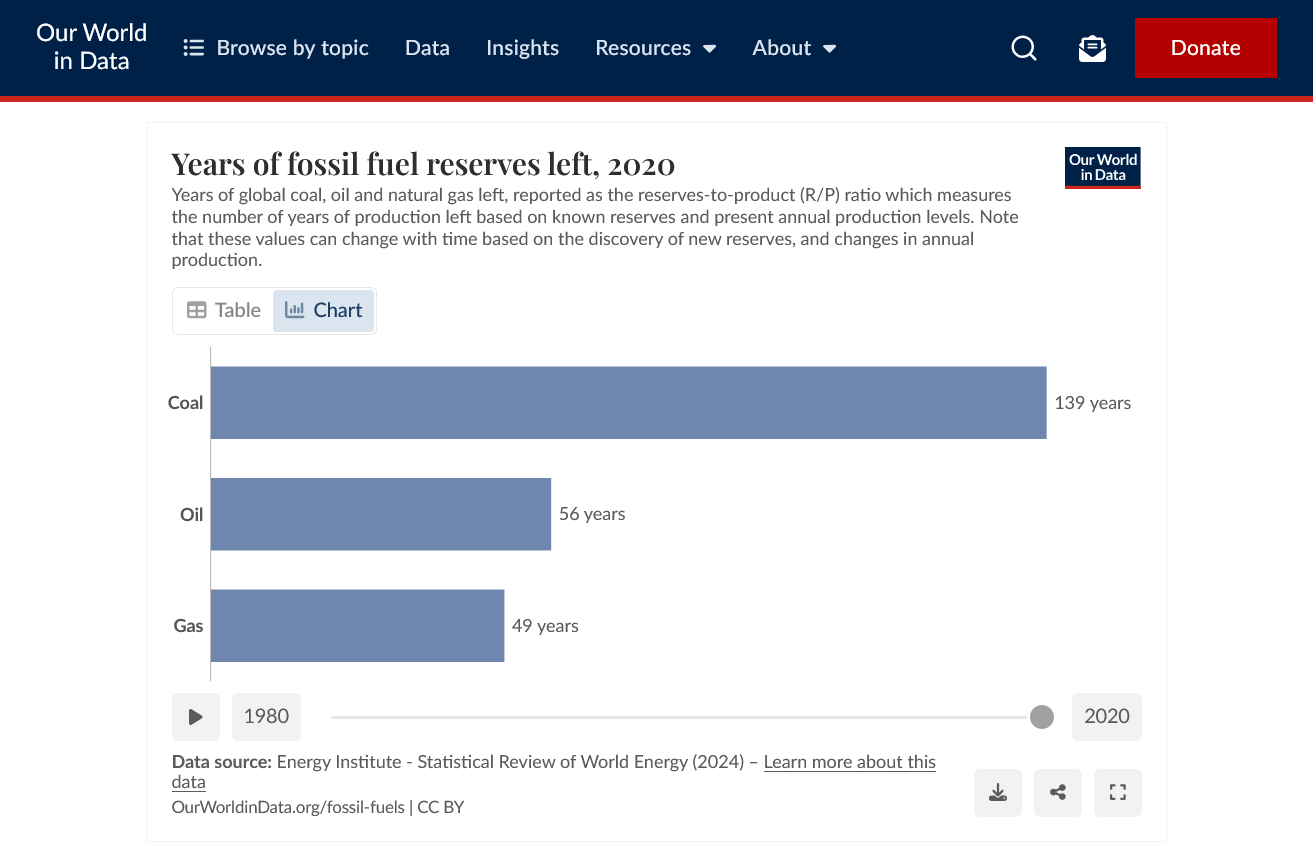
The biggest reason to use renewables is not because of the fake climate crisis!
It's because, cheap, reliable and energy dense fossil fuels will run out some day and we need to conserve them!!!
This is the global estimate below, which is likely much too conservative.
https://ourworldindata.org/grapher/years-of-fossil-fuel-reserves-left
Optimal CO2 for life more than double current level
26 responses |
Started by metmike - Dec. 15, 2020, 8:03 p.m.
https://www.marketforum.com/forum/topic/62784/
++++++++++++++++
Re: Re: Re: The Beauty of Earth
By metmike - March 3, 2025, 5:18 p.m.
https://www.marketforum.com/forum/topic/110136/#110265
+++++++++++++++++
DeathbyGREENING!
https://www.marketforum.com/forum/topic/69258/
++++++++++++++++
Energy transition is a hoax
https://www.marketforum.com/forum/topic/94557/
+++++++++++++++++++
Therealenvironmental crisis's
31 responses |
Started by metmike - April 10, 2019, 7:11 p.m.
https://www.marketforum.com/forum/topic/27498/
Re: Poisoning the minds of young people
By metmike - Aug. 14, 2023, 9:34 p.m.
++++++++++++
Science corruption (IPCC)
Started by metmike - March 20, 2023, 5:50 p.m.
There is no doubt that the warming is melting more land ice and causing thermal expansion of the oceans, leading to slightly increasing sea levels that are accelerating a bit from the 1 foot/century rise:
https://www.climate.gov/news-features/understanding-climate/climate-change-global-sea-level
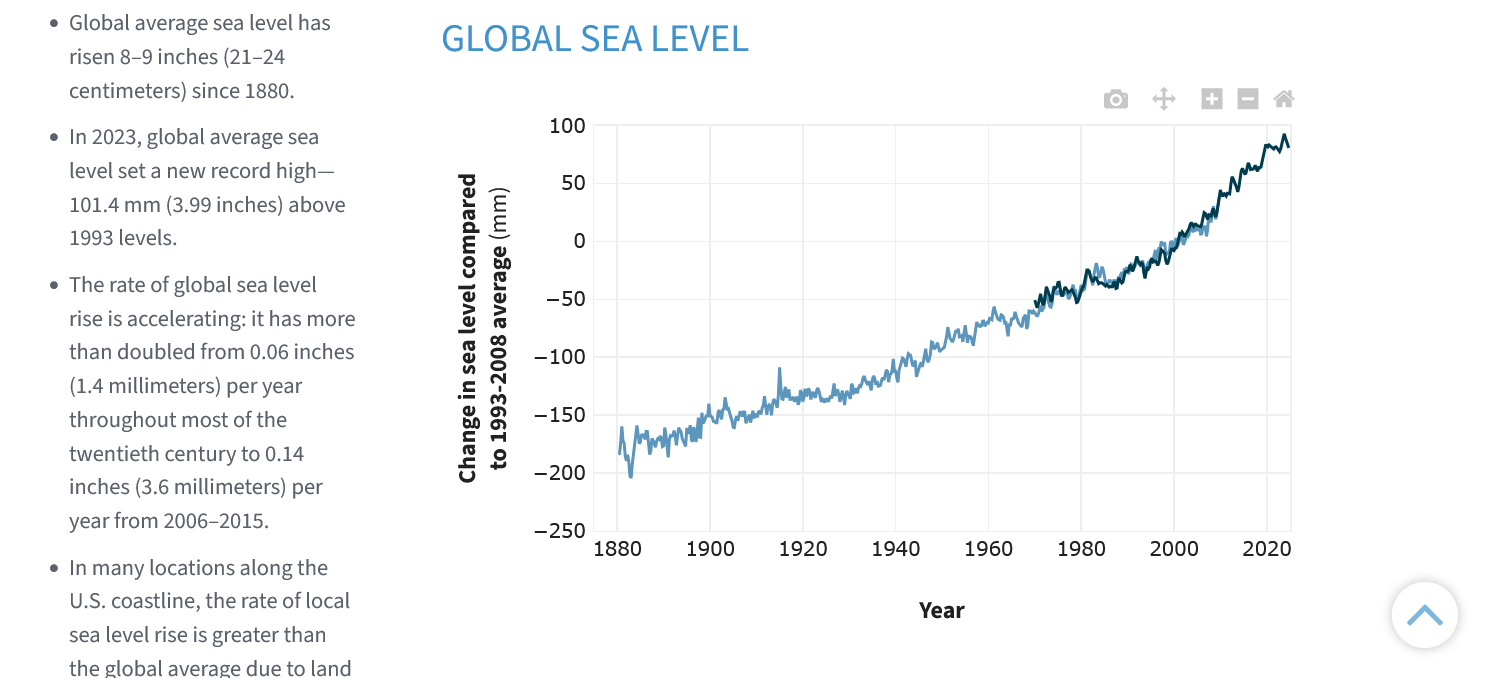
In addition, the warmer oceans WILL cause some hurricanes to be stronger as well as some heat waves to be up to 2 deg. hotter. For sure, high end flooding events are increasing because the current atmosphere, at +1 deg. C can hold around 7% more moisture. Not 700% or even 70% more moisture............7% more!
https://www.youtube.com/watch?v=i7wvtZKrTuE
Sea levels to rise by 20 feet by the end of the century..............NOT!
For the past 10,000 years, the balance of ice in Greenland had been stable.
WRONG!!!
++++++++++++++++++++
The truth below!!!
During the Holocene Climate Optimum, a period approximately 8,000 to 5,000 years ago, annual mean surface temperatures in Greenland were 2-3°C warmer than today. This warming resulted in a significant retreat of the Greenland Ice Sheet, reaching its minimum extent in the early to mid-Holocene. While the Holocene Climate Optimum is well-documented, the exact timing and extent of the warming on the Greenland Ice Sheet can vary depending on the region.
+++++++++++++++++++
The authentic science below:
https://en.wikipedia.org/wiki/Holocene_climatic_optimum
Temperatures during the HCO were higher than in the present by around 6 °C in Svalbard, near the North Pole.[10]
Of 140 sites across the western Arctic, there is clear evidence for conditions that were warmer than now at 120 sites. At 16 sites for which quantitative estimates have been obtained, local temperatures were on average 1.6±0.8 °C higher during the optimum than now. Northwestern North America reached peak warmth first, from 11,000 to 9,000 years ago, but the Laurentide Ice Sheet still chilled eastern Canada. Northeastern North America experienced peak warming 4,000 years later. Along the Arctic Coastal Plain in Alaska, there are indications of summer temperatures 2–3 °C warmer than now.[11] Research indicates that the Arctic had less sea ice than now.[12] The Greenland Ice Sheet thinned, particularly at its margins.[13] In addition to being warmer, Arctic Alaska also became wetter.
++++++++++++++++++++++=
I could spend 24 hours a day posting convincing sounding junk science and galactically sensationalized videos and busting it like this!

Junk science video:
Sea levels are inexorably rising as ice on land melts and hotter oceans expand.
Sea levels are slow to respond to global heating, so even if the temperature rise is restricted to 2C above pre-industrial levels, one in five people in the world eventually will experience their cities being submerged, from New York to London to Shanghai.
++++++++++++++++++++++++=
Fossils fuels will be LOOOOOOOONG gone before that would ever happen with oceans likely to be just a foot higher by the end of this century, possibly 2 feet higher then.
+++++++++++++++
I like Bernie Sanders health care plan a great deal. I like his humanitarian position in Gaza a great deal too.
However, on the fake climate crisis he is way out to lunch:
https://www.politico.com/story/2019/08/22/bernie-sanders-2020-climate-change-1471638
"Bernie Sanders: ‘MajorCities Going Under Water’ in ‘8 or 9 Years’ Due to Climate Change"
https://www.marketforum.com/forum/topic/46122/
+++++++++++++++
Here's the authentic science the alarmists all ignore or are ignorant about when they project these catastrophic conditions. Or those that want to go to 0 CO2 emissions schemes.
In the year 2100, whether we like it or not the world will be running out of fossil fuels.
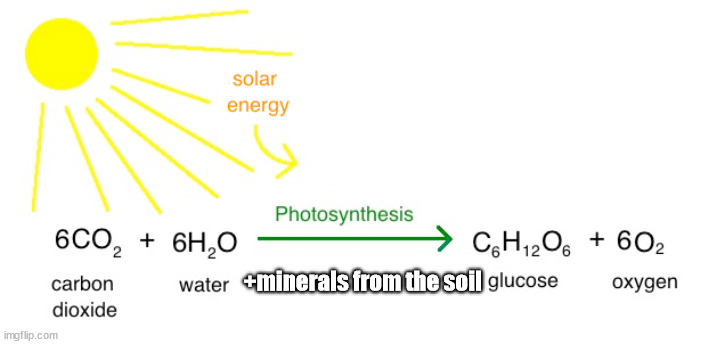
Until then, the planet will continue to massively green up from any increasing CO2. Chance of that? Near 100% because of the irrefutable law of photosynthesis. That's exactly what's happened the last 50+ years and that's exactly what will happen the next 50 years with certainty.
As the world greens up and crops get bigger from the increasing CO2 and the biosphere BOOMS our planet consumes more and more and more CO2. Our planet's climate optimum is becoming more and more DEPENDENT on that CO2 just to maintain all these wonderful green gains from the contribution of CO2 to the law of photosynthesis.
https://www.marketforum.com/forum/topic/69258/#71114
++++++++++++++++++++++
This is the massive greening the photosynthesis models predict between now and 2100 if CO2 continues to increase:
https://earthobservatory.nasa.gov/images/146296/global-green-up-slows-warming
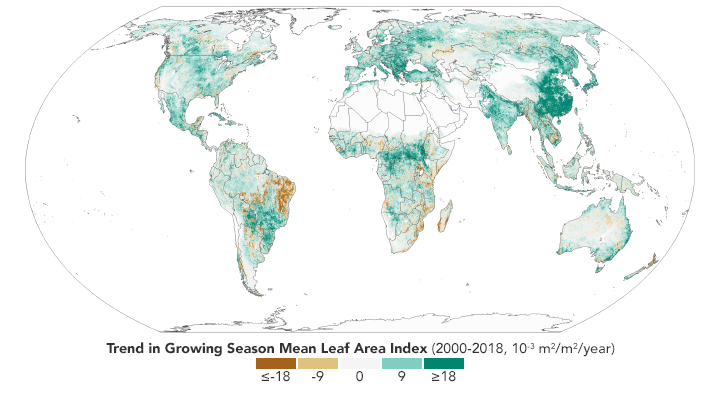
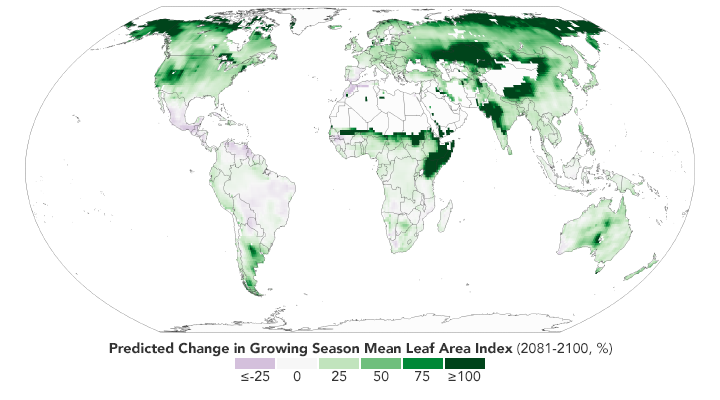
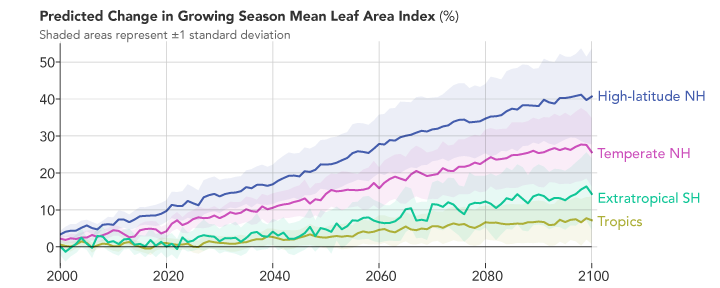
"The paper’s authors reviewed more than 250 published articles that have used satellite data, modeling, and field observations, to understand the causes and consequences of global greening. Among the key results, the authors noted that on a global scale greening can be attributed to the increase of carbon dioxide in the atmosphere. Rising levels of carbon dioxide increase the rate of photosynthesis and growth in plants."
metmike: Why isn't this paper, based on 250........let me repeat that number 250 published articles using the best technology known to science............getting much news coverage?
+++++++++++++++++=
Time for the take home point. Put on your common sense thinking cap and for a minute, forget all the junk science you've been taught about the fake climate crisis. ........which has been repeated over and over until we've had our intelligence stolen about basic physics, biology, agronomy and climate.
Let's say we don't do anything except burn fossil fuels until they are running out. As the CO2 increases, let's say up to a max of 600 ppm, which seems like an upside max and still 300 ppm less than the optimal for life?
The planets DEMAND for CO2 will continue to go up and track the rise in CO2 but lag somewhat for another couple of decades. When the rate of increase in CO2 starts to decelerate, as it will if we do nothing, that rate of increased demand by the biosphere will continue to rise and there will be an equilibrium in short order.
For a short period, the amount of CO2 emissions will exactly balance with the planets increasing need for more CO2 as it gets greener.
After that brief period, the atmospheric CO2 will drop because the plants/biosphere WILL BE gobbling up more than we put in.
That is the point when the REAL CRISIS WILL BEGIN!!!!!
Crop yields and food production will DROP because of less atmospheric fertilizer on a planet with as many as 10 billion people that have become dependent on the bin busting yields from higher CO2. The shortfall in food production will cause increasing starvation.
As the CO2 deficit increases because fossil fuels are running out, the planets CO2 level will PLUNGE because of the much greater demand for CO2 by plants on the green planet which are gobbling up more than we can put in.
The drop in CO2 will be MUCH faster than it went up. Then, the world will be searching for ways to MAINTAIN the CO2 at that level to avoid the real de-greening of planet earth, that features famine and death from widespread starvation.
That's the scenario if we let CO2 drop from gradually running out of fossil fuels.
Imagine if we follow thru with these insane 0 emissions, 0 carbon by 2035 or even 2050 schemes.
If the planet is dependent on XXX parts per million of CO2 it needs for photosynthesis, what do you think will happen if we feed it XXX-XX parts per million every year????
They pretend that the optimal level was over 100 years ago when it was closer to 300 ppm and burning fossil fuels caused it to get to the current 428 ppm and rising.
If we went into a climate time machine and dialed down the CO2 back to 300 ppm, and cooled the planet 2 deg. F like the conditions of the climate 100+ years ago, this planet could only sustain less than 6 billion people.
If we ever get to 600 ppm and it drops back down to the current 428 ppm, it will result in the worst widespread global famines since the 1800's. Back with that climate they want us to think was the good old climate days.
See the truth about the good old climate days of the 1800's on the next page!

These were the good old climate days with much lower CO2 and a global temperature around 2 deg. F colder than now:
Copied from this page below:
Re: Re: Re: Re: Re: Death by GREENING!
By metmike - Feb. 2, 2025, 7:54 a.m.
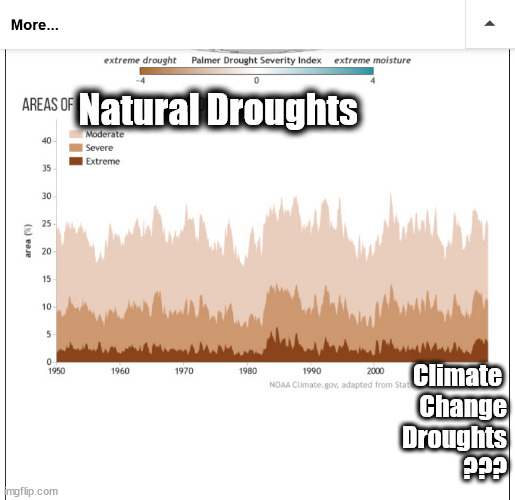
Here's a perfect example of why they get it so wrong using the global drought graph from above. Please tell me where on this graph below, that the climate change droughts are and where the natural droughts are since the year 2000? Impossible because the pattern is THE EXACT SAME! The MSM, in 2025 tells us that EVERY drought is now caused by climate change to the point that they use the terms interchangeably.
https://www.climate.gov/news-features/featured-images/2017-state-climate-global-drought
+++++++++++++++++++++++
Global cooling and LOW CO2 levels are what cause widespread, extremely long lasting droughts with catastrophic global and huge regional famines!
Here in 2025, we are living in a climate optimum with absolute, scientific certainty!!
The 1800's featured 3 different Dust Bowls because of the low CO2 and global cooling.
Causes and consequences of nineteenth century droughts in North America
https://ocp.ldeo.columbia.edu/res/div/ocp/drought/nineteenth.shtml
++++++++++++++++++++++++++++++++++++++++++++
You want a REAL climate CRISIS?
This is what it looks like:
Can you imagine if this below happened today? It's less likely because climate change and the current climate OPTIMUM is helping to PROTECT US!
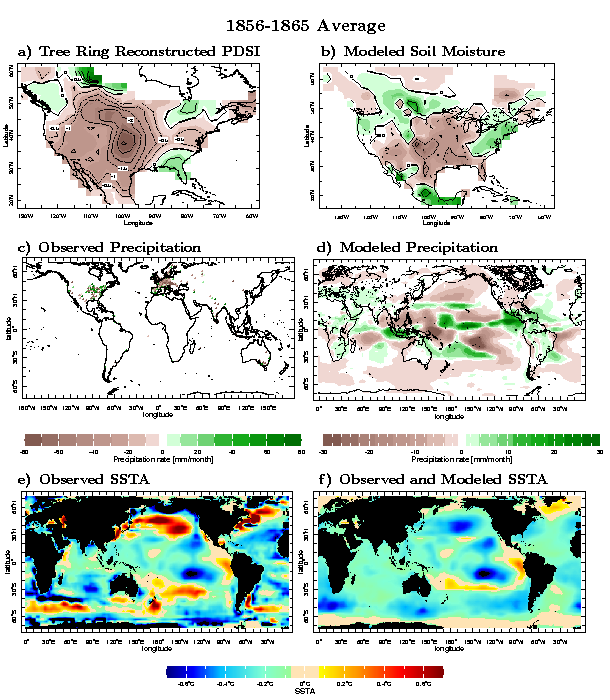
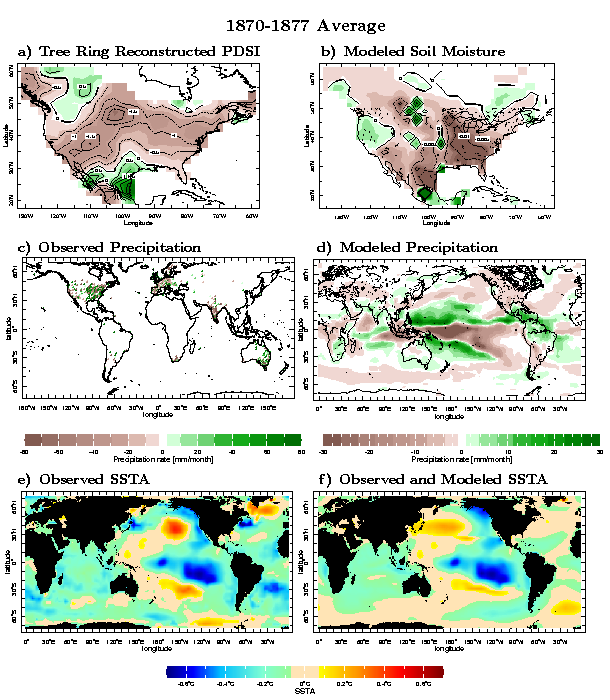
The planet had a REAL climate crisis between 1876 and 1878.
50 million people died. 3% of the global population died from that real climate crisis!
https://news.climate.columbia.edu/2017/12/15/causes-great-famine-drought/

https://ui.adsabs.harvard.edu/abs/2017AGUFMGC51F..04S/abstract
The 1876-1878 Great Famine impacted multiple regions across the globe including parts of Asia, Nordeste Brazil, and northern and southern Africa, with total human fatalities exceeding 50 million people, arguably the worst environmental disaster to befall humanity.
NASA EXPLAINS THE DUST BOWL DROUGHT
https://www.nasa.gov/centers/goddard/news/topstory/2004/0319dustbowl.html
++++++++++++++++++
Climate change in the United States, with 100% certainty is helping to protect us from widespread severe droughts.
Summer Climate Change in the Midwest and Great Plains due to Agricultural Development during the Twentieth Century
https://journals.ametsoc.org/view/journals/clim/32/17/jcli-d-19-0096.1.xml

++++++++++++++++++++++++++++++++++++++++++++++++++++

We are indisputably living in a climate optimum for most life on this planet(that would still prefer a bit more warmth and a lot more CO2) and for growing crops in the United States!
Just to repeat:
metmike is a PRACTICING, authentic environmentalist!
So what does that mean, anyway?
1. Don't buy new stuff that you don't need, especially when your old stuff still works fine.
2. Conserve natural resources. That means don't waste water, energy, electricity......many other items. Dial the thermostat way down in Winter and wear a thick sweater. Dial it up in the Summer to something still comfortable and get used to it. Save lots of money at the same time!
3. Don't pollute! Real pollution as defined below
4. Don't liter.
5. Do the opposite of rich people like Al Gore, John Kerry that fly around in private jets and live in energy guzzling mansions, telling us what we should do. Live frugally? That would be nice but you can till enjoy life to the fullest, just don't waste things.
6. Minimize use of disposable paper and especially plastic products as well as other items that can't be reused multiple times.
Therealenvironmental crisis's
31 responses |
Started by metmike - April 10, 2019, 7:11 p.m.
https://www.marketforum.com/forum/topic/27498/
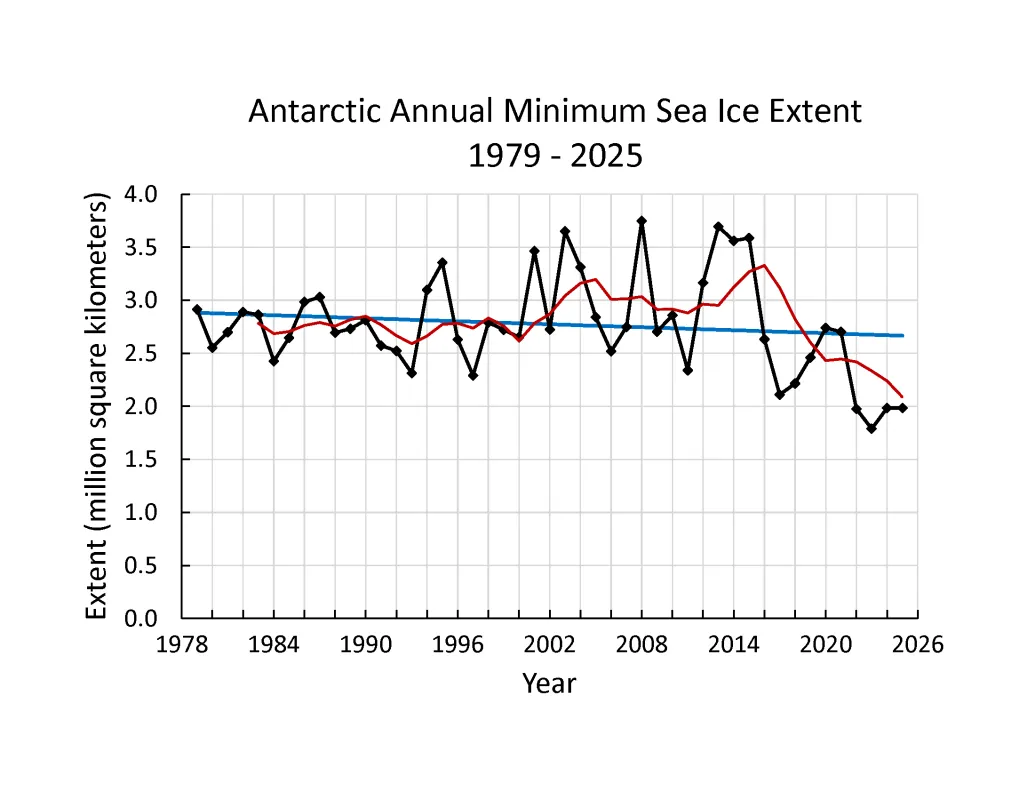
The changes in the Antarctic ice have been very unstable in recent decades. For instance, while Arctic ice was setting record lows in the 90's, 00s, Antarctic ice was setting record highs unexpectedly. Mainly from additional precip/snow piling up on top the ice faster than it was melting along the edges.
Category: Antarctic
https://wattsupwiththat.com/category/antarctic/
THURSDAY, MARCH 6, 2025
https://nsidc.org/sea-ice-today/analyses/antarctic-sea-ice-minimum-hits-near-record-low-again
+++++++++++++++++++++
https://wattsupwiththat.com/2025/05/03/antarcticas-ice-sheet-stages-a-remarkable-comeback/
+++++++++++++++=
My opinion is that regardless of how much ice is melting or not its MUCH less than what was supposed to melt the past 3 decades.
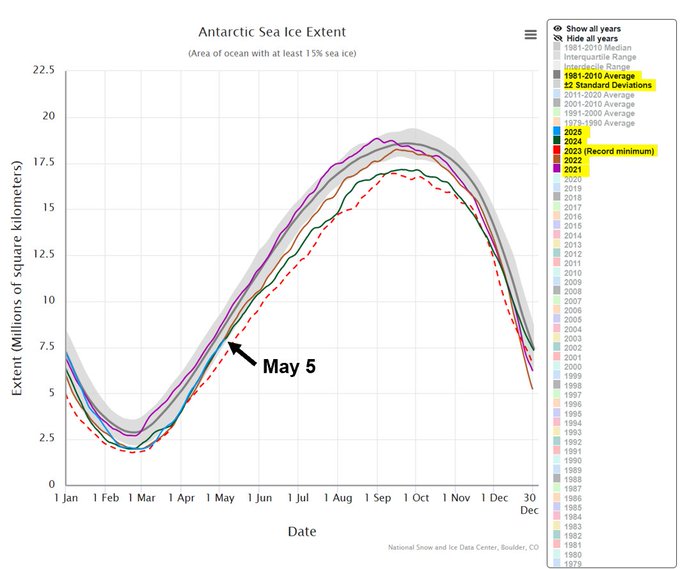
Seeing Antarctic sea ice gains in the news. I used to post about this a lot but haven't in a while. Overall, Antarctic sea ice (for the date) is:6th lowest in 30+ yearsBelow long-term averageVery similar to 2024 & 2022Well below 2021Above 2023 (record low)
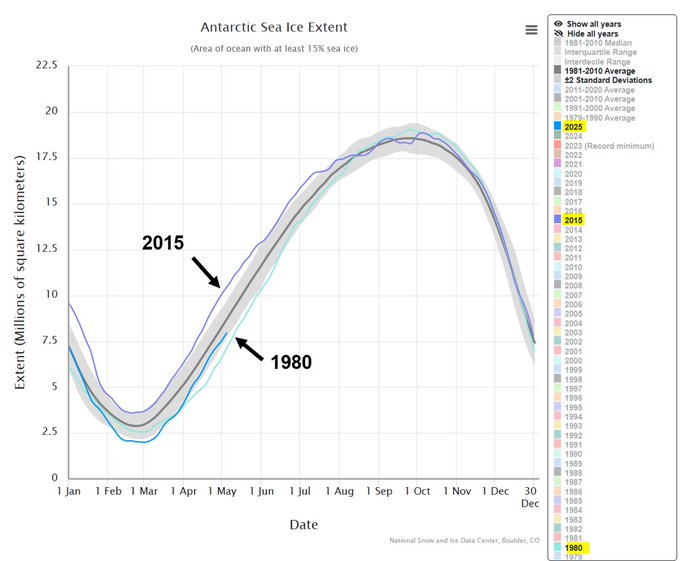
Record gains were seen in certain parts of the Antarctic ice sheet between 2021 & 2023. These areas are relatively unstable and the gains could be short lived. Doesn't really change the longer term trend, at least for now. However, point of interest: 2025 vs 2015 vs 1980
https://climate.nasa.gov/vital-signs/arctic-sea-ice/?intent=121
Analyses and daily images of sea ice conditions
https://nsidc.org/sea-ice-today
++++++++++++++++++
The amount of ice melt in the Arctic has also been much less than expected and predicted the past decade.
32 climate crisis predictions that failed badly
https://www.youtube.com/watch?v=E1e5HAZo4iw
By metmike - March 20, 2023, 11:36 p.m.
By Scott Waldman | 01/04/2017 08:03 AM EST
https://www.eenews.net/articles/judith-curry-retires-citing-craziness-of-climate-science/
++++++++++++++++++++++
By baker - April 10, 2025, 10:59 p.m.
warming!
https://www.youtube.com/watch?v=yP6oUascDnQ