KEY EVENTS TO WATCH FOR:
Wednesday, August 9, 2023
7:00 AM ET. MBA Weekly Mortgage Applications Survey
Composite Idx (previous 200.7)
Composite Idx, W/W% (previous -3.0%)
Purchase Idx-SA (previous 154.1)
Purchase Idx-SA, W/W% (previous -3.2%)
Refinance Idx (previous 433.6)
Refinance Idx, W/W% (previous -2.5%)
10:00 AM ET. July Online Help Wanted Index
10:00 AM ET. SEC Closed Meeting
10:30 AM ET. EIA Weekly Petroleum Status Report
Crude Oil Stocks (Bbl) (previous 439.771M)
Crude Oil Stocks, Net Chg (Bbl) (previous -17.049M)
Gasoline Stocks (Bbl) (previous 219.081M)
Gasoline Stocks, Net Chg (Bbl) (previous +1.481M)
Distillate Stocks (Bbl) (previous 117.153M)
Distillate Stocks, Net Chg (Bbl) (previous -0.796M)
Refinery Usage (previous 92.7%)
Total Prod Supplied (Bbl/day) (previous 20.023M)
Total Prod Supplied, Net Chg (Bbl/day) (previous -1.253M)
The STOCK INDEXES? http://quotes.ino.com/ex?changes/?c=indexes
The STOCK INDEXES: The September NASDAQ 100 was steady to slightly higher overnight and sets the stage a slightly higher opening when the day session begins trading. Stochastics and the RSI are oversold but are turning neutral to bullish signaling that sideways to higher prices are possible near-term. Closes above the 20-day moving average crossing at 15,637.67 would temper the near-term bearish outlook. If September extends the aforementioned decline, the 50-day moving average crossing at 15,257.25 is the next downside target. First resistance is the July 19th high crossing at 16,062.75. Second resistance is the December-2021 high on the weekly continuation chart crossing at 16,659.50. First support is the 50-day moving average crossing at 15,274.04. Second support is the June 26th low crossing at 14,853.50.
The September S&P 500 was higher overnight as it consolidates some of the decline off July's high. Overnight trading sets the stage for a higher opening when the day session begins trading. Stochastics and the RSI are oversold but are turning neutral to bullish signaling that sideways to higher prices are possible near-term. Closes above the 20-day moving average crossing at 4562.66 would temper the near-term bearish outlook. If September extends the decline off July's high, the 50-day moving average crossing at 4464.53 is the next downside target. First resistance is July's high crossing at 4634.50. Second resistance is the March-2022 high crossing at 4714.75. First support is the 50-day moving average crossing at 4464.53. Second support is July's low crossing at 4411.25.
INTEREST RATES http://quotes.ino.com/ex changes/?c=interest"
INTEREST RATES: September T-bonds were lower overnight as they consolidate some of the rally off last-Friday's rally. Overnight trading sets the stage for a lower opening when the day session begins trading. Stochastics and the RSI are neutral to bullish signaling that sideways to higher prices are possible near-term. Closes above the 20-day moving average crossing at 124-18 would signal that a low has been posted. If September renews the decline off July's high, the October-2022 low on the weekly continuation chart crossing at 117-19 is the next downside target.First resistance is the 20-day moving average crossing at 124-18. Second resistance is the 50-day moving average crossing at 125-31. First support is last-Friday's low crossing at 119-25. Second support isthe October-2022 low on the weekly continuation chart crossing at 117-19 is the next downside target.
September T-notes were lower overnight and sets the stage for a lower opening when the day session begins trading. Stochastics and the RSI are neutral to bullish signaling that sideways to higher prices are possible near-term. Closes above the 20-day moving average crossing at 111.239 would signal that a short-term low has been posted. If September renews the decline off July's high, the October-2022 low crossing at 108.265 is the next downside target. First resistance is the 20-day moving average crossing at 111.239. Second resistance is the 50-day moving average crossing at 112.133. First support is last-Friday's low crossing at 109.240. Second support is the October-2022 low on the weekly continuation chart crossing at 108.265.
ENERGY MARKETS? http://quotes.ino.com/ex?changes/?c=energy ""
ENERGIES:Septembercrude oil was higher in late-overnight trading and sets the stage for a higher opening when the day session begins trading. Stochastics and the RSI are overbought but remain neutral to bullish signaling that sideways to higher prices are possible near-term. If September extends the rally off the June 28th low, the 62% retracement level of the 2022-2023 decline crossing at $84.20 is the next upside target. Closes below the 20-day moving average crossing at $79.15 would signal that a short-term top has been posted. First resistance is the overnight high crossing at $83.91. Second resistance is the 62% retracement level of the 2022-2023 decline crossing at $84.20. First support is the 20-day moving average crossing at 79.15. Second support is the 50-day moving average crossing at $74.19.
September heating oil was higher overnight as it extends the rally off May's low. Overnight trading sets the stage for a higher opening when the day session begins trading. Stochastics and the RSI are overbought but remain neutral to bullish signaling that sideways to higher prices are possible near-term. If September extends the rally off May's low, the 87% retracement level of the 2022-2023 decline crossing at 3.1313 is the next upside target. Closes below the 20-day moving average crossing at 2.8488 would signal that a short-term top has been posted. First resistance is the 87% retracement level of the 2022-2023 decline crossing at 3.1313. Second resistance is the June-2022 high crossing at 3.2700. First support is Tuesday's low crossing at 2.9374. Second support is the 20-day moving average crossing at 2.8488.
September unleaded gas was higher overnight and sets the stage for a higher opening when the day session begins trading. Stochastics and the RSI are turning neutral to bullish signaling that sideways to higher prices are possible near-term. If September renews the rally off the June 23rd low, the October-2022 high on the weekly continuation chart crossing at 3.0221 is the next upside target. Closes below last-Thursday's low crossing at 2.7131 would confirm that a short-term top has been posted while opening the door for additional weakness near-term. First resistance is July's high crossing at $2.9257. Second resistance is the October-2022 high on the weekly continuation chart crossing at $3.0221. First support is last-Thursday's low crossing at $2.7131. Second support is the 50-day moving average crossing at $2.5603.
September natural gas was slightly higher overnight as it extends the rally off last-Wednesday's low. Overnight trading sets the stage for a slightly higher opening when the day session begins trading. Stochastics and the RSI are overbought but remain bullish signaling that sideways to higher prices are possible near-term. If September extends the rally off last-Wednesday's low, June's high crossing at 2.911 is the next upside target. Closes below last-Wednesday's low crossing at 2.457 would open the door for a possible test of the June 1st low crossing at 2.249. Closes below June's low crossing at 2.249 or above June's high crossing at 2.911 are needed to mark a breakout of this extended trading range and point the direction of the next trending move. First resistance is the June 26th high crossing at 2.911. Second resistance is the 25% retracement level of the 2022-2023 decline crossing at 3.193. First support is last-Wednesday's low crossing at 2.457. Second support is the June 1st low crossing at 2.249.
CURRENCIEShttp://quotes.ino.com/ex changes/?c=currencies"
CURRENCIES:The September Dollar was lower overnight and sets the stage for a lower opening when the day session begins trading later this morning. Stochastics and the RSI are overbought but remain neutral to bullish signaling that sideways to higher prices are possible near-term. If September extends the rally off July's low, July's high crossing at $103.275 is the next upside target. Closes below last-Friday's low crossing at $101.550 would signal that a short-term top has been posted. First resistance is July's high crossing at $103.275. Second resistance is May's high crossing at $104.205. First support is last-Friday's low crossing at $101.550. Second support is the 20-day moving average crossing at $101.105.
The September Euro was higher overnight and sets the stage for a higher opening when the day session begins trading. Stochastics and the RSI are oversold but remain neutral to bearish signaling that sideways to lower prices are possible near-term. If September renews the decline off July's high, July's low crossing at 1.08715 is the next downside target. Closes above the 20-day moving average crossing at $1.10987 would signal that a short-term low has been posted. First resistance is the 20-day moving average crossing at $1.10987. Second resistance is the July 27th high crossing at $1.11770. First support is July's low crossing at 1.08715. Second support is May's low crossing at 1.07025.
The September British Pound was lower overnight. Overnight trading sets the stage for a lower opening when the day session begins trading. Stochastics and the RSI are neutral to bullish signaling that sideways to higher prices near-term. Closes above the 20-day moving average crossing at 1.2873 would confirm that a short-term top has been posted. If September renews the decline off July's high, the 50% retracement level of the March-July rally crossing at 1.2508 is the next downside target. First resistance the 20-day moving average crossing at 1.2873. Second resistance is the July 27th high crossing at 1.2999. First support is the 38% retracement level of the March-July rally crossing at 1.2658. Second support is the 50% retracement level of the March-July rally crossing at 1.2508.
The September Swiss Franc was lower overnight and sets the stage for a lower opening when the day session begins trading. Stochastics and the RSI are oversold but remain neutral to bearish signaling that sideways to lower prices are possible near-term. If September extends the decline off July's high, the 50-day moving average crossing at 1.13817 is the next downside target. Closes above the 20-day moving average crossing at 1.15857 would signal that a short-term low has been posted. First resistance is the 20-day moving average crossing at 1.15857. Second resistance is the July 18th high crossing at 1.17650. First support is the 50-day moving average crossing at 1.13817. Second support is the June 30th low crossing at 1.11790.
The September Canadian Dollar was slightly lower overnight as it extended the decline off July's high. Overnight trading sets the stage for a slightly lower opening when the day session begins trading. Stochastics and the RSI are oversold but remain neutral to bearish signaling that sideways to lower prices are possible near-term. If September extends the decline off July's high, the 62% retracement level of the March-July rally crossing at $74.01 is the next downside target. Closes above the 20-day moving average crossing at $75.53 would signal that a short-term low has been posted. First resistance is the 10-day moving average crossing at $75.10. Second resistance is the 50-day moving average crossing at $75.40. First support is the 50% retracement level of the March-July rally crossing at $74.48. Second support is the 62% retracement level of the March-July rally crossing at crossing at $74.01.
The September Japanese Yen was steady to slightly lower overnight. Overnight trading sets the stage for a slightly lower opening when the day session begins trading. Stochastics and the RSI are oversold but remain neutral to bearish signaling that sideways to lower prices are possible near-term. If September renews the decline off the July 14th high, June's low crossing at 0.069755 is the next downside target. Closes above the 50-day moving average crossing at 0.071603 would signal that a short-term low has been posted. First resistance is the July 28th high crossing at 0.07315. Second resistance is the July 14th high crossing at 0.073585. First support is last-Thursday's low crossing at 0.069970. Second support is June's low crossing at 0.069755.
PRECIOUS METALS http://quotes.ino.com/ex changes/?c=metals"
Precious Metals: October gold was slightly lower overnight and sets the stage for a lower opening when the day session begins trading later this morning. Stochastics and the RSI are oversold but remain neutral to bearish signaling that sideways to lower prices are possible near-term. If October extends the decline off July's high, June's low crossing at $1919.60 is the next downside target. Closes above last-Monday's high crossing at $1991.00 would temper the near-term bearish outlook. First resistance is the July 20th high crossing at $2008.50. Second resistance is the 50% retracement level of the May-June decline crossing at $2015.80. First support is the July 6th low crossing at $1927.60. Second support is June's low crossing at $1919.60.
September silver was lower overnight and sets the stage for a lower opening when the day session begins trading later this morning. Stochastics and the RSI are oversold but remain neutral to bearish signaling that sideways to lower prices are possible near-term. If September extends the decline off July's high, June's low crossing at $22.340 is the next downside target. Closes above the 20-day moving average crossing at $24.411 would signal that a short-term low has been posted. First resistance is the 50-day moving average crossing at $23.917. Second resistance is the 20-day moving average crossing at $24.411. First support is July's low crossing at $22.720. Second support is June's low crossing at $22.340.
September copper was higher overnight as it consolidates some of the decline off this month's high. Overnight trading sets the stage for a higher opening when the day session begins trading. Stochastics and the RSI are oversold but remain neutral to bearish signaling that sideways to lower prices are possible near-term. If September extends this month's decline, the June 29th low crossing at 3.6830 is the next downside target. Closes below the 10-day moving average crossing at 3.8718 would signal that a short-term low has been posted. First resistance last-Friday's high crossing at 3.9280. Second resistance is August's high crossing at 4.0240. First support is the June 29th low crossing at 3.6830. Second support is May's low crossing at 3.5650.
GRAINS http://quotes.ino.com/ex changes/?c=grains
Grains: December corn was steady to slightly higher overnight. Overnight trading sets the stage for a steady to slightly higher opening when the day sessions begins trading. Stochastics and the RSI are oversold but remain bearish signaling that sideways to lower prices are possible near-term. If December extends the decline off July's high, July's low crossing at $4.81 is the next downside target. Closes above last-Monday's gap crossing at $5.25 1/2 would signal that a short-term low has been posted. First resistance is last-Monday's gap crossing at $5.25 1/2. Second resistance is the 50-day moving average crossing at $5.33 1/2. First support is Monday's low crossing at $4.89 1/4. Second support is July's low crossing at $4.81.
September wheat was lower overnight as it consolidated some of the rally off last-Thursday's low. Overnight trading sets the stage for a lower opening when the day session begins trading. Stochastics and the RSI are oversold but remain neutral to bearish signaling that sideways to lower prices are possible near-term. If September extends the aforementioned decline, the July 18th low crossing at $6.42 1/4 is the next downside target. Closes above the 20-day moving average crossing at $6.80 1/2 would signal that a short-term low has been posted. First resistance is the 50-day moving average crossing at $6.70 1/4. Second resistance is the 20-day moving average crossing at $6.80 1/2. First support is July's low crossing at $6.22. Second support is May's low crossing at $5.87 3/4.
September Kansas City wheat was lower overnight. Overnight trading sets the stage for a lower opening when the day session begins trading later this morning. Stochastics and the RSI are oversold but remain neutral to bearish signaling that sideways to lower prices are possible near-term. If September extends the decline off July's high, May's low crossing at $7.33 is the next downside target. Closes above the 20-day moving average crossing at $8.26 1/4 would signal that a low has been posted. First resistance is the 50-day moving average crossing at $8.20 1/4. Second resistance is the 20-day moving average crossing at $8.26 1/4. First support is Monday's low crossing at $7.48 1/4. Second support is May's low crossing at $7.33.
September Minneapolis wheat was lower overnight and sets the stage for a lower opening when the day session begins trading. Stochastics and the RSI are oversold but remain neutral to bearish signaling that sideways to lower prices are possible near-term. If September extends the decline off July's high, July's low crossing at $8.07 1/4 is the next downside target. Closes above the 20-day moving average crossing at $8.72 1/4 would signal that a low has been posted. First resistance is the 50-day moving average crossing at $8.48 1/4. Second resistance is the 20-day moving average crossing at $8.72 1/4. First support is July's low crossing at $8.07 1/4. Second support is the June 14th low crossing at $8.01 1/4.
SOYBEAN COMPLEX? http://quotes.ino.com/ex?changes/?c=grains "
November soybeans was higher overnight as it consolidates some of the decline off July's high. Overnight trading sets the stage for a higher opening when the day session begins trading later this morning. Stochastics and the RSI are oversold but remain neutral to bearish signaling that sideways to lower prices are possible near-term. If November extends the decline off July's high, the 62% retracement level of the May-July rally crossing at $12.46 3/4 is the next downside target. Closes above the 20-day moving average crossing at $13.67 1/4 would signal that a low has been posted. First resistance is the 10-day moving average crossing at $13.35 1/2. Second resistance is the 20-day moving average crossing at $13.67 1/4. First support is the 50% retracement level of the May-July rally crossing at $12.82 3/4. Second support is the June 28th low crossing at $12.56 3/4.
December soybean meal was slightly higher overnight as it consolidates some of the decline off July's high. Overnight trading sets the stage for a slightly higher opening when the day session begins trading. Stochastics and the RSI are oversold but remain neutral to bearish signaling that sideways to lower prices are possible near-term. If December extends the decline off July's high, the July 7th low crossing at $384.70 is the next downside target. Closes above last-Monday's gap crossing at $392.40 would temper the bearish outlook. First resistance is last-Monday's gap crossing at $392.40. Second resistance is July's high crossing at $424.70. First support is the July 7th low crossing at $384.70. Second support is the June 29th low crossing at $374.60.
December soybean oil was higher in overnight trading as it extends last-week's trading range. Overnight trading sets the stage for a higher opening when the day session begins trading. Stochastics and the RSI are becoming oversold but remain neutral to bearish signaling that sideways to lower prices are possible near-term. If December extends the decline off July's high, the 50-day moving average crossing at 57.23 is the next downside target. Closes above the 20-day moving average crossing at 61.42 would temper the bearish outlook. First resistance is the 75% retracement level of the 2022-2023 decline crossing at 65.45. Second resistance is the 87% retracement level of the 2022-2023 decline crossing at 68.81. First support is Tuesday's low crossing at 57.86. Second support is the 50-day moving average crossing at 57.23.
Thanks tallpine!
Still looks like widespread heat will define the 2nd half of August.
Rain amounts are shrinking in parts of the belt. Add that to the heat and it means a less bearish forecast as mentioned yesterday morning.
We got the reversal higher after spiking down yesterday with some follow thru overnight. Near term rains could still pressure the market, not sure.
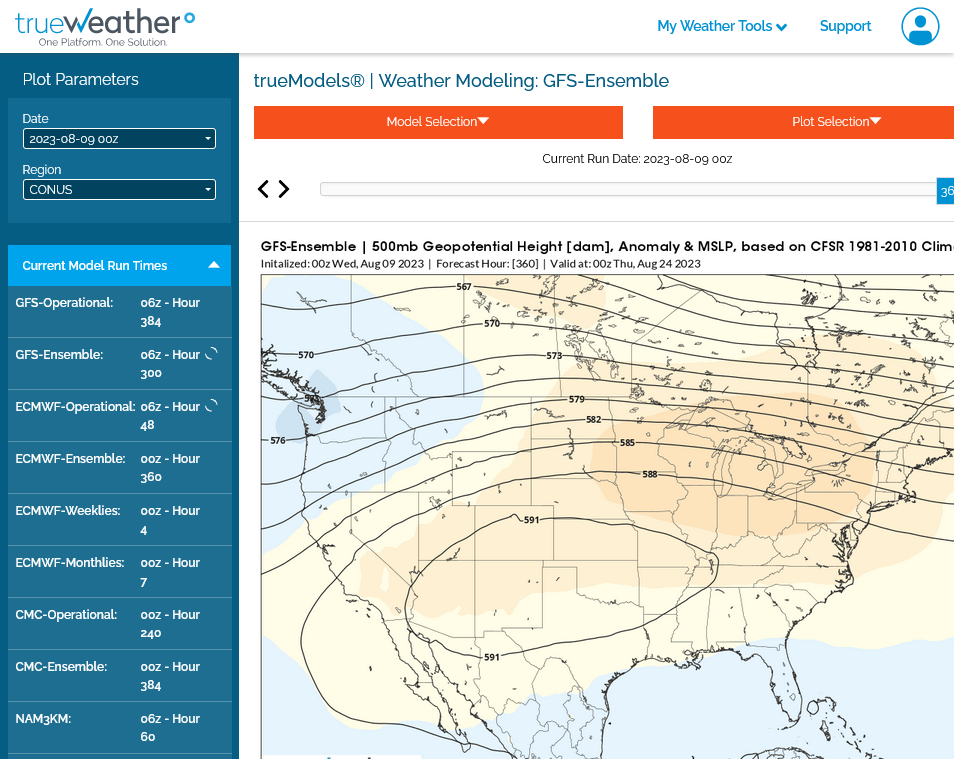
This was the last 0z overnight.
1. Upper levels/500 mb on August 24
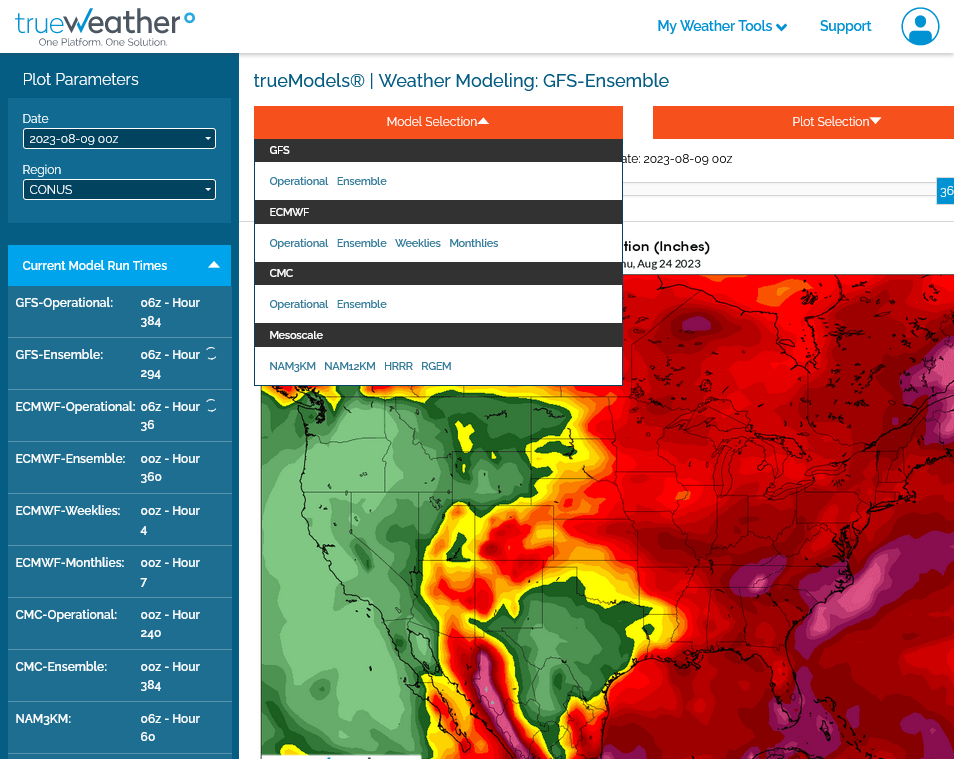
2. Total rains.
Day 1 below:
http://www.wpc.ncep.noaa.gov/qpf/fill_94qwbg.gif?1526306199054

Day 2 below:
http://www.wpc.ncep.noaa.gov/qpf/fill_98qwbg.gif?1528293750112

Day 3 below:
http://www.wpc.ncep.noaa.gov/qpf/fill_99qwbg.gif?1528293842764

Days 4-5 below:
http://www.wpc.ncep.noaa.gov/qpf/95ep48iwbg_fill.gif?1526306162

Days 6-7 below:
http://www.wpc.ncep.noaa.gov/qpf/97ep48iwbg_fill.gif?1526306162

7 Day Total precipitation below:
http://www.wpc.ncep.noaa.govcdx /qpf/p168i.gif?1530796126

It's the northwest half of the belt at highest risk with this pattern.
The overnight models were LESS hot but the pattern coming up is still HOT and so ng wouldn't go lower, instead it went higher anyway.
0z EE was -4 CDD's below vs the previous 12z run, on the right in purple. Still alot of heat on the way! Look at how high the lines are compared to the dropping average, dashed green line below it!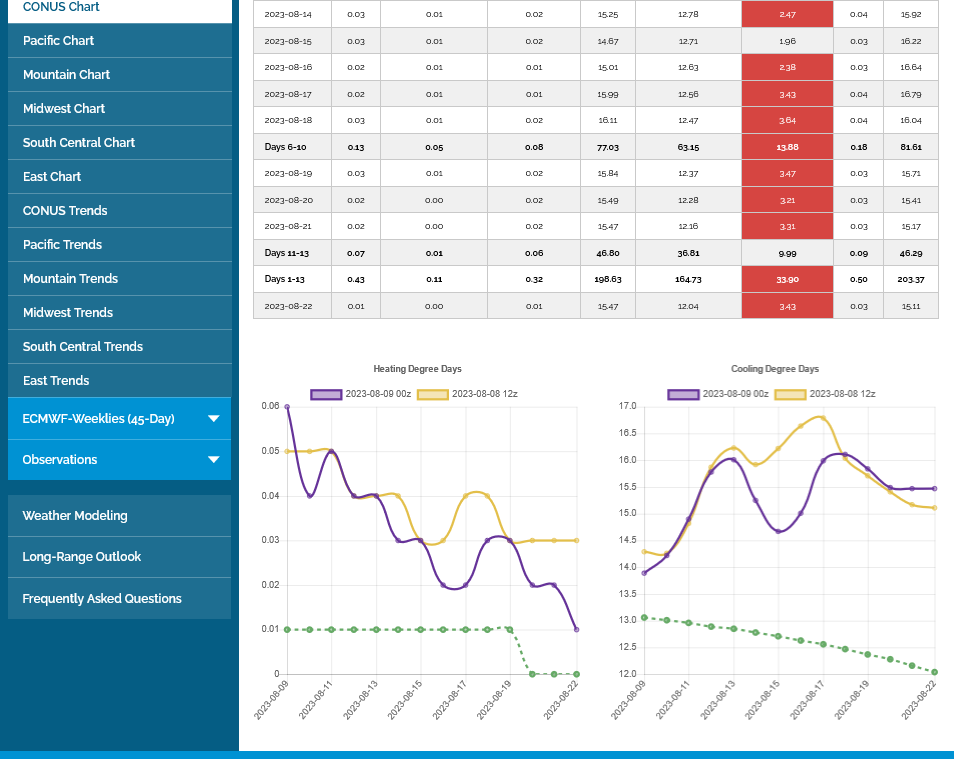

All the weather, updated on a regular basis automatically:
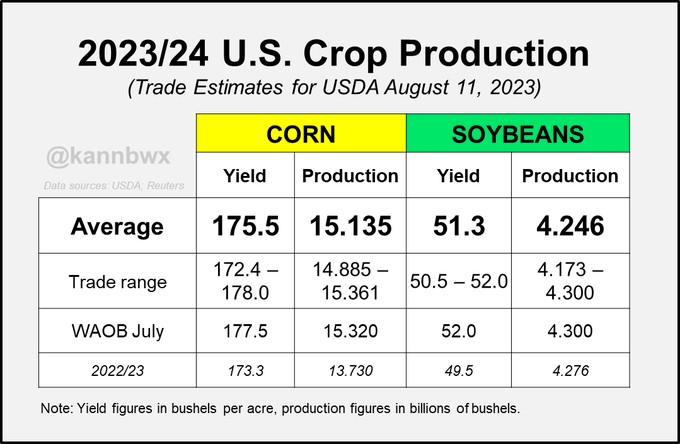
I just remembered there's a USDA report coming up on Friday. Market expectations on that could be very important this week.
The trade sees yields for U.S. #corn & #soybeans coming in below USDA's July estimates on Friday. Only 2 of 20 analysts polled by Reuters saw corn yield at or above 177.5, and only 2 predict bean yield staying at 52 (but no one went higher).
Just updated 12z Canadian model and individual ensembles. Widespread upper level ridging over much of the country, along with heat. The Midwest/Northeast trough thru much of the Summer is being replaced by upper level ridging.
Central Canada has some deep upper level low solutions with a strong jet stream implied underneath.
384h GZ 500 forecast valid on Aug 25, 2023 12 UTC


Forecasts for the control (GEM 0) and the 20 ensemble members (global model not available)
Huge rain event continues to unfold in the Midwest. Mainly the southeastern half to go.

New radar product below
Go to: "Select View" then "Local Radar"
Hit the purple circle to see that local radar site
+++++++++++++++++++++++
This link below provides some great data. After going to the link, hit "Mesoanalysis" then, the center of any box for the area that you want, then go to observation on the far left, then surface observations to get constantly updated surface observations or hit another of the dozens of choices.
 Found a great new link/site that shows us how much precip fell(from 1 hr to 72 hours) for different periods to share with you. https://www.iweathernet.com/total-rainfall-map-24-hours-to-72-hours Data Update Cycle: The 1-hr mosaic is updated every 5 min (approx). All other mosaics are now updated hourly, including the 48h and 72h maps. The site does not allow me to copy the actual images/data here, as we do with all the other links above..........so just go to the link! |