KEY EVENTS TO WATCH FOR:
Tuesday, July 25, 2023
8:55 AM ET. Johnson Redbook Retail Sales Index
Ret Sales Mo-to-Date, Y/Y% (previous -0.3%)
Latest Wk, Y/Y% (previous -0.2%)
9:00 AM ET. May U.S. Monthly House Price Index
9:00 AM ET. May S&P CoreLogic Case-Shiller Indices
10-City Idx, M/M% (previous +1.7%)
10-City Idx, Y/Y% (previous -1.2%)
20-City Idx, M/M% (previous +1.7%)
20-City Idx, Y/Y% (previous -1.7%)
National Idx, M/M% (previous +1.3%)
National Idx, Y/Y% (previous -0.2%)
10:00 AM ET. July Consumer Confidence Index
Cons Conf Idx (previous 109.7)
Expectation Idx (previous 79.3)
Present Situation Idx (previous 155.3)
10:00 AM ET. July Richmond Fed Business Activity Survey
Mfg Idx (previous -7)
Shipments Idx (previous -5)
1:00 PM ET. June Money Stock Measures
4:30 PM ET. API Weekly Statistical Bulletin
Crude Stocks, Net Chg (Bbls) (previous -0.8M)
Gasoline Stocks, Net Chg (Bbls) (previous -2.8M)
Distillate Stocks, Net Chg (Bbls) (previous -0.1M)
N/A U.S. Federal Open Market Committee meeting
Wednesday, July 26, 2023
7:00 AM ET. MBA Weekly Mortgage Applications Survey
Composite Idx (previous 210.7)
Composite Idx, W/W% (previous +1.1%)
Purchase Idx-SA (previous 163.2)
Purchase Idx-SA, W/W% (previous -1.3%)
Refinance Idx (previous 446.4)
Refinance Idx, W/W% (previous +7.3%)
10:00 AM ET. June New Residential Sales
New Home Sales (previous 763K)
New Home Sales, M/M% (previous +12.2%)
New Home Sales Months Supply (previous 6.7)
10:30 AM ET. EIA Weekly Petroleum Status Report
Crude Oil Stocks (Bbl) (previous 457.42M)
Crude Oil Stocks, Net Chg (Bbl) (previous -0.708M)
Gasoline Stocks (Bbl) (previous 218.386M)
Gasoline Stocks, Net Chg (Bbl) (previous -1.066M)
Distillate Stocks (Bbl) (previous 118.194M)
Distillate Stocks, Net Chg (Bbl) (previous +0.013M)
Refinery Usage (previous 94.3%)
Total Prod Supplied (Bbl/day) (previous 20.767M)
Total Prod Supplied, Net Chg (Bbl/day) (previous +2.066M)
2:00 PM ET. U.S. interest rate decision
Federal Funds Rate
Federal Funds Rate Change (Pts)
Fed Funds Rate-Range High (previous 5.25)
Fed Funds Rate-Range Low (previous 5.00)
FOMC Vote For Action (previous 11)
FOMC Vote Against Action (previous 0)
Discount Rate (previous 5.25)
Discount Rate Change (Pts) (previous +0.00)
Discount Rate-Range High
Discount Rate-Range Low
Thursday, July 27, 2023
8:30 AM ET. U.S. Weekly Export Sales
8:30 AM ET. Unemployment Insurance Weekly Claims Report - Initial Claims
Jobless Claims
Jobless Claims, Net Chg
Continuing Claims
Continuing Claims, Net Chg
8:30 AM ET. June Advance Report on Durable Goods
Durable Goods-SA, M/M% (previous +1.7%)
Dur Goods, Ex-Defense, M/M% (previous +3%)
Dur Goods, Ex-Transport, M/M% (previous +0.6%)
Orders: Cap Gds, Non-Def, Ex-Air, M/M% (previous +0.7%)
Shipmnts: Cap Gds, Non-Def, Ex-Air, M/M% (previous +0.2%)
8:30 AM ET. 2nd Quarter Advance estimate GDP
Annual Rate, Q/Q% (previous +2.0%)
Chain-Weighted Price Idx, Q/Q% (previous +4.1%)
PCE Price Idx, Q/Q% (previous +4.1%)
Purchase Price Idx, Q/Q%
Real Final Sales 1st Est, Q/Q%
Core PCE Price Idx, Q/Q%
Personal Consumption, Q/Q% (previous +4.2%)
8:30 AM ET. June Advance Economic Indicators Report
10:00 AM ET. June Pending Home Sales Index
Pending Home Sales (previous 76.5)
Pending Home Sales Idx, M/M% (previous -2.7%)
Pending Home Sales Idx , Y/Y% (previous -22.2%)
10:30 AM ET. EIA Weekly Natural Gas Storage Report
Working Gas In Storage (Cbf)
Working Gas In Storage, Net Chg (Cbf)
11:00 AM ET. July Federal Reserve Bank of Kansas City Survey of Tenth District Manufacturing
Mfg Activity Idx (previous -10)
6-Mo Exp Prod Idx (previous 15)
Mfg Composite Idx (previous -12)
6-Mo Exp Composite Idx (previous -2)
4:30 PM ET. Federal Discount Window Borrowings
4:30 PM ET. Foreign Central Bank Holdings
Friday, July 28, 2023
8:30 AM ET. June Personal Income and Outlays
Personal Income, M/M% (previous +0.4%)
Consumer Spending, M/M% (previous +0.1%)
PCE Price Idx, M/M% (previous +0.1%)
PCE Price Idx, Y/Y% (previous +3.8%)
PCE Core Price Idx, M/M% (previous +0.3%)
PCE Core Price Idx, Y/Y% (previous +4.6%)
8:30 AM ET. 2nd Quarter Employment Cost Index
ECI, Q/Q% (previous +1.2%)
ECI, Y/Y% (previous +4.8%)
10:00 AM ET. July University of Michigan Survey of Consumers - final
End-Mo Sentiment Idx (previous 64.4)
End-Mo Expectations Idx (previous 61.5)
12-Month Inflation Forecast (previous 3.3%)
5-Year Inflation Forecast (previous 3.0%)
End-Mo Current Idx (previous 69.0)
3:00 PM ET. June Agricultural Prices
Farm Prices, M/M% (previous -2.8%)
The STOCK INDEXES? http://quotes.ino.com/ex?changes/?c=indexes
The Dow closed higher on Monday as it extends the rally off July's low. The high-range close sets the stage for a steady to higher opening when Tuesday's day session begins trading. Stochastics and the RSI are overbought but remain neutral to bullish signaling that sideways to higher prices are possible near-term. If the Dow extends the rally off last-Monday's low, the April-2022 high crossing at 35,492.22 is the next upside target. Closes below the 20-day moving average crossing at 34,415.44 would signal that a short-term top has been posted. First resistance is the April - 2022 high crossing at 35,492.22. Second resistance is the February-2022 high crossing at 35,824.28. First support is the 10-day moving average crossing at 34,796.97. Second support is the 20-day moving average crossing at 34,415.44.
The September NASDAQ 100 closed slightly higher on Monday. The mid-range close sets the stage for a steady to slightly higher opening when Tuesday's night session begins trading. Stochastics and the RSI are neutral to bearish signaling sideways to lower prices are possible. Closes below the 20-day moving average crossing at 15,421.77 would confirm that a short-term top has been posted while opening the door for additional weakness. If September extends this year's rally, the December-2021 high on the weekly continuation chart crossing at 16,659.50 is the next upside target. First resistance is last-Wednesday's high crossing at 16,062.75. Second resistance is the December-2021 high on the weekly continuation chart crossing at 16,659.50. First support is the 20-day moving average crossing at 15,421.77. Second support is the 50-day moving average crossing at 14,869.30.
The September S&P 500 closed slightly higher on Monday. The high-range close sets the stage for a steady to higher opening when Tuesday's night session begins trading. Stochastics and the RSI are overbought but remain neutral to bullish signaling that sideways to higher prices are possible near-term. If September extends the rally off March's low, the 87% retracement level of the 2022 decline on the weekly chart crossing at 4639.07 is the next upside target. Closes below the 20-day moving average crossing at 4497.12 would confirm that a short-term top has been posted. First resistance is last-Wednesday's high crossing at 4609.25. Second resistance is the 87% retracement level of the 2022 decline on the weekly chart crossing at 4639.07. First support is the 10-day moving average crossing at 4551.10. Second support is the 20-day moving average crossing at 4497.16.
INTEREST RATES? http://quotes.ino.com/ex?changes/?c=interest ""
September T-bonds closed down 07/32's at 126-05.
September T-bonds closed lower on Monday. The low-range close sets the stage for a steady to lower opening when Tuesday's day session begins trading. Stochastics and the RSI are turning neutral to bearish signaling that sideways to lower prices are possible near-term. Closes below last-Thursday's low crossing at 125-29 would signal that a short-term top has been posted.If September renews the rally off July's low, the 50% retracement level of the April-July decline crossing at 128-21 is the next upside target. First resistance is the 50% retracement level of the April-July decline crossing at 128-21. Second resistance is the June high crossing at 129-16. First support is last-Thursday's low crossing at 125-29. Second support is July's low crossing at 122-30.
September T-notes closed down 55-pts. at 112.020.
September T-notes closed lower on Monday as it extended last-week's decline. The low-range close sets the stage for a steady to lower opening when Tuesday's day session begins trading. Stochastics and the RSI are turning neutral to bearish signaling that sideways to lower prices are possible near-term. Closes below last-Thursday's low crossing at 112.000 would confirm that a short-term top has been posted while opening the door for additional weakness near-term. If September renews the rally off the July 6th low, the 50-day moving average crossing at 113.098 would signal that a short-term low has been posted. First resistance is the 50-day moving average crossing at 113.098. Second resistance is June's high crossing at 115.000. First support is last-Thursday's low crossing at 112.000. Second support is July's low crossing at 110.050.
ENERGY MARKETS? http://quotes.ino.com/ex?changes/?c=energy ""
September crude oil closed sharply higher on Monday as it extended the rally off June's low. The high-range close sets the stage for a steady to higher opening when Tuesday's day session begins. Stochastics and the RSI are overbought but remain neutral to bullish signaling that sideways to higher prices are possible near-term. If September extends the rally off June's low, April's high crossing at $81.44 is the next upside target. Closes below the 20-day moving average crossing at $73.36 would signal that a short-term top has been posted. First resistance the 87% retracement level of the April-May decline crossing at $79.23. Second resistance is April's high crossing at $81.44. First support is the 20-day moving average crossing at $73.36. Second support is the 50-day moving average crossing at $71.88.
September heating oil closed higher on Monday as it extended the rally off May's low. The mid-range close sets the stage for a steady to higher opening when Tuesday's day trading session begins. Stochastics and the RSI are overbought but remain neutral to bullish signaling that sideways to higher prices are possible near-term. If September extends the rally off May's low, the 62% retracement level of the 2022-2023 decline crossing at 2.8561 is the next upside target. Closes below the 20-day moving average crossing at 2.5363 would signal that a short-term top has been posted. First resistance is the 62% retracement level of the 2022-2023 decline crossing at 2.8561. Second resistance is the 75% retracement level of the 2022-2023 decline crossing at 3.0002. First support is the 10-day moving average crossing at 2.6318. Second support the 20-day moving average crossing at 2.5364.
September unleaded gas closed sharply higher on Monday as it extends the rally off May's low. The high-range close sets the stage for a steady to higher opening when Tuesday's day session begins trading. Stochastics and the RSI are overbought but remain neutral to bullish signaling that sideways to higher prices are possible near-term. If September extends the rally off the June 23rd low, the October-2022 high on the weekly continuation chart crossing at 3.0221 is the next upside target. Closes below the 20-day moving average crossing at 2.5414 would confirm that a short-term top has been posted. First resistance is today's high crossing at 2.8867. Second resistance is the October-2022 high on the weekly continuation chart crossing at 3.0221. First support is the 10-day moving average crossing at 2.6513. Second support is the 20-day moving average crossing at 2.5414.
September Henry natural gas closed lower on Monday but remains above the 20-day moving average crossing at 2.654 signaling that a short-term low has been posted. The low-range close sets the stage for a steady to lower opening when Tuesday's day session begins trading. Stochastics and the RSI are neutral to bullish signaling that sideways to higher prices are possible near-term.If September extends last-week's rally, June's high crossing at 2.911 is the next upside target. First resistance is the June high crossing at 2.911. Second resistance is the 25% retracement level of the 2022-2023 decline crossing at 3.193. First support is last-Monday's low crossing at 2.477. Second support is the June 1st low crossing at 2.249.
CURRENCIES? http://quotes.ino.com/ex?changes/?c=currencies ""
The September Dollar closed higher for the fifth-day in a row on Monday as it extends the rally off last-Tuesday's low. The high-range close sets the stage for a steady to higher opening when Tuesday's session begins trading. Stochastics and the RSI are bullish signaling that sideways to higher prices are possible near-term. Closes above the 20-day moving average crossing at 101.369 would confirm that a short-term low has been posted. If September renews the decline off July's high, weekly support on the weekly continuation chart crossing at 97.730 is the next downside target. First resistance is today's high crossing at 101.150. Second resistance is the 20-day moving average crossing at 101.370. First support is last-Tuesday's low crossing at 99.220. Second support is weekly support on the continuation chart crossing at 97.730.
The September Euro closed sharply lower on Monday as it extended the decline off Tuesday's high. The low-range close sets the stage for a steady to lower opening when Tuesday's day session begins trading. Stochastics and the RSI are neutral to bearish signaling that sideways to lower prices are possible near-term. Closes below the 20-day moving average crossing at $1.10768 would confirm that a short-term top has been posted. If September resumes the rally off July's low, the March 30th high crossing at 1.15190 is the next upside target. First resistance is last-Tuesday's high crossing at $1.13105. Second resistance is the March 30th high crossing at 1.15190. First support is today's low crossing at 1.10935 Second support is the 20-day moving average crossing at $1.10768.
The September British Pound closed lower on Monday as it extends the decline off the July 14th high. The low-range close sets the stage for a steady to lower opening when Tuesday's day session begins trading. Stochastics and the RSI are bearish signaling sideways to lower prices are possible near-term. If September extends the aforementioned decline, the 50-day moving average crossing at 1.2669 is the next downside target. Closes above the 10-day moving average crossing at 1.2978 would signal that a short-term low has been posted. First resistance is the July 14th high crossing at 1.3146. Second resistance is the 75% retracement level of the 2022-2023 decline crossing at 1.3253. First support is today's low crossing at 1.2801. Second support is the 50-day moving average crossing at 1.2669.
The September Swiss Franc closed lower on Monday as it extended the decline off July's high. The low-range close sets the stage for a steady to lower opening when Tuesday's day session begins trading. Stochastics and the RSI are neutral to bearish signaling that sideways to lower prices are possible near-term. If September extends the decline off last-week's high. the 20-day moving average crossing at 1.14569 is the next downside target. If September renews the rally off May's low, the January 2019 high crossing at 1.18680 is the next upside target. First resistance is the July 18th high crossing at 1.17650. Second resistance is the January 2019 high crossing at 1.18680. First support is today's low crossing at 1.15785. Second support is the 20-day moving average crossing at 1.14569.
The September Canadian Dollar closed higher on Monday. The high-range close sets the stage for a steady to higher opening when Tuesday's day session begins trading. Stochastics and the RSI are turning neutral to bearish signaling that sideways to lower prices are possible near-term. Closes below last-Tuesday's low crossing at 75.57 would signal that a short-term top has been posted while opening the door for additional weakness near-term. If September renews the rally off the January 7th low, the September 12th 2022 high crossing at 77.11 is the next upside target. First resistance is the 38% retracement level of the 2021-2022 decline crossing at 76.28. Second resistance is the September 12th high crossing at 77.11. First support is last-Tuesday's low crossing at 75.57. Second support is the 50-day moving average crossing at 75.13.
The September Japanese Yen posted an inside day with a slightly higher close on Monday as it consolidated some of the decline off July's high. The low-range close sets the stage for a steady to slightly lower opening when Tuesday’s day session begins trading. Stochastics and the RSI are neutral to bearish signaling that sideways to lower prices are possible near-term. If September extends the decline off July's high, June's low crossing at 0.069755 is the next downside target. If September resumes the rally off June's low, the 38% retracement level of the January-June decline crossing at 0.074017 is the next upside target. First resistance is July's high crossing at 0.073585. Second resistance is the 38% retracement level of the January-June decline crossing at 0.074017 is the next upside target. First support is today's low crossing at 0.071130. Second support is June's low crossing at 0.069755.
PRECIOUS METALS? http://quotes.ino.com/ex?changes/?c=metals ""
August gold closed lower on Monday as it consolidates some of the rally off June's low. The low-range close sets the stage for a steady to lower opening when Tuesday's day session begins trading. Stochastics and the RSI are turning neutral to bearish signaling that sideways to lower prices are possible near-term. Closes below the 20-day moving average crossing at $1945.10 would signal that a short-term top has been posted. If August renews the rally off June's low, June's high crossing at $2000.70 is the next upside target. First resistance is June's high crossing at $2000.70. Second resistance is May's high crossing at $2102.20. First support is the 20-day moving average crossing at $1945.10. Second support is June's low crossing at $1911.40. Third support is the 50% retracement level of the 2022-2023 rally crossing at $1892.30.
September silver closed lower on Monday as it consolidated some of the rally off June's low. The low-range close sets the stage for a steady to lower opening when Tuesday's day session begins trading. Stochastics and the RSI are turning neutral to bearish signaling that sideways to lower prices are possible near-term. Closes below the 50-day moving average crossing at 23.913 would signal that a short-term top has been posted. If July renews the rally off June's low, the 75% retracement level of the April-June decline crossing at 25.561 is the next upside target. First resistance is last-Thursday's high crossing at 25.475. Second resistance is the 75% retracement level of the April-June decline crossing at 25.561. First support is the 20-day moving average crossing at 23.942. Second support is the 50-day moving average crossing at 23.914.
September copper closed higher on Monday. The high-range close sets the stage for a steady to higher opening when Tuesday's day session begins trading. Stochastics and the RSI remain neutral to bearish signaling that sideways to lower prices are possible near-term. Closes below the 50-day moving average crossing at 3.7807 would signal that a short-term top has been posted. If September renews the rally, July's high crossing at 3.9540 is the next upside target. First resistance is July's high crossing at 3.9540. Second resistance is June's high crossing at 3.9640. First support is the 50-day moving average crossing at 3.7807. Second support is the June 29th low crossing at 3.6830.
GRAINS? http://quotes.ino.com/ex?changes/?c=grains "
December Corn closed up $0.32-cents at $5.68 1/4.
December corn closed sharply higher on Monday as it extended the rally off July's low. The high-range close sets the stage for a steady to higher opening when Tuesday's night session begins trading. This afternoon's crop conditions report showed that corn crop ratings remained unchanged at 57% good to excellent. Stochastics and the RSI are neutral to bullish signaling that sideways to higher prices are possible near-term. If December extends the rally off July's low, the 75% retracement level of the June-July decline crossing at $5.92 3/4 is the next upside target. Closes below the 20-day moving average crossing at $5.22 would temper the near-term friendly outlook. First resistance is the 62% retracement level of the June-July decline crossing at $5.73. Second resistance is the 75% retracement level of the June-July decline crossing at $5.92 3/4. First support is the 50-day moving average crossing at $5.32 1/2. Second support is the 20-day moving average crossing at $5.22.
September wheat closed up $0.60-cents at $7.57 1/2.
September wheat closed limit up on Monday as it extended the rally off July's low. The high-range close sets the stage for a steady to higher opening when Tuesday's day session begins trading. Stochastics and the RSI are neutral to bullish signaling that sideways to lower prices are possible near-term. If September extends the rally off July's low, June's high crossing at $7.70 1/4 is the next upside target. Closes below the 50-day moving average crossing at $6.61 would signal that a short-term top has been posted. First resistance is June's high crossing at $7.70 1/4. Second resistance is 38% retracement level of the 2022-2023 decline crossing at $7.95 1/4. First support is the 20-day moving average crossing at $6.76. Second support is the 50-day moving average crossing at $6.61.
September Kansas City Wheat closed up $0.58 1/4-cents at $9.18 1/2.
September Kansas City wheat closed sharply lower on Monday and marked an upside breakout of this year's trading. The high-range close sets the stage for a steady to higher opening when Tuesday's day session begins trading. Stochastics and the RSI are neutral to bullish signaling that sideways to higher prices are possible near-term. If September extends the rally off July's low, the 50% retracement level of the 2022-2023 decline crossing at $9.46 3/4 is the next upside target. Closes below the 50-day moving average crossing at $8.27 1/4 is the next downside target. First resistance is today's high crossing at $9.02. Second resistance is the 50% retracement level of the 2022-2023 decline crossing at $9.46 3/4. First support is the 50-day moving average crossing at $8.27 1/4. Second support is the July 12th low crossing at $7.92. Third support is the July 3rd low crossing at $7.87 1/4.
September Minneapolis wheat closed up $0.49-cents crossing at $9.36.
September Minneapolis wheat closed sharply higher on Monday as it extended the rally off July's low. The high-range close sets the stage for a steady to higher opening when Tuesday's day session begins trading. Stochastics and the RSI are neutral to bullish signaling that sideways to higher prices are possible near-term. If September extends the rally off July's low, the 50% retracement level of the 2022-2023 decline crossing at $9.60 3/4 is the next upside target. Closes below the 20-day moving average crossing at $8.62 would signal that a short-term top has been posted. First resistance is the 50% retracement level of the 2022-2023 decline crossing at $9.60 3/4. Second resistance is the 62% retracement level of the 2022-2023 decline crossing at $10.05 1/2 is the next upside target. First support is the 20-day moving average crossing at $8.62. Second support is the 50-day moving average crossing at $8.42.
SOYBEAN COMPLEX? http://quotes.ino.com/ex?changes/?c=grains "
November soybeans closed down $0.22 3/4-cents at $14.24 1/2.
November soybeans closed higher on Monday as it extended the rally off May's low. The high-range close sets the stage for a steady to lower opening when Tuesday's day session begins trading. Stochastics and the RSI are overbought, diverging but remain neutral to bullish signaling that sideways to higher prices are possible near-term. If November extends the rally off May's low, the April-2022 high crossing at $14.48 1/4 is the next upside target. Closes below the 20-day moving average crossing at $13.52 would signal that a short-term top has been posted. First resistance is today's high crossing at $14.35. Second resistance is the April-2022 high crossing at $14.48 1/4. First support is the 10-day moving average crossing at $13.84. Second support is the 20-day moving average crossing at $12.52.
December soybean meal closed up $3.10 at $411.60.
December soybean meal closed higher on Monday. The high-range close sets the stage for a steady to higher opening when Tuesday's day session begins trading. Stochastics and the RSI are turning neutral to bearish signaling that sideways to lower prices are possible near-term. Closes below the 20-day moving average crossing at $397.90 would signal that a short-term top has been posted. If December extends this month's rally, the 87% retracement level of the March-May decline crossing at $428.00 is the next upside target. First resistance is the 75% retracement level of the March-May decline crossing at $418.80. Second resistance is the 87% retracement level of the March-May decline crossing at $428.00. First support is the 20-day moving average crossing at $397.90. Second support is the July 7th low crossing at $384.70.
December soybean oil closed up 194-pts. at 64.74.
December soybean oil closed sharply on Monday as it extends the rally off May's low.The high-range close sets the stage for a steady to higher opening when Tuesday's day session begins trading. Stochastics and the RSI are neutral to bullish signaling that sideways to higher prices are possible near-term. If December extends the rally off May's low, the 87% retracement level of the 2022-2023 decline crossing at 68.81 is the next upside target. Closes below the 20-day moving average crossing at 59.78 would signal that a short-term top has been posted. First resistance is today's high crossing at 65.58. Second resistance is the 87% retracement level of the 2022-2023 decline crossing at 68.81. First support is the 20-day moving average crossing at 59.78. Second support is the June 29th low crossing at 54.67.
LIVESTOCKhttp://quotes.ino.com/exchanges/?c=livestock
August hogs closed down $0.40 at $100.28.
August hogs closed lower on Monday as it consolidates some of the rally off May's low. The low-range close sets the stage for a steady to lower opening when Tuesday's day session begins trading. Stochastics and the RSI are overbought, diverging but remain neutral to bullish signaling that sideways to higher prices are possible near-term. If August extends the rally off May's low, the 87% retracement level of the 2022-2023 decline crossing at $104.40 is the next upside target. Closes below the 20-day moving average crossing at $95.58 would signal that a short-term top has been posted. First resistance is last-Friday's high crossing at $101.88. Second resistance is the 87% retracement level of the 2022-2023 decline crossing at $104.40. First support is the 20-day moving average crossing at $95.58. Second support is the 50-day moving average crossing at $89.03.
August cattle closed down $1.23 at $178.80.
August cattle closed lower on Monday as it extends the decline off last-Thursday's high. The low-range close sets the stage for a steady to lower opening on Tuesday. Stochastics and the RSI are turning neutral to bearish signaling that sideways to lower prices are possible near-term. Closes below the 20-day moving average crossing at $177.19 would signal that a short-term top has been posted. If August extends this year's rally into uncharted territory, upside targets will be hard to project. First resistance is last-Thursday's high crossing at $183.98. Second resistance is unknown. First support is the 20-day moving average crossing at $177.19. Second support is the 50-day moving average crossing at $171.84.
August Feeder cattle closed down $2.48 at $243.45.
August Feeder cattle closed sharply lower on Monday as it extends the trading range of the past three-weeks. The low-range close sets the stage for a steady to lower opening when Tuesday's day session begins trading. Stochastics and the RSI are neutral to bearish signaling that sideways to lower prices are possible near-term. Closes below the July 6th low crossing at $240.80 would mark a downside breakout of the aforementioned trading range. If August renews the rally off June's low into uncharted territory, upside targets will be hard to project. First resistance is July's high crossing at $251.30. Second resistance is unknown. First support is the July 6th low crossing at $240.80. Second support is the 50-day moving average crossing at $239.09.
FOOD & FIBERhttp://quotes.ino.com/ex changes/?c=food
September coffee closed higher on Monday. The mid-range close sets the stage for a steady to higher opening on Tuesday. Stochastics and the RSI are neutral to bullish signaling sideways to higher prices are possible near-term. Closes above the reaction high crossing at $16.39 would signal that a short-term low has been posted. If September extends the decline off June's high, the 87% retracement level of the January-April rally crossing at $15.20 is the next downside target. First resistance is the reaction high crossing at $16.39. Second resistance is the June 27th high crossing at $16.79. First support is last-Monday's low crossing at $15.51. Second support is the 87% retracement level of the January-April rally crossing at $15.20.
September cocoa closed slightly higher on Monday. The high-range close sets the stage for a steady to higher opening on Tuesday. Stochastics and the RSI are overbought but remain neutral to bullish signaling that sideways to higher prices are possible near-term. If September extends the rally off March's low, monthly resistance crossing at 37.75 is the next upside target. Closes below the July 13th low crossing at 32.60 would confirm that a short-term top has been posted.
October sugar closed slightly lower on Monday but remains above the 50-day moving average crossing at 24.58. The low-range close sets the stage for a steady to lower opening on Tuesday. Stochastics and the RSI are overbought but remain neutral to bullish signaling that sideways to higher prices are possible near-term. If October extends the rally off June's low, June's high crossing at 26.19 is the next upside target. Closes below the 20-day moving average crossing at 23.67 would signal that a short-term top has been posted.
December cotton posted an inside day with a higher close on Monday as it extends the rally off June's low. The high-range close sets the stage for a steady to higher opening on Tuesday. Stochastics and the RSI are overbought but remain neutral to bullish signaling sideways to higher prices are possible near-term. If December extends the rally off June's low, February's high crossing at 86.50 is the next upside target. Closes below the 20-day moving average crossing at 81.12 would signal that a short-term top has been posted.
 Thanks a ton, tallpine.
Today was not about weather.
More damage to the world from the horrible Ukraine war. This time wheat goes limit up and all the poor countries/people get punished with more expensive food with money they don't have. That especially pulled up corn.
But I continue to lean bullish and too dry for the US weather.
See these links for more info.
https://www.marketforum.com/forum/topic/97527/
https://www.marketforum.com/forum/topic/97559/
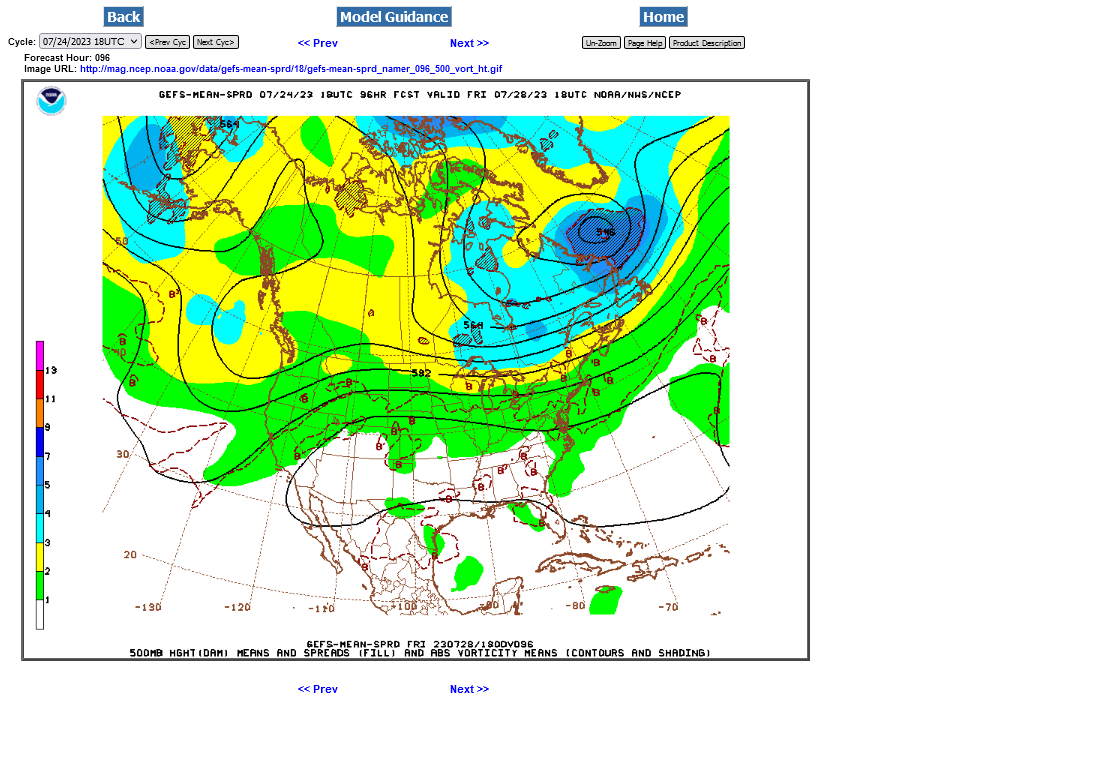
The GEFS has been the driest model the last several days instead of the wettest, like it was the last couple of months.
Heres the last 18z GEFS.
1. Total rains the next 16 days. Below average, except the far ECB. Least amounts in Northwest belt. Not sure what the NWS is thinking with so much rain in their week 2 outlooks.
https://www.marketforum.com/forum/topic/83844/#83852
Week 1 is pretty dry though
https://www.marketforum.com/forum/topic/83844/#83848
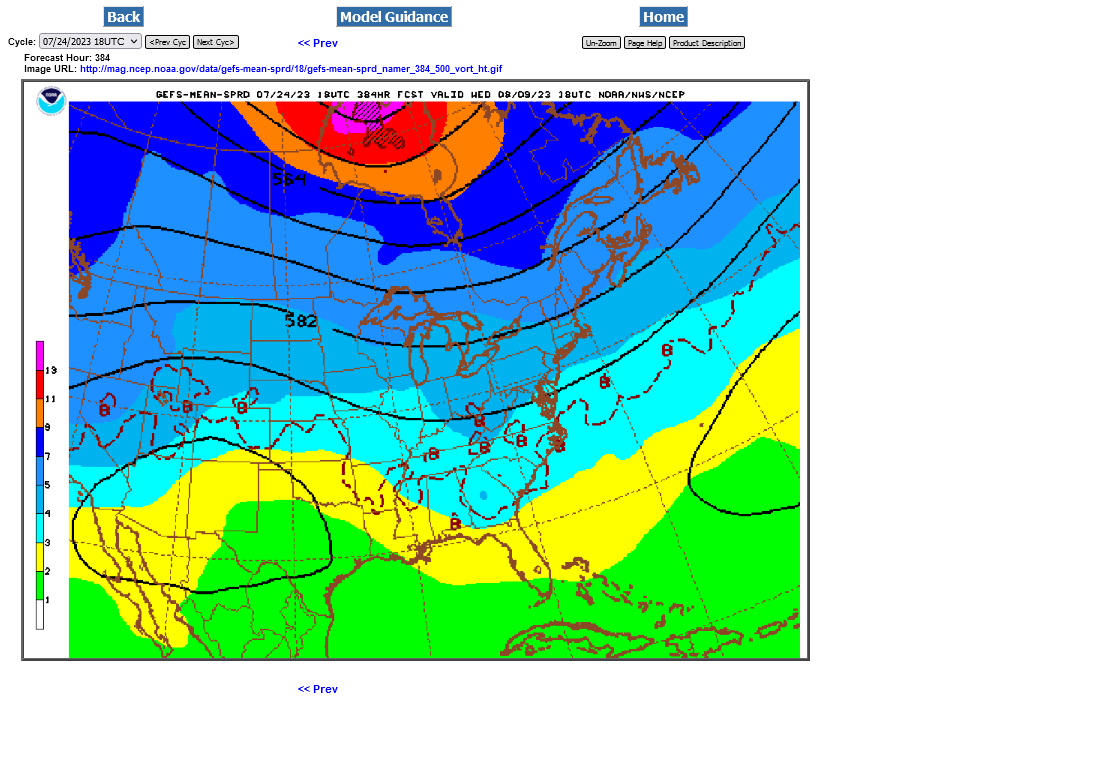
2. Upper levels. The dome spreads across the southern half of the US this week.
3. The dome recedes again in week 2 with very weak northwest flow which is often not very productive in a tricky pattern like this but no Bermuda High to pump in moisture. I'm below average for rain for most of the belt, maybe more than that ECB in early August.