


We should open higher on this weeks bullish weather.
More in a minute
The week 2 forecast on some models gets pretty bearish but on others, still stays dry with the cooler weather in week 2.
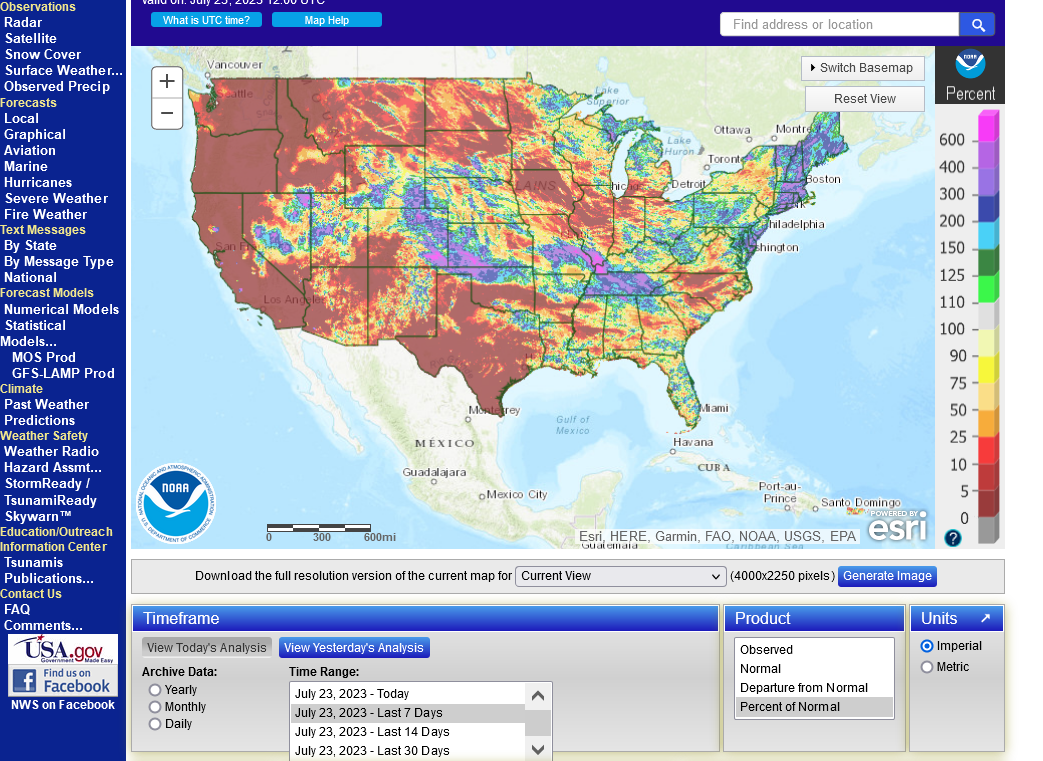
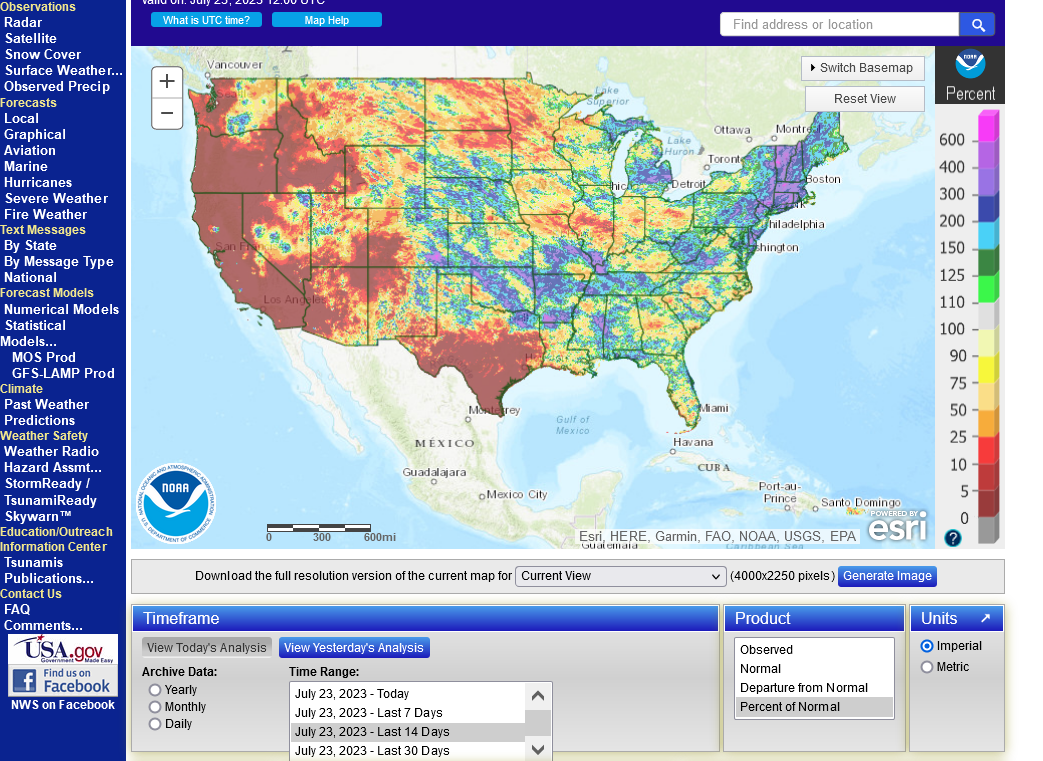
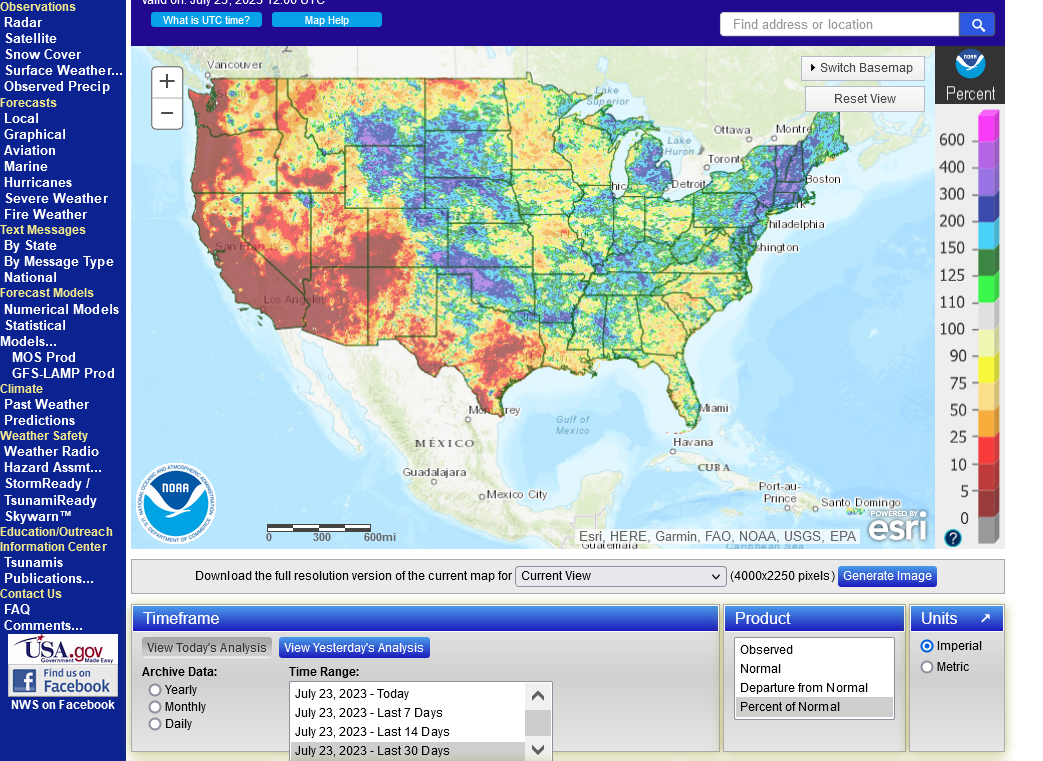
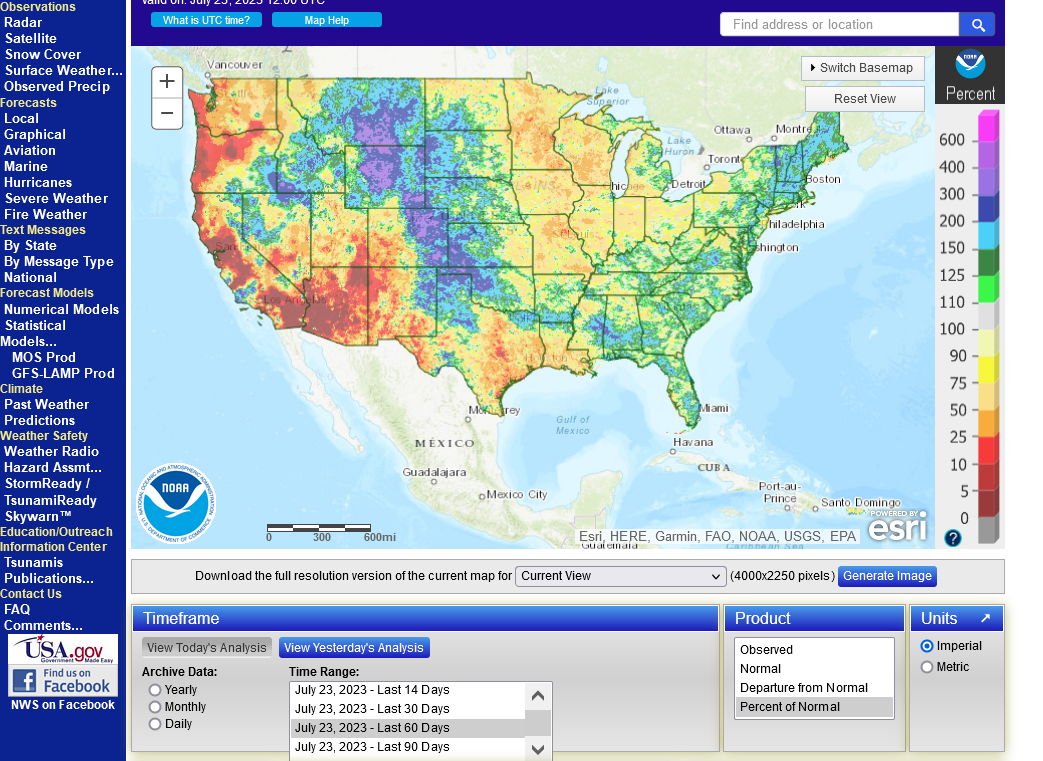
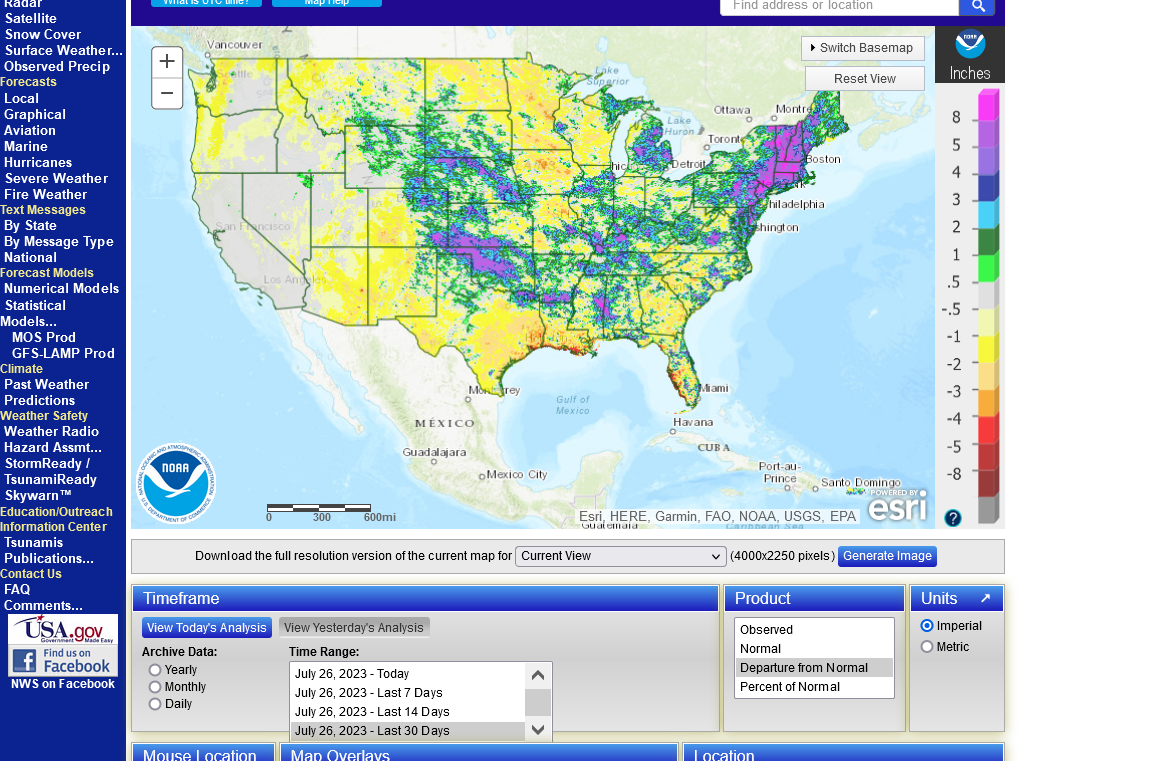
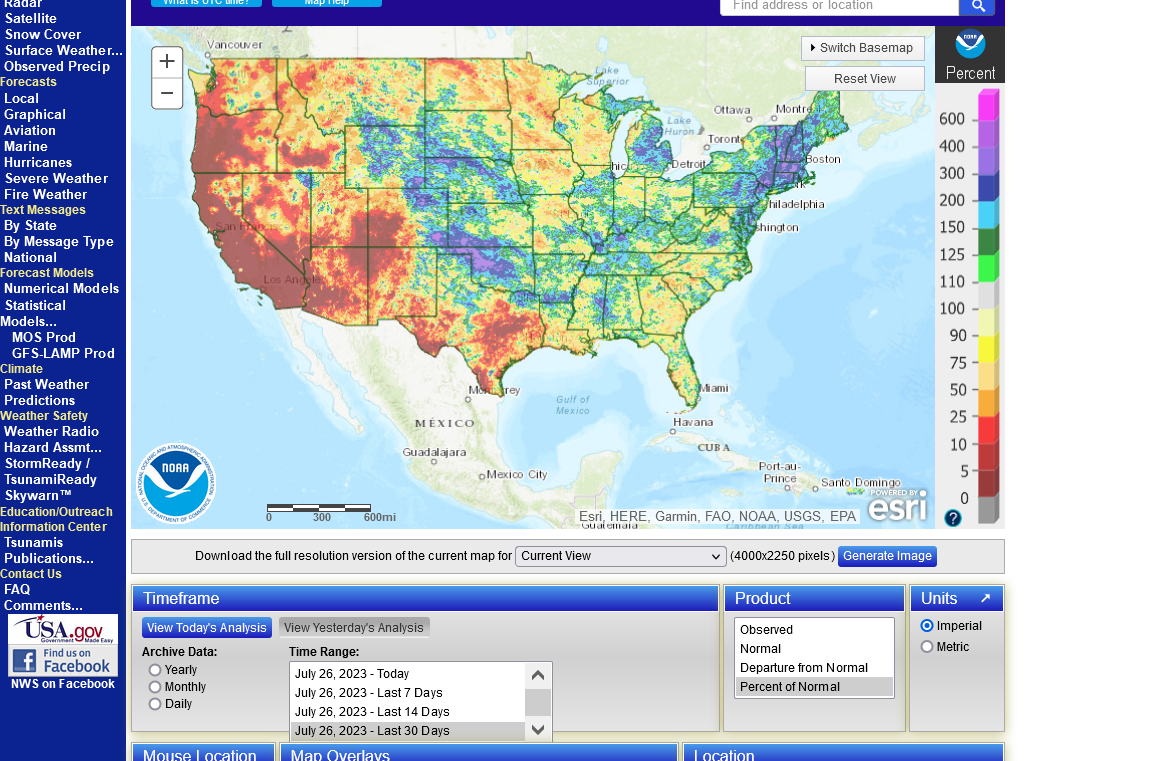
Recent rain amounts, % of average. The heavy rains from early this month have been used up and the soils were dry before then. So we need more rains ASAP.
1. Last 7 days
2. Last 14 days
3. Last 30 days
4. Last 60 days
https://water.weather.gov/precip/
Soilmoisture anomaly:
These maps sometimes take a day to catch up to incorporate the latest data(the bottom map is only updated once a week).
https://www.cpc.ncep.noaa.gov/products/Soilmst_Monitoring/US/Soilmst/Soilmst.shtml#
![]()


++++++++++++++++++++++++++++
Updated daily below:
https://mrcc.purdue.edu/cliwatch/watch.htm#curMonths

Most of the severe drought in the West has been wiped out!
https://droughtmonitor.unl.edu/
Last week, July 18, 2023
Previous week, July 11th below that.
Drought in the West was mostly wiped out earlier this year.
Huge expansion of drought in the Midwest recently got better, especially the ECB but still very dry subsurface moisture west of that.


Now the important part..........the weather forecast. It's mixed!
All the comprehensive weather:
https://www.marketforum.com/forum/topic/83844/
Not much rain this week:
The latest 7 day precip forecasts are below.
Day 1 below:
http://www.wpc.ncep.noaa.gov/qpf/fill_94qwbg.gif?1526306199054

Day 2 below:
http://www.wpc.ncep.noaa.gov/qpf/fill_98qwbg.gif?1528293750112

Day 3 below:
http://www.wpc.ncep.noaa.gov/qpf/fill_99qwbg.gif?1528293842764

Days 4-5 below:
http://www.wpc.ncep.noaa.gov/qpf/95ep48iwbg_fill.gif?1526306162

Days 6-7 below:
http://www.wpc.ncep.noaa.gov/qpf/97ep48iwbg_fill.gif?1526306162

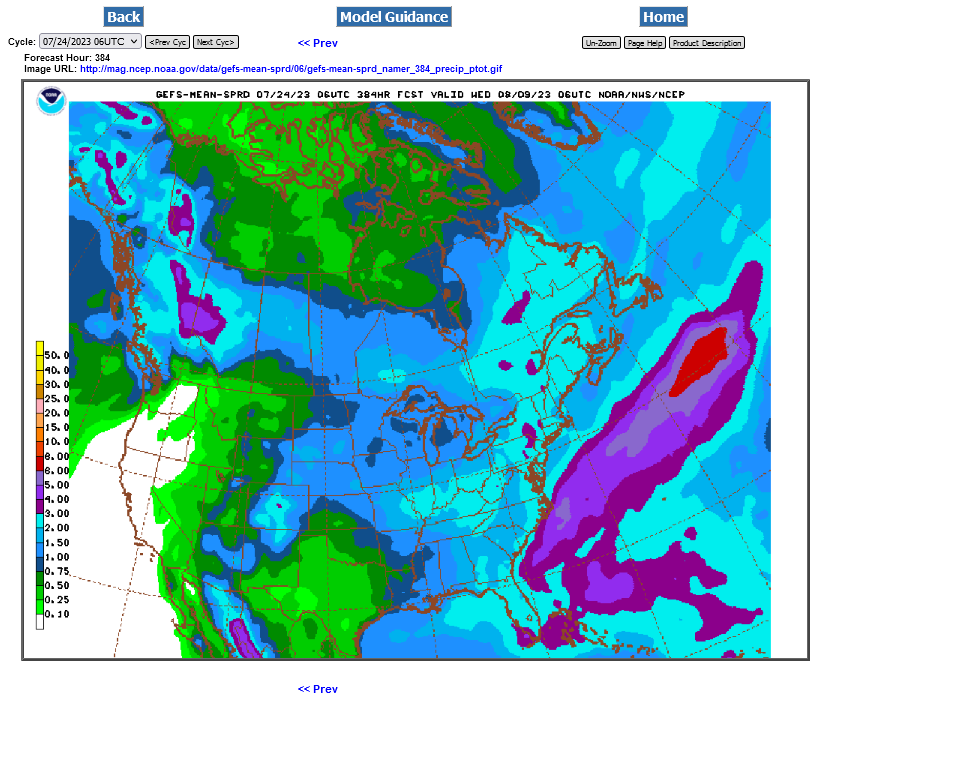
7 Day Total precipitation below:
http://www.wpc.ncep.noaa.govcdx /qpf/p168i.gif?1530796126

Lots of HEAT, mainly this week.
This is corn's 2nd worst enemy during filling, sometimes even worse than a cool drought!
Heat Fill for Corn
Started by metmike - July 14, 2023, 2:47 p.m.
https://www.marketforum.com/forum/topic/97257/
Highs for days 3-7:
https://www.wpc.ncep.noaa.gov/medr/medr_max.shtml
+++++++++++++++++++++++++++++++++++++++++++++++
Lows days 3-7 below:
https://www.wpc.ncep.noaa.gov/medr/medr_min.shtml
This would be pretty bullish if it continues in week 2........but the heat breaks with potential rains? early in week 2. Huge uncertainty on the rain amounts. Then it turns cooler with rain amounts all over the place.
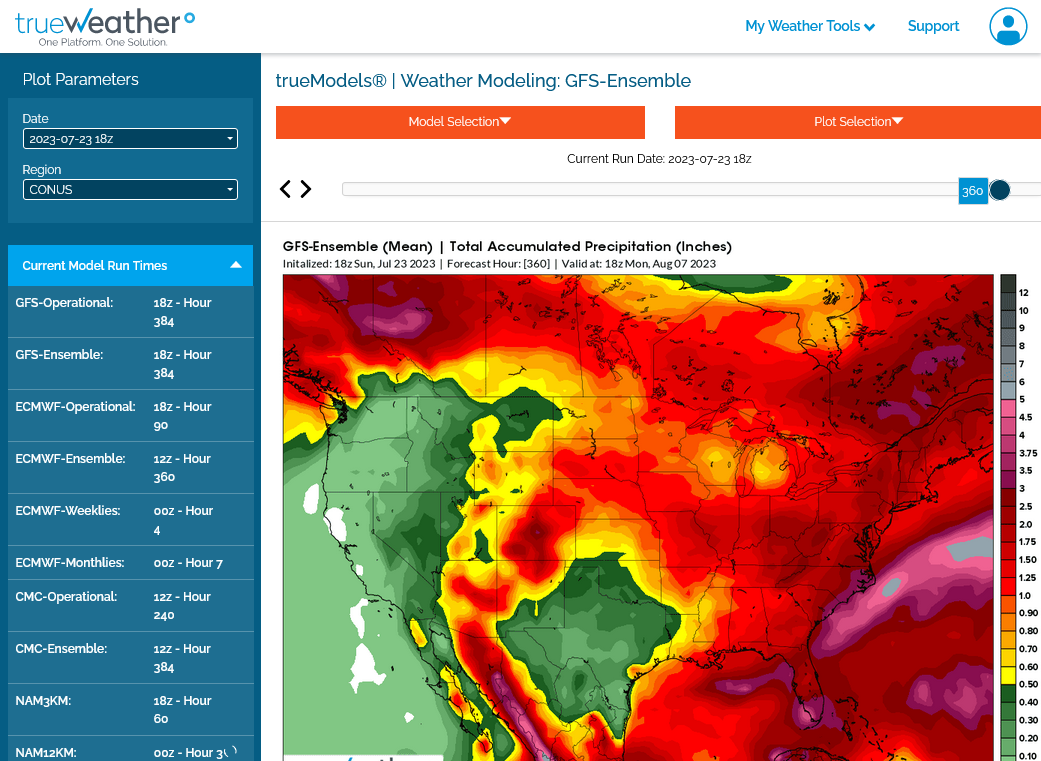
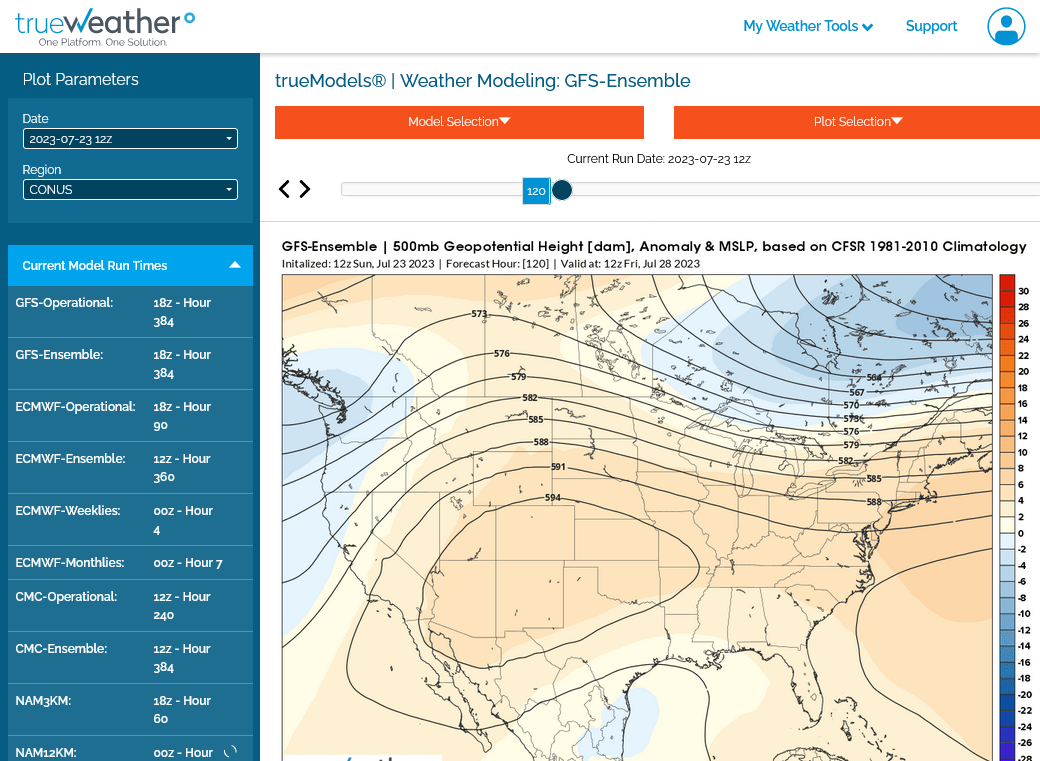
Now, the GEFS is the driest model after being the wettest most of the Summer!
Extended weather.
https://www.cpc.ncep.noaa.gov/products/predictions/610day/ | |||||||||
| 6 to 10 day outlooks | |||||||||
| Click below for information about how to read 6-10 day outlook maps Temperature Precipitation | |||||||||
| Click below for archives of past outlooks (data & graphics), historical analogs to todays forecast, and other formats of the 6-10 day outlooks ArchivesAnalogsLines-Only FormatGIS Data | |||||||||
Temperature Probability | |||||||||
Precipitation Probability | |||||||||
I'm leaning to the drier camp like back in May/June because there's no Bermuda High and northwest flow like this is always tricky.
Models are not able to capture perturbations in the Summer northwest flow accurately beyond a few days and historically, northwest flow disappoints more than it over achieves.
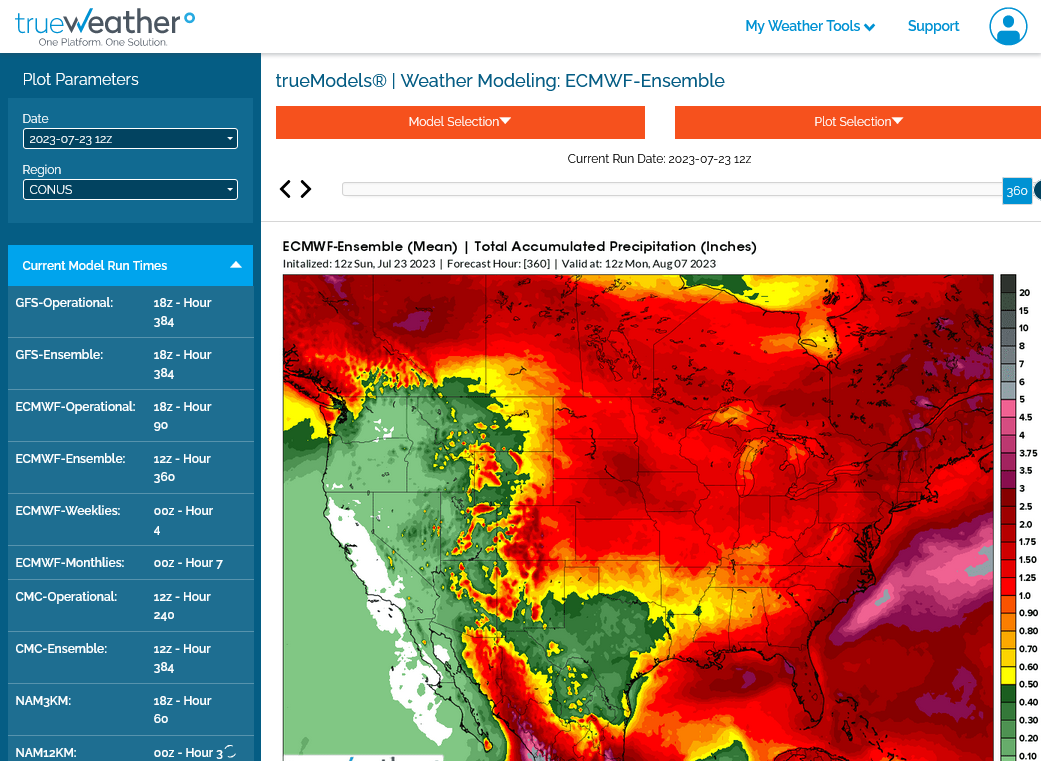
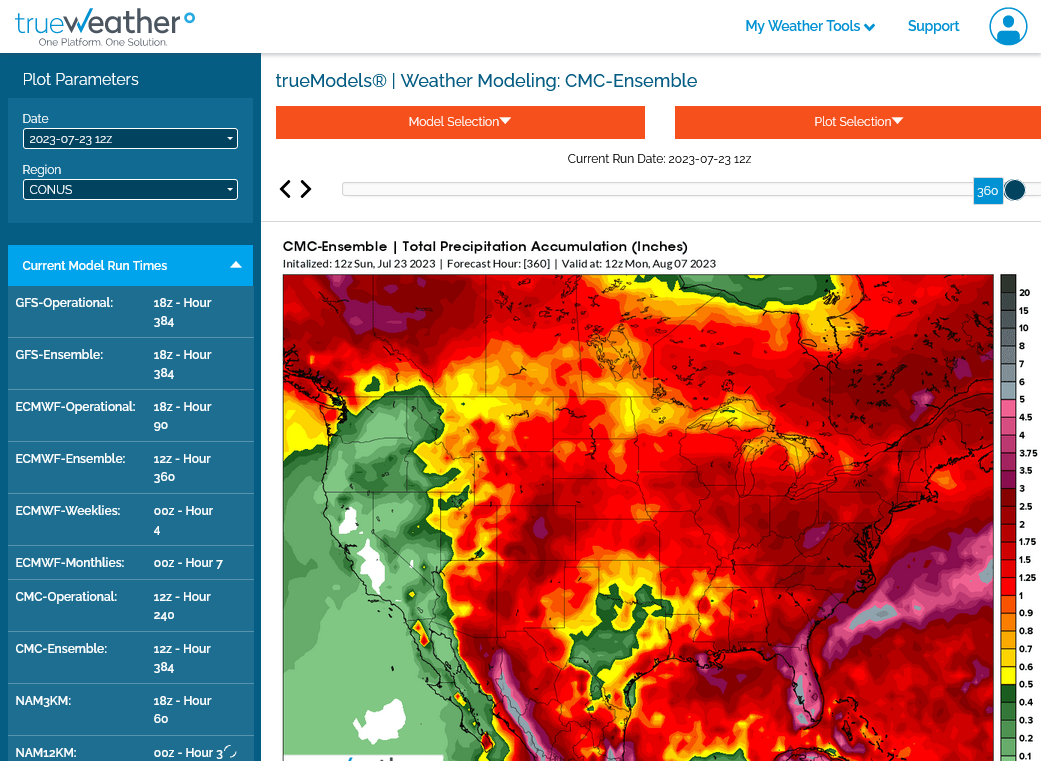
Here's the 3 model rain amounts from driest to wettest.
1. 18z GEFS-slightly more than the dries 12z run
2. 12z EE
3. 12z Canadian
4. Upper levels from 18z GEFS at 5 days, Dome expands east(from its spot in the Southwest) into, especially the WCB and SCB. However, northwest flow with a tight gradient might bring rains to the Upper Midwest? Bermuda high tries to build off the Southeast Coast.
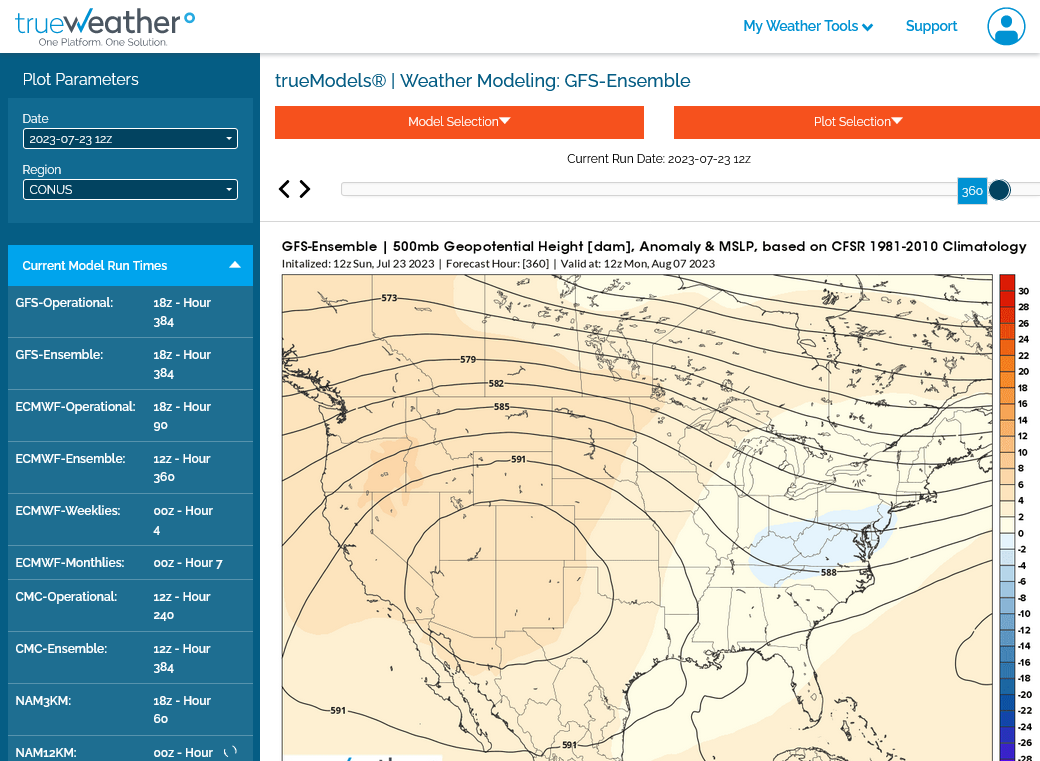
5. Dome retreats/backs up to its favored spot and northwest flow resumes at 15 days across the entire Midwest. This cuts the heat, however, the weak gradient and lack of Bermuda high along the East Coast (instead, a trough that suppresses good moisture return to the Midwest) have me leaning dry in week 2.
Thank you for the GREAT weather review!!
Grain markets in 'exuberant' mood! Almost sold around 815c time, but cancelled at 9---whew!
"UPON further review", looks like Wednesday for cycle high---but weather market!
EVERYONE take a very strong look at coffee and cotton!
Thanks tjc!
Weather for grains is bullish but there are some models not so bullish.
Last 6z GEFS is the driest for the N/Northwest half of the belt and most bullish.
Full report here: https://release.nass.usda.gov/reports/prog2923.txt
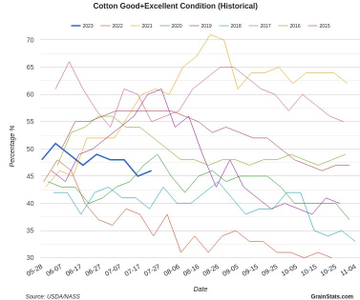
U.S. #corn conditions are unchanged on the week, #soybeans drop 1pt and spring #wheat falls 2pts. #Cotton improved 1pt and is doing better than a year ago. Winter wheat harvest pace is the second slowest for the date after 1993.
#corn conditions are unchanged at 57% good/excellent, against the expectation for +1pt. Strong improvements in Illinois, Kansas, Kentucky were offset by declines in many other states including Minnesota, Ohio, Missouri & the Dakotas.
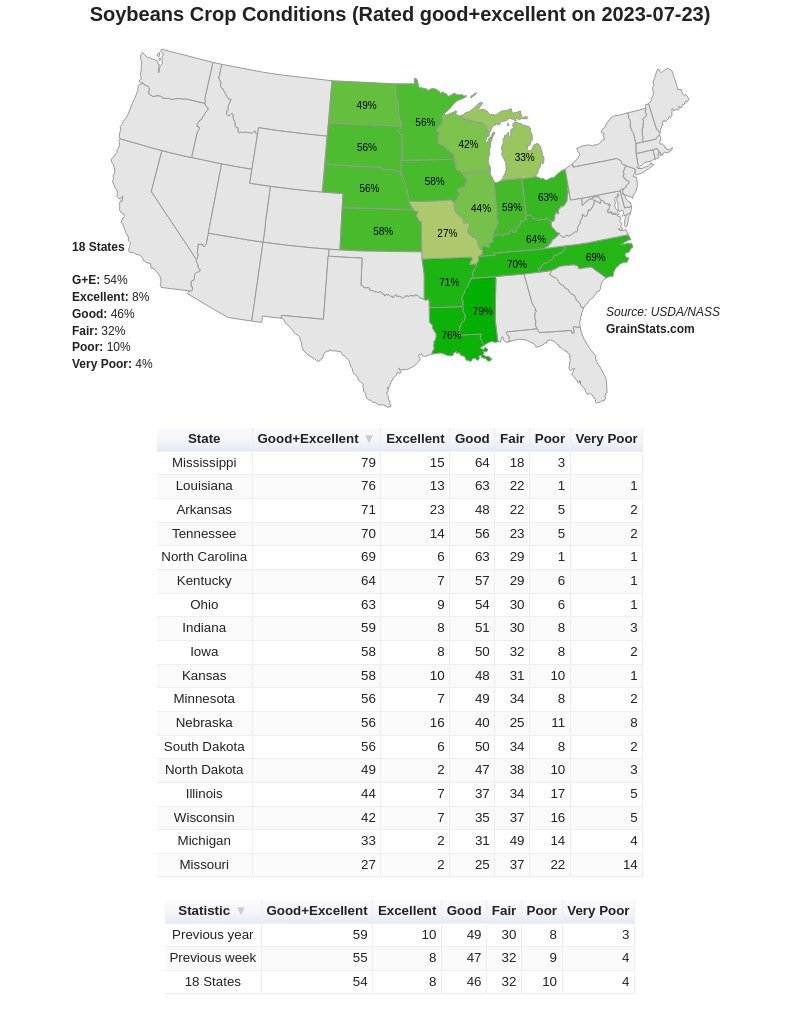
#Soybeans declined 1 pt to 54% good/excellent despite expectations for steady. Many of the same offsetting state changes as in corn. Illinois beans are 44% good/exc, off from the low of 25% four weeks ago.
I'm predicting right now, 6 days before hand that crop ratings will be down next Monday with high confidence.
How much rain we end up getting will determine whether it's a couple % or more. Fortunately, the elevated CO2 is helping to protect the crops or they would be deteriorating much more.
https://www.marketforum.com/forum/reply_post/97569/


Latest weather on tallpine's thread:
https://www.marketforum.com/forum/topic/97585/#97586
Wheat getting hit hard which is pulling down the C and S more than the weather.
Cotton has rallied very "nicely" and coffee, having tested again today recent support, appears ready to breakout.
Latest on tallpine's thread:
These are the areas that need rain the most(in yellow and brown):


