Previous thread:
Natural Gas 5-4-23
53 responses |
https://www.marketforum.com/forum/topic/94944/
++++++++++
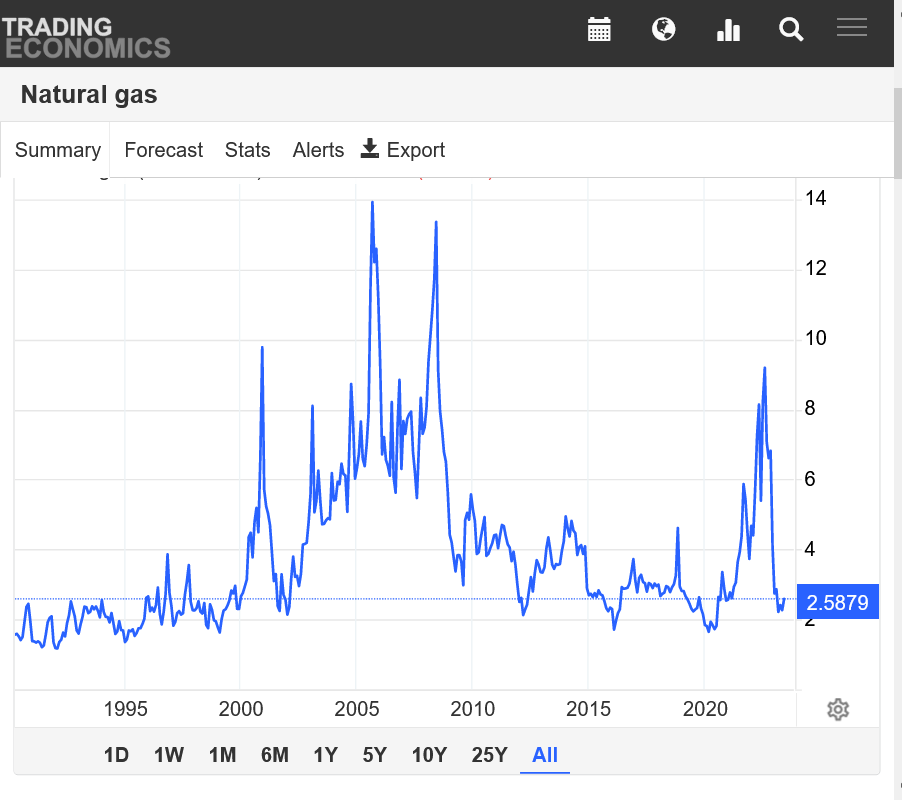
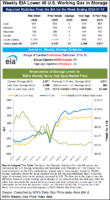
EIA report just out: BEARISH: +95 Bcf! Note the blue line on the graph below showing how much ng in storage this year compared to the last 5 years.
https://ir.eia.gov/ngs/ngs.html
![]()
for week ending June 16, 2023 | Released: June 22, 2023 at 10:30 a.m. | Next Release: June 29, 2023
| Working gas in underground storage, Lower 48 states Summary text CSV JSN | |||||||||||||||||||||||||
|---|---|---|---|---|---|---|---|---|---|---|---|---|---|---|---|---|---|---|---|---|---|---|---|---|---|
| Historical Comparisons | |||||||||||||||||||||||||
| Stocks billion cubic feet (Bcf) | Year ago (06/16/22) | 5-year average (2018-22) | |||||||||||||||||||||||
| Region | 06/16/23 | 06/09/23 | net change | implied flow | Bcf | % change | Bcf | % change | |||||||||||||||||
| East | 599 | 574 | 25 | 25 | 427 | 40.3 | 480 | 24.8 | |||||||||||||||||
| Midwest | 658 | 632 | 26 | 26 | 503 | 30.8 | 542 | 21.4 | |||||||||||||||||
| Mountain | 157 | 148 | 9 | 9 | 127 | 23.6 | 141 | 11.3 | |||||||||||||||||
| Pacific | 191 | 176 | 15 | 15 | 230 | -17.0 | 249 | -23.3 | |||||||||||||||||
| South Central | 1,125 | 1,105 | 20 | 20 | 873 | 28.9 | 954 | 17.9 | |||||||||||||||||
| Salt | 330 | 324 | 6 | 6 | 248 | 33.1 | 286 | 15.4 | |||||||||||||||||
| Nonsalt | 794 | 781 | 13 | 13 | 626 | 26.8 | 668 | 18.9 | |||||||||||||||||
| Total | 2,729 | 2,634 | 95 | 95 | 2,158 | 26.5 | 2,367 | 15.3 | |||||||||||||||||
Totals may not equal sum of components because of independent rounding. | |||||||||||||||||||||||||
Working gas in storage was 2,729 Bcf as of Friday, June 16, 2023, according to EIA estimates. This represents a net increase of 95 Bcf from the previous week. Stocks were 571 Bcf higher than last year at this time and 362 Bcf above the five-year average of 2,367 Bcf. At 2,729 Bcf, total working gas is within the five-year historical range.
For information on sampling error in this report, see Estimated Measures of Sampling Variability table below.

Natural gas futures clawed out a slim gain on Thursday after a government inventory report exceeded expectations and left supplies in storage at a hefty surplus to historic averages. Following a 10.5-cent rally in the prior session, the July Nymex gas futures contract on Thursday added a 1.1-cent day/day gain and settled at $2.608/MMBtu. August…
+++++++++++++
Above average CDDs and the market looking ahead at production easing because of low prices are 2 bullish items but much of the June rally has been predicated on that.
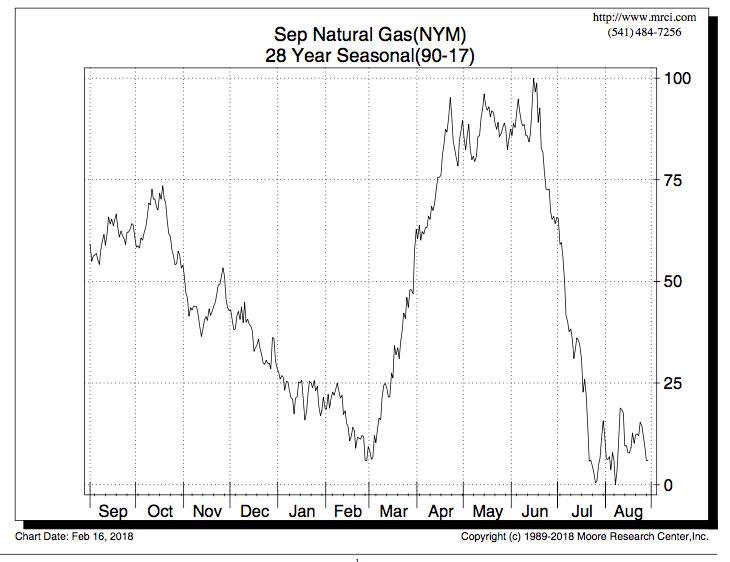
Seasonals turn strongly lower here but NG has NOT been following seasonals. Current ng in storage is very high and yesterday's EIA report was solidly BEARISH.
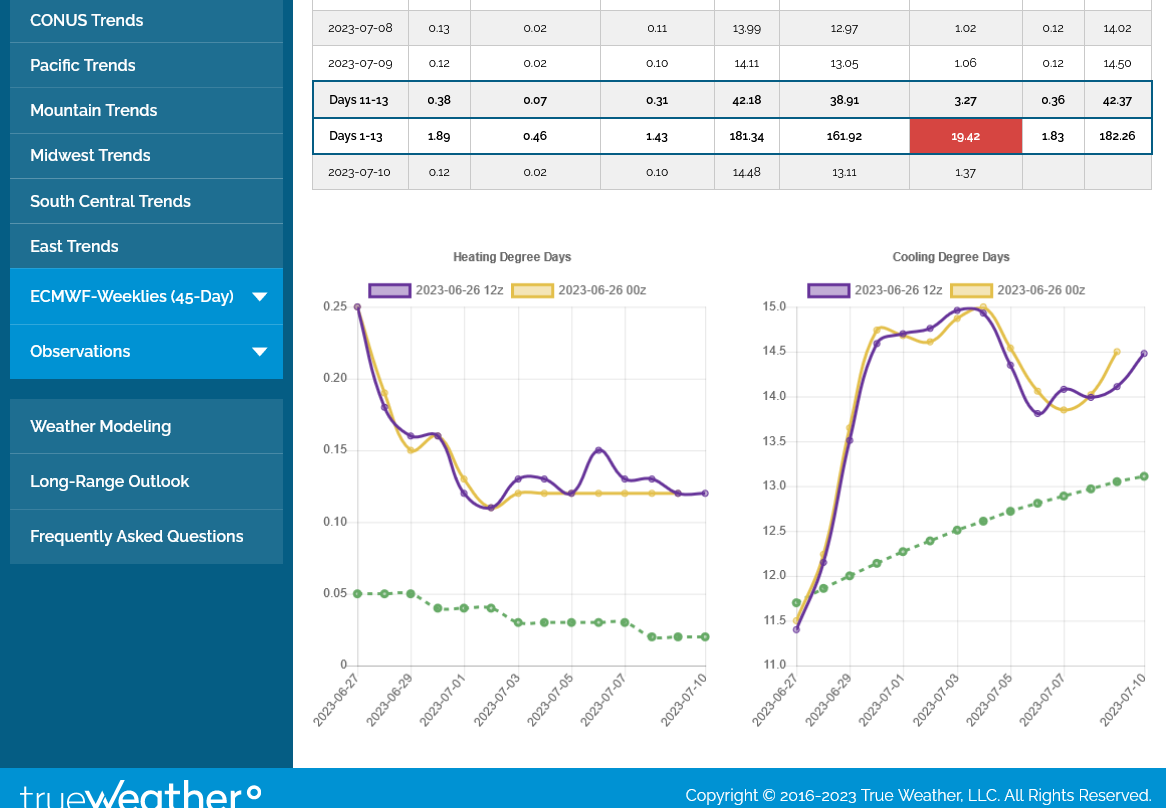
This was the last European Ensemble solution. CDDs +2 vs the previous run. The GEFS was -3 CDDs, so neutral weather vs previous model output:
Temps for this Thursday's EIA:
HOT in TX. Cool East. Cool West.
https://www.cpc.ncep.noaa.gov/products/tanal/temp_analyses.php
Natural gas futures eked out another gain – the fourth in a row – on Monday as robust cooling demand in Texas and surrounding states supported prices. With increased gas flowing south of the border into Mexico as well, the June Nymex gas futures contract edged up 6.2 cents to $2.791/MMBtu. At A Glance: Cooling…
++++++++
12z GEFS was +4 CDDs 12z EE was -1 HDDS. Both are very warm vs average, around +20 CDDs above normal for the 2 week period.
Closed out long yesterday before the close. Will look to re-enter on a fib retracement.
Great trade tjc!
Front month, July is expiring, so that means potential for unexpected spikes.
+76 Bcf must have been BULLISH because the market spiked up $800/contract on the release.
https://ir.eia.gov/ngs/ngs.html
![]()
for week ending June 23, 2023 | Released: June 29, 2023 at 10:30 a.m. | Next Release: July 7, 2023
| Working gas in underground storage, Lower 48 states Summary text CSV JSN | |||||||||||||||||||||||||
|---|---|---|---|---|---|---|---|---|---|---|---|---|---|---|---|---|---|---|---|---|---|---|---|---|---|
| Historical Comparisons | |||||||||||||||||||||||||
| Stocks billion cubic feet (Bcf) | Year ago (06/23/22) | 5-year average (2018-22) | |||||||||||||||||||||||
| Region | 06/23/23 | 06/16/23 | net change | implied flow | Bcf | % change | Bcf | % change | |||||||||||||||||
| East | 623 | 599 | 24 | 24 | 457 | 36.3 | 507 | 22.9 | |||||||||||||||||
| Midwest | 685 | 658 | 27 | 27 | 531 | 29.0 | 570 | 20.2 | |||||||||||||||||
| Mountain | 165 | 157 | 8 | 8 | 133 | 24.1 | 147 | 12.2 | |||||||||||||||||
| Pacific | 204 | 191 | 13 | 13 | 234 | -12.8 | 256 | -20.3 | |||||||||||||||||
| South Central | 1,128 | 1,125 | 3 | 3 | 884 | 27.6 | 967 | 16.6 | |||||||||||||||||
| Salt | 330 | 330 | 0 | 0 | 243 | 35.8 | 284 | 16.2 | |||||||||||||||||
| Nonsalt | 798 | 794 | 4 | 4 | 642 | 24.3 | 683 | 16.8 | |||||||||||||||||
| Total | 2,805 | 2,729 | 76 | 76 | 2,239 | 25.3 | 2,447 | 14.6 | |||||||||||||||||
Totals may not equal sum of components because of independent rounding. | |||||||||||||||||||||||||
Working gas in storage was 2,805 Bcf as of Friday, June 23, 2023, according to EIA estimates. This represents a net increase of 76 Bcf from the previous week. Stocks were 566 Bcf higher than last year at this time and 358 Bcf above the five-year average of 2,447 Bcf. At 2,805 Bcf, total working gas is within the five-year historical range.
For information on sampling error in this report, see Estimated Measures of Sampling Variability table below.
++++++++++
We gave up a lot of the EIA spike gains but that met some good buying and are now +600/contract for the day.
7 day temps for this weeks EIA report:
HOT in TX. Cool Southwest/East. Very Warm Northwest/Northeast. Pretty unusual temp configuration.
https://www.cpc.ncep.noaa.gov/products/tanal/temp_analyses.php
Natural gas futures advanced in early trading Tuesday, spurred on by continued heat in the latest forecasts and by signs of retreating production volumes. Coming off an 8.7-cent rally in the previous session, the August Nymex contract was up 3.2 cents to $2.701/MMBtu at around 8:40 a.m. ET. The weather data trended warmer overnight, with…
+++++++++++++++++++++++
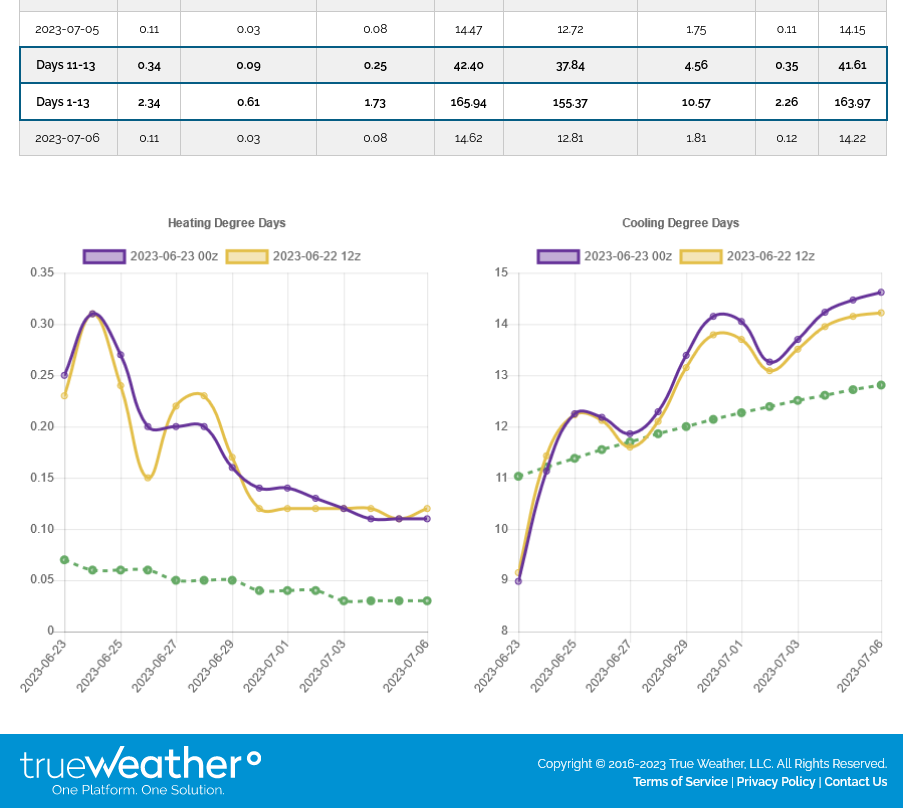
Got some widespread heat coming up but NOT in the Northeast/Midwest during the 2 week period. This is 2 weeks below. What will the dome in the Southwest to TX do in week 3?
European ensemble below. 0z solution.
1. Huge Upper level dome in the SouthWest to TX but the Midwest is enjoying active, Northwest flow coming down the east side of the dome at 2 weeks. If the dome shifts farther north or northeast, then it becomes bullish in late July. The market may be concerned about this.
2. Huge CDDs from the heat. Right bottom graph
The EIA number this Thursday should be lower than recent reports. It was a holiday reporting period and the holiday was during the week, Larry might comment on that.
However, there was alot of heat where alot of people live and they were cranking up ACs using electricity generated at power plants the burn natural gas to generate that electricity.
https://www.cpc.ncep.noaa.gov/products/tanal/temp_analyses.php
Hey Mike,
Yes, the holiday will negate a decent portion of the increased net CDDs. Those increased CDDs are attributed to significantly warmer E US. TX was cooler but the net for the US is clearly warmer. Without seeing the Fri-Thu CDD numbers themselves, which I don't have access to right now, I'm guessing that the increased net CDDs will more than negate the holiday effect. Thus, my guess is that this week's report will have a somewhat lower injection vs the prior report.
Thanks much, Larry!
0z EE a whopping -7 CDDs. Bottom right purple line. GEFS not that much change.
Amid signs of weak underlying fundamentals, and with forecasts advertising more moderate summer temperatures for population centers in the Midwest and East, natural gas futures gave back some of their recent gains in early trading Wednesday. The August Nymex contract was off 4.5 cents to $2.686/MMBtu at around 8:40 a.m. ET. Even after posting back-to-back…
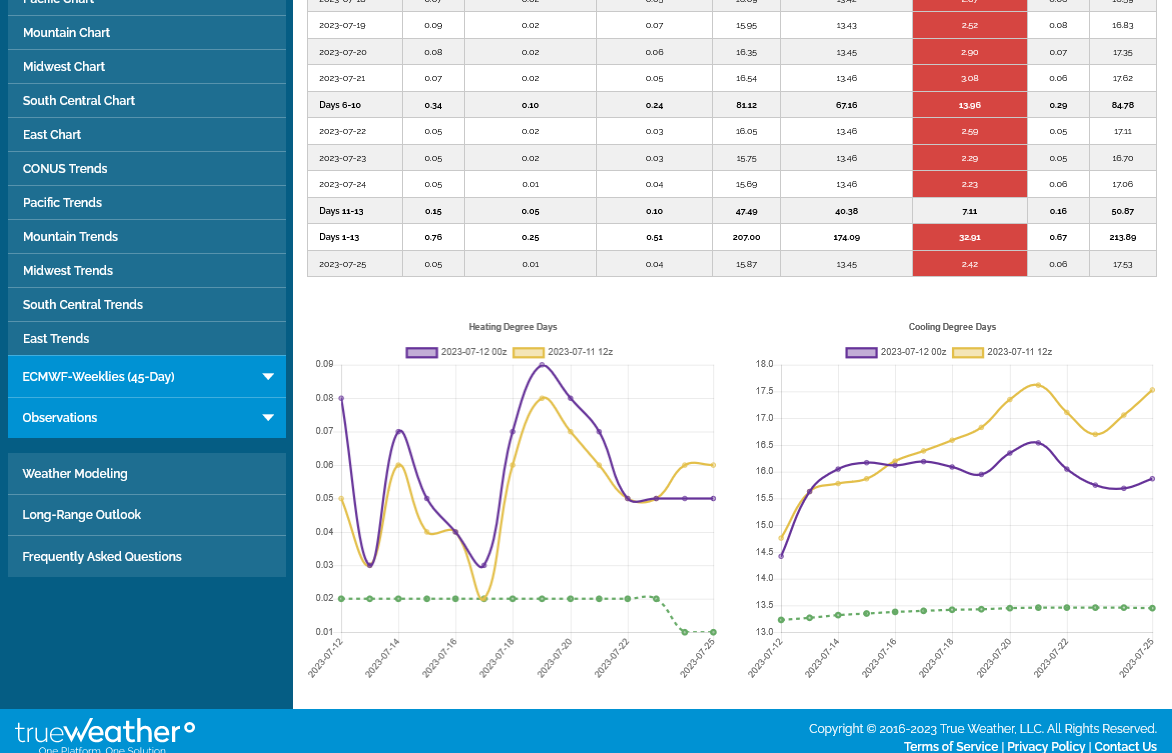
July 12, 2023
+++++++++
I just gave you the REAL reason that ng is -$850/contract here.
+++++++++++
EE added +2.5 HDDs which MAY have helped ng to bounce back a tad since then.
![]()
https://ir.eia.gov/ngs/ngs.html
for week ending July 7, 2023 | Released: July 13, 2023 at 10:30 a.m. | Next Release: July 20, 2023
+49 Bcf
| Working gas in underground storage, Lower 48 states Summary textCSVJSN | |||||||||||||||||||||||||
|---|---|---|---|---|---|---|---|---|---|---|---|---|---|---|---|---|---|---|---|---|---|---|---|---|---|
| Historical Comparisons | |||||||||||||||||||||||||
| Stocks billion cubic feet (Bcf) | Year ago (07/07/22) | 5-year average (2018-22) | |||||||||||||||||||||||
| Region | 07/07/23 | 06/30/23 | net change | implied flow | Bcf | % change | Bcf | % change | |||||||||||||||||
| East | 653 | 643 | 10 | 10 | 498 | 31.1 | 547 | 19.4 | |||||||||||||||||
| Midwest | 724 | 705 | 19 | 19 | 583 | 24.2 | 619 | 17.0 | |||||||||||||||||
| Mountain | 180 | 173 | 7 | 7 | 142 | 26.8 | 158 | 13.9 | |||||||||||||||||
| Pacific | 225 | 216 | 9 | 9 | 248 | -9.3 | 266 | -15.4 | |||||||||||||||||
| South Central | 1,147 | 1,144 | R | 3 | 3 | 890 | 28.9 | 976 | 17.5 | ||||||||||||||||
| Salt | 323 | 329 | R | -6 | -6 | 223 | 44.8 | 272 | 18.8 | ||||||||||||||||
| Nonsalt | 824 | 816 | 8 | 8 | 667 | 23.5 | 704 | 17.0 | |||||||||||||||||
| Total | 2,930 | 2,881 | R | 49 | 49 | 2,361 | 24.1 | 2,566 | 14.2 | ||||||||||||||||
| R=Revised. The reported revision caused the stocks for June 30, 2023 to change from 2,877 Bcf to 2,881 Bcf. As a result, the implied net change between the weeks ending June 23 and June 30 changed from 72 Bcf to 76 Bcf. Totals may not equal sum of components because of independent rounding. | |||||||||||||||||||||||||
Working gas in storage was 2,930 Bcf as of Friday, July 7, 2023, according to EIA estimates. This represents a net increase of 49 Bcf from the previous week. Stocks were 569 Bcf higher than last year at this time and 364 Bcf above the five-year average of 2,566 Bcf. At 2,930 Bcf, total working gas is within the five-year historical range.
For information on sampling error in this report, see Estimated Measures of Sampling Variability table below.
+++++++++++++
Market is down, EE was -6 CDDs over night. Right bottom purple line. 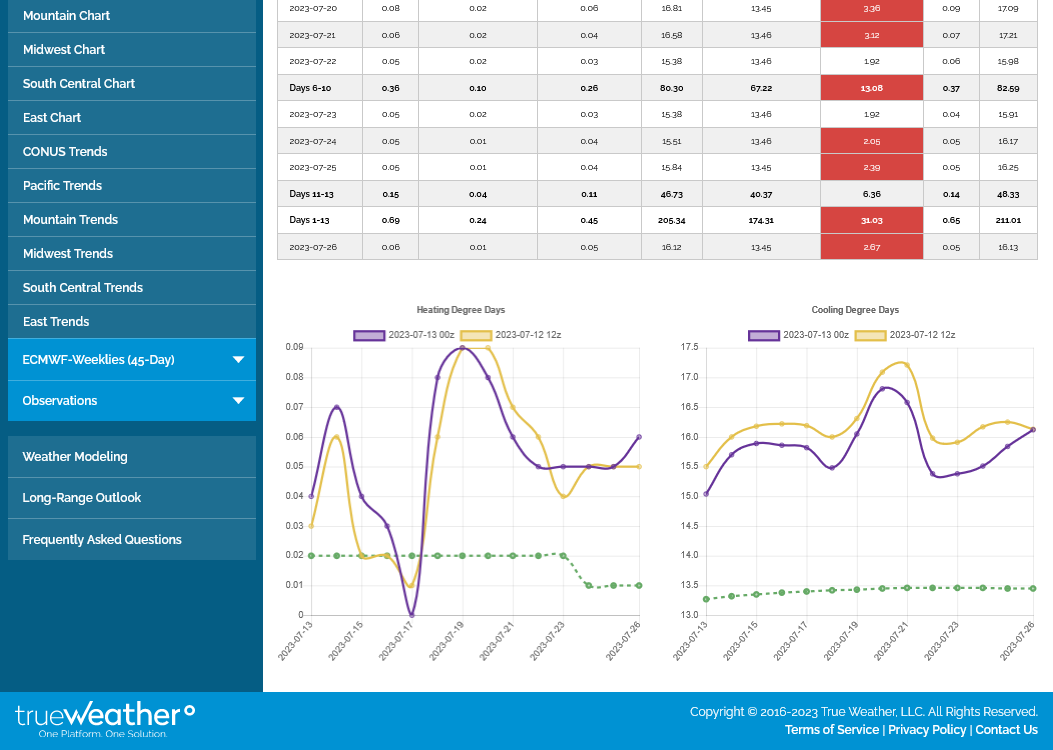
Natural gas futures rallied in early trading Tuesday as updated forecasts ratcheted up cooling demand expectations, though analysts continued to characterize the underlying fundamental outlook as bearish. The August Nymex contract was up 6.3 cents to $2.575/MMBtu at around 8:30 a.m. ET. Weather models trended hotter overnight, including a “hefty” 9 cooling degree day increase…
+++++++++++++++++
Euro Ensemble was +2 CDDs overnight. Purple line on the right.
Natural gas futures flourished for the first time in five sessions on Tuesday, mounting momentum alongside lofty temperatures and hints of lighter production. Coming off a four-day slump, the August Nymex gas futures contract settled at $2.629/MMBtu, up 11.7 cents day/day. September advanced 11.4 cents to $2.618. NGI’s Spot Gas National Avg. shed 3.0 cents
+++++++++++++
Temps for Thursday's EIA report. Close to equal amounts of the country with above and below temps.
With searing summer heat building in updated forecasts, natural gas futures probed higher early Thursday ahead of the release of the latest weekly government inventory data. The August Nymex contract was up 9.7 cents to $2.700/MMBtu at around 8:40 a.m. ET. EBW Analytics Group in a note to clients early Thursday highlighted continued “slow-but-steady” gains…
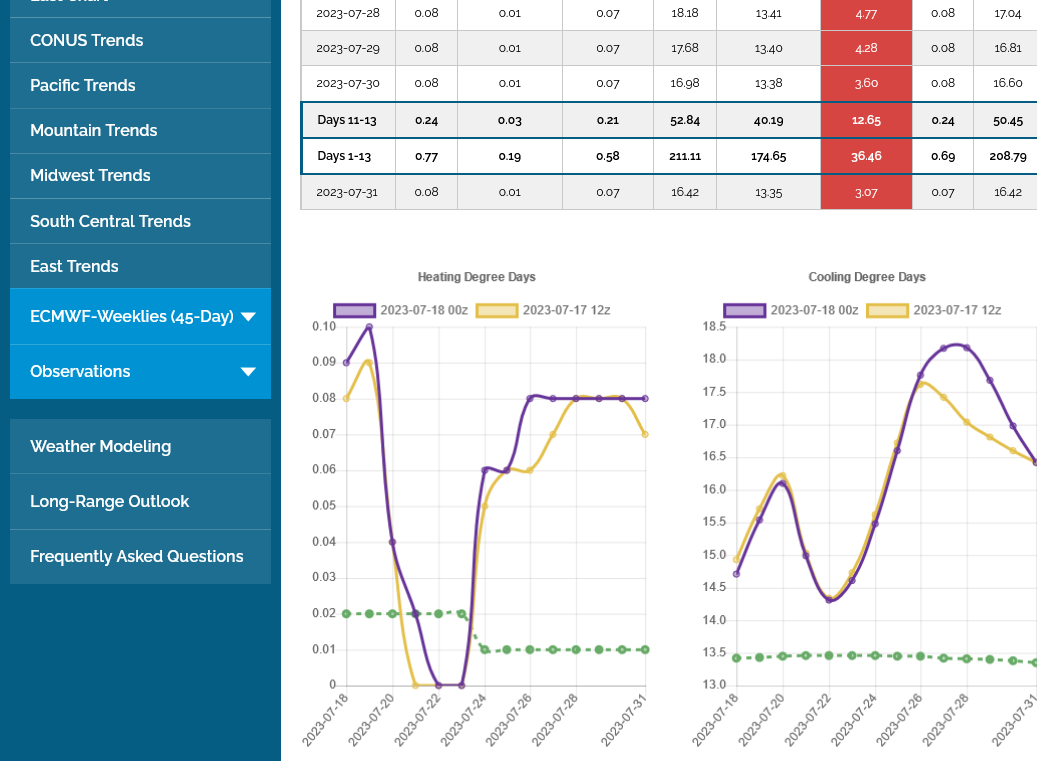
++++++++++++++++++
The 0Z EE was +3 CDDs. Purple line on right side graph. +++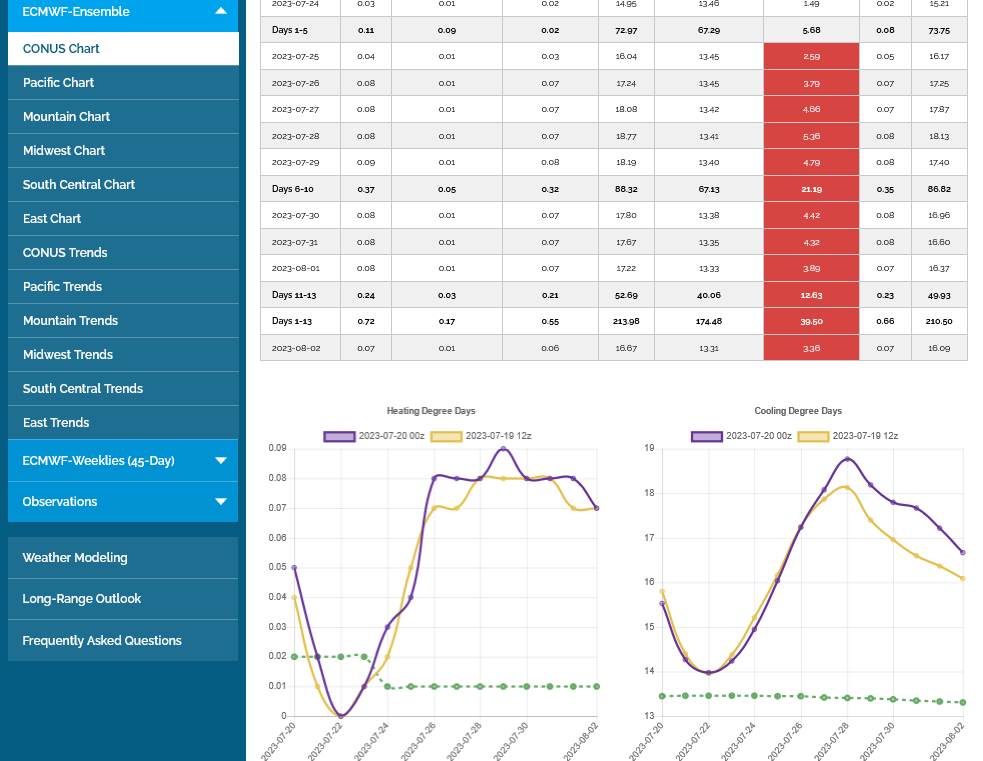 +++++++++++++++++++
![]()
for week ending July 14, 2023 | Released: July 20, 2023 at 10:30 a.m. | Next Release: July 27, 2023
| Working gas in underground storage, Lower 48 states Summary text CSV JSN | |||||||||||||||||||||||||
|---|---|---|---|---|---|---|---|---|---|---|---|---|---|---|---|---|---|---|---|---|---|---|---|---|---|
| Historical Comparisons | |||||||||||||||||||||||||
| Stocks billion cubic feet (Bcf) | Year ago (07/14/22) | 5-year average (2018-22) | |||||||||||||||||||||||
| Region | 07/14/23 | 07/07/23 | net change | implied flow | Bcf | % change | Bcf | % change | |||||||||||||||||
| East | 661 | 653 | 8 | 8 | 518 | 27.6 | 567 | 16.6 | |||||||||||||||||
| Midwest | 741 | 724 | 17 | 17 | 605 | 22.5 | 642 | 15.4 | |||||||||||||||||
| Mountain | 186 | 180 | 6 | 6 | 144 | 29.2 | 161 | 15.5 | |||||||||||||||||
| Pacific | 232 | 225 | 7 | 7 | 252 | -7.9 | 268 | -13.4 | |||||||||||||||||
| South Central | 1,150 | 1,147 | 3 | 3 | 876 | 31.3 | 972 | 18.3 | |||||||||||||||||
| Salt | 321 | 323 | -2 | -2 | 208 | 54.3 | 262 | 22.5 | |||||||||||||||||
| Nonsalt | 829 | 824 | 5 | 5 | 669 | 23.9 | 710 | 16.8 | |||||||||||||||||
| Total | 2,971 | 2,930 | 41 | 41 | 2,396 | 24.0 | 2,611 | 13.8 | |||||||||||||||||
Totals may not equal sum of components because of independent rounding. | |||||||||||||||||||||||||
Working gas in storage was 2,971 Bcf as of Friday, July 14, 2023, according to EIA estimates. This represents a net increase of 41 Bcf from the previous week. Stocks were 575 Bcf higher than last year at this time and 360 Bcf above the five-year average of 2,611 Bcf. At 2,971 Bcf, total working gas is within the five-year historical range.
For information on sampling error in this report, see Estimated Measures of Sampling Variability table below.
Story of the day
++++++++++++++
The 12z EE was -4 CDDs which caused the natural gas to correct slightly in the afternoon.
+++++++++++
That fell apart this morning. The front month August will be expiring next week. September volume is now more than August volume.
These are the temps from last week for this Thursday's EIA report.
Last week was bullish.
https://www.cpc.ncep.noaa.gov/products/tanal/temp_analyses.php
![]()
https://ir.eia.gov/ngs/ngs.html
for week ending July 21, 2023 | Released: July 27, 2023 at 10:30 a.m. | Next Release: August 3, 2023
| Working gas in underground storage, Lower 48 states Summary text CSV JSN | |||||||||||||||||||||||||
|---|---|---|---|---|---|---|---|---|---|---|---|---|---|---|---|---|---|---|---|---|---|---|---|---|---|
| Historical Comparisons | |||||||||||||||||||||||||
| Stocks billion cubic feet (Bcf) | Year ago (07/21/22) | 5-year average (2018-22) | |||||||||||||||||||||||
| Region | 07/21/23 | 07/14/23 | net change | implied flow | Bcf | % change | Bcf | % change | |||||||||||||||||
| East | 670 | 661 | 9 | 9 | 530 | 26.4 | 584 | 14.7 | |||||||||||||||||
| Midwest | 757 | 741 | 16 | 16 | 623 | 21.5 | 663 | 14.2 | |||||||||||||||||
| Mountain | 189 | 186 | 3 | 3 | 144 | 31.3 | 164 | 15.2 | |||||||||||||||||
| Pacific | 232 | 232 | 0 | 0 | 253 | -8.3 | 267 | -13.1 | |||||||||||||||||
| South Central | 1,139 | 1,150 | -11 | -11 | 864 | 31.8 | 964 | 18.2 | |||||||||||||||||
| Salt | 310 | 321 | -11 | -11 | 197 | 57.4 | 251 | 23.5 | |||||||||||||||||
| Nonsalt | 829 | 829 | 0 | 0 | 667 | 24.3 | 714 | 16.1 | |||||||||||||||||
| Total | 2,987 | 2,971 | 16 | 16 | 2,414 | 23.7 | 2,642 | 13.1 | |||||||||||||||||
Totals may not equal sum of components because of independent rounding. | |||||||||||||||||||||||||
Working gas in storage was 2,987 Bcf as of Friday, July 21, 2023, according to EIA estimates. This represents a net increase of 16 Bcf from the previous week. Stocks were 573 Bcf higher than last year at this time and 345 Bcf above the five-year average of 2,642 Bcf. At 2,987 Bcf, total working gas is within the five-year historical range.
For information on sampling error in this report, see Estimated Measures of Sampling Variability table below.
Utilities injected 16 Bcf of natural gas into storage for the week ended July 21, government data released Thursday showed. The U.S. Energy Information Administration (EIA) print modestly exceeded expectations, keeping supplies stout and applying pressure on Nymex natural gas futures. Ahead of the 10:30 a.m. ET report, the August futures contract was down 5.0…
+++++++++++++
That's a pretty skinny injection but the market must have expected that or even less because the sellers have been crushing ng lower since that time. Buy the rumor, sell the fact! Front month August expires today, and that's a factor. Note the blue line above, is still close to the top of the 5 year average in light gray, though it's lost a bit of ground from this recent heat.
However the most bearish element is the MUCH cooler weather coming to the Northeast and Midwest, starting this weekend and lasting thru the rest of the 2 week forecast.
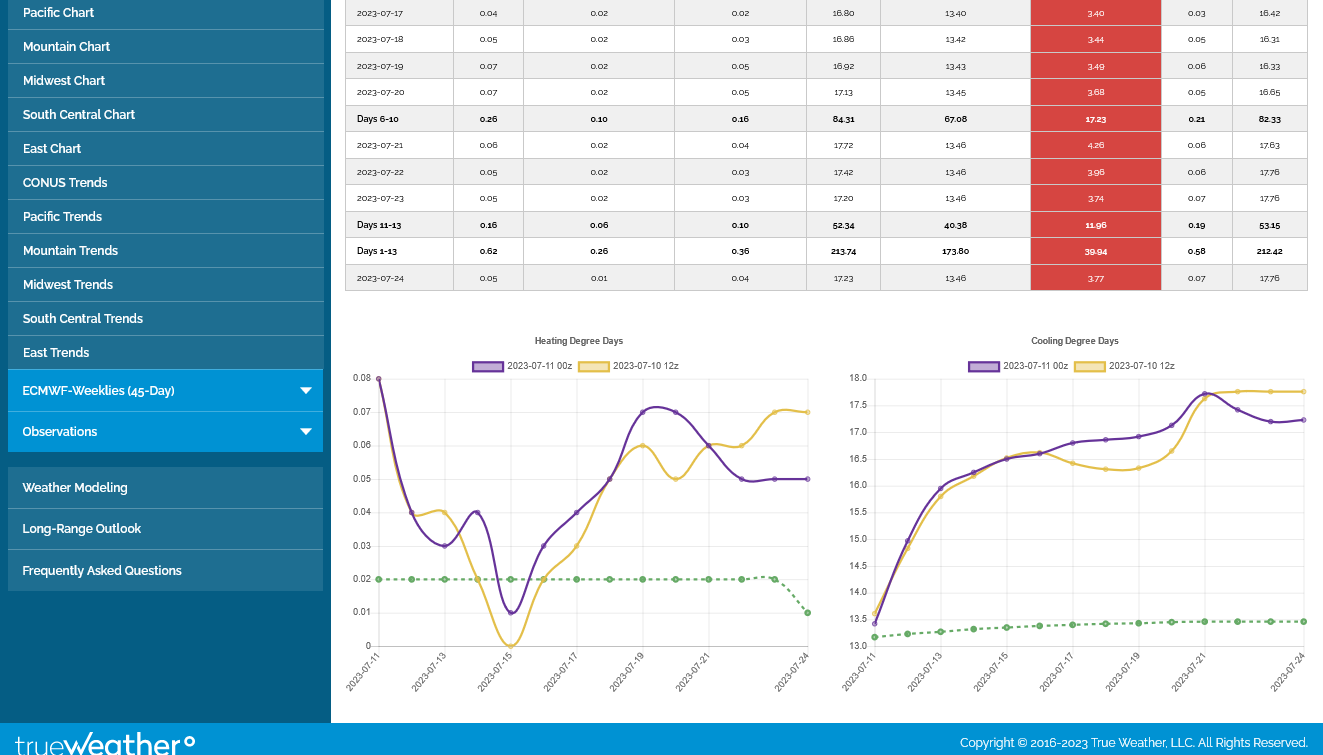
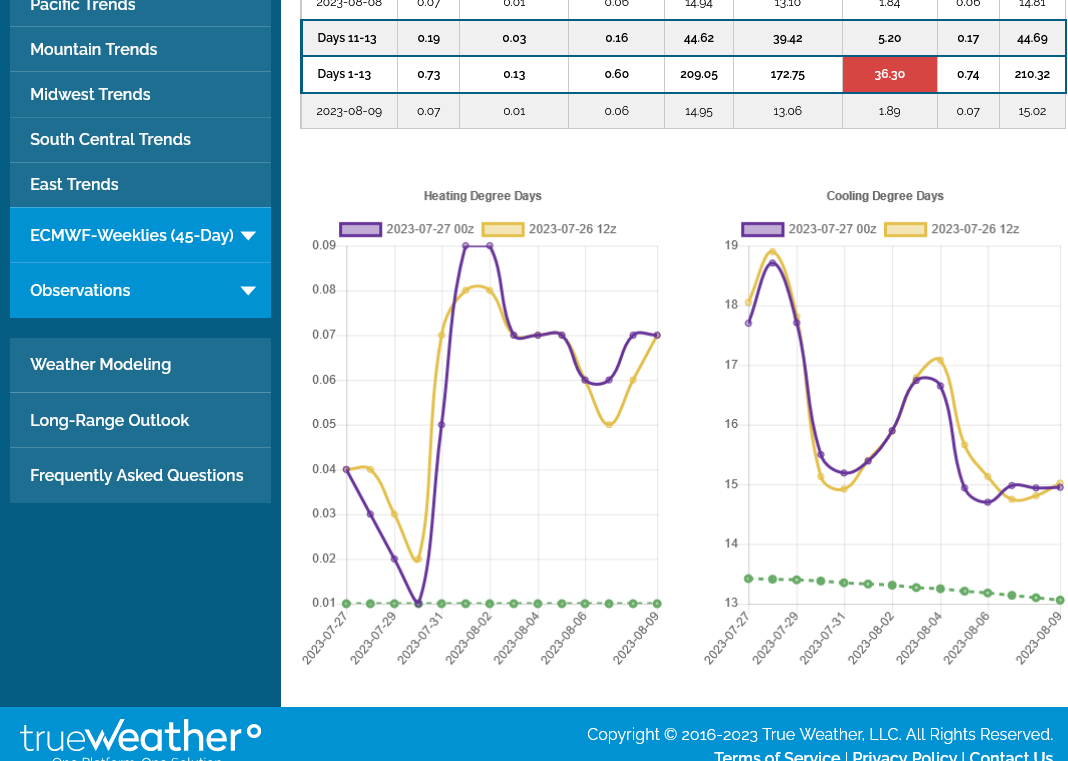
Right side of the graphs below are CDDs from the last 2 European Ensembles models. The purple is always the last one(0z) in this case, which is the last of the global models to come out, mostly done by just after 2am and 2pm each day.
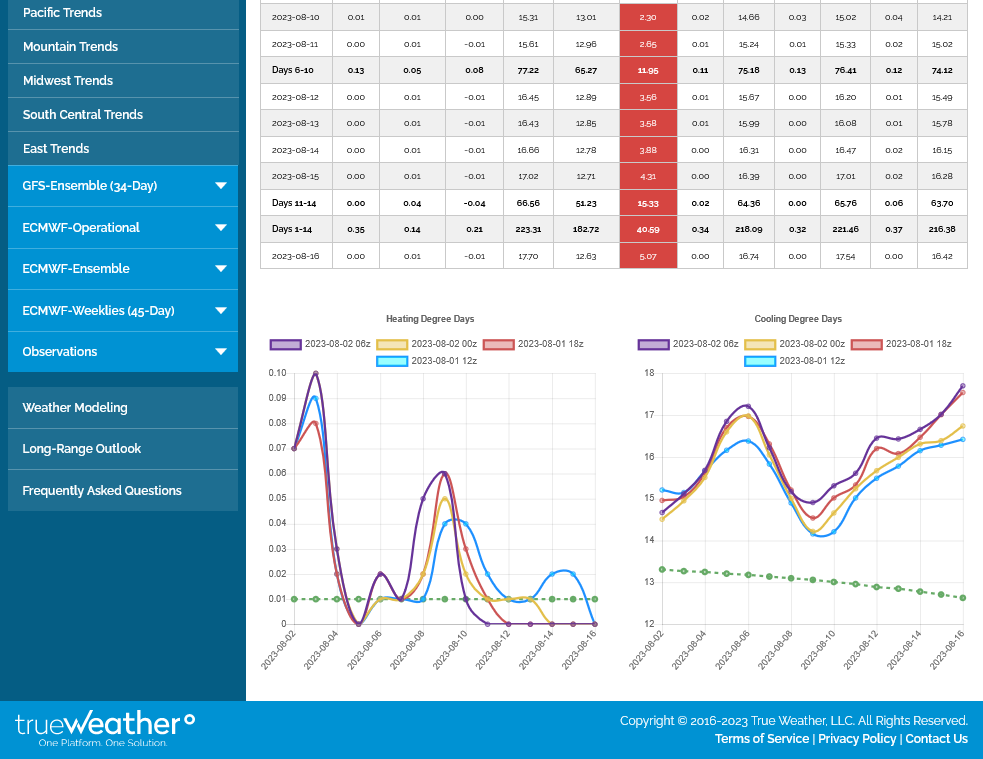
NG has bounced higher here since our late morning lows, likely because of one of the biggest changes in the GEFS for this time of year that I remember.
CDDs are actually -6 CDDs, which should be pretty bearish but at the end of the period, the deep, cooling trough in the East has been replaced by an extension of the heat ridge.
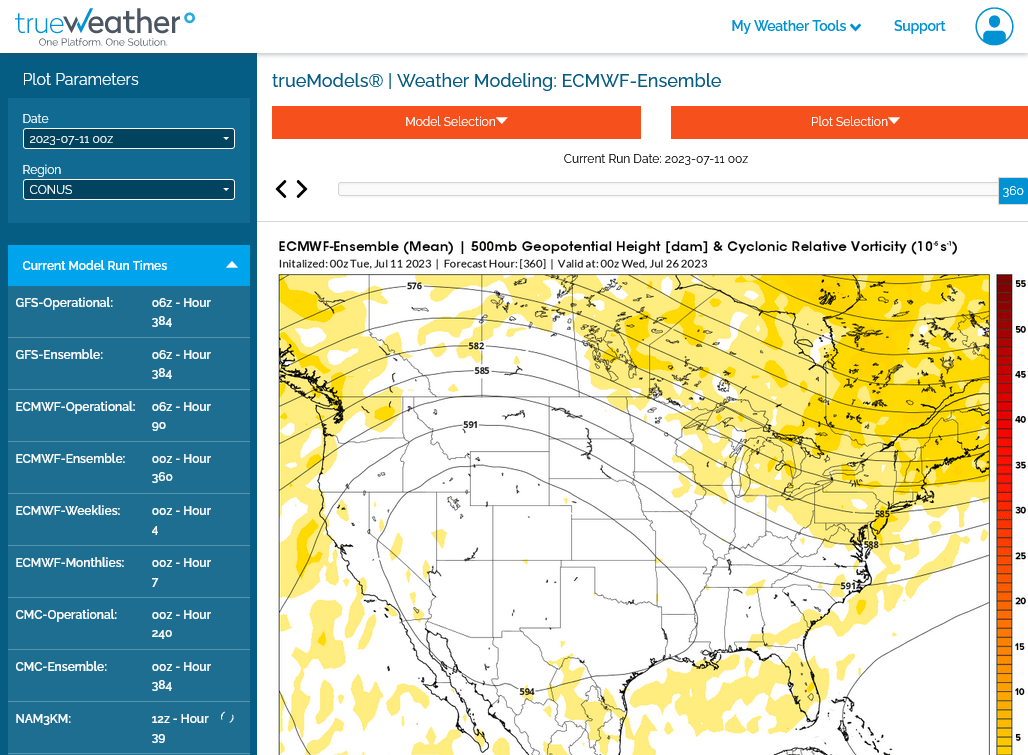
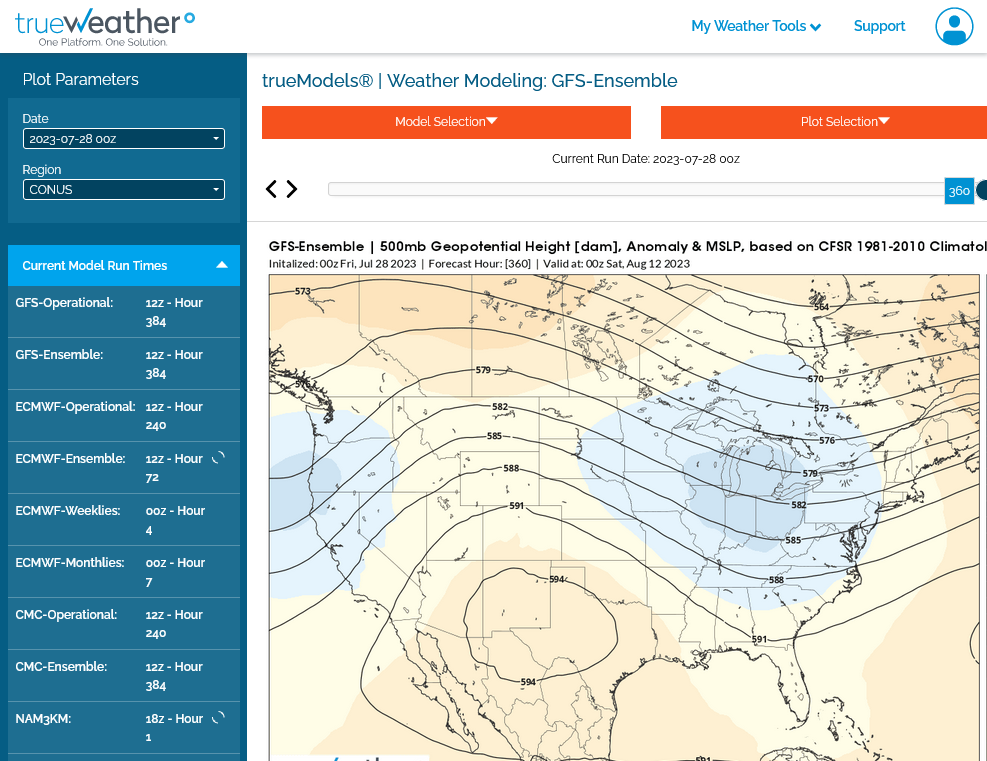
1. 0z run 12 hours earlier
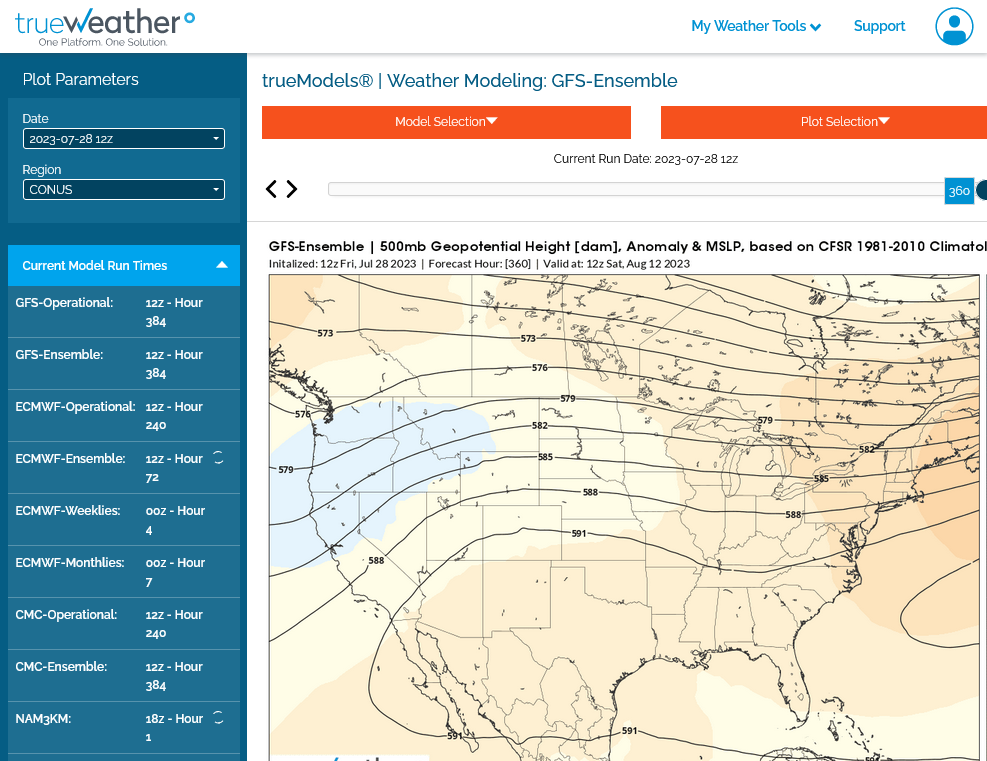
2. Latest 12z run
If this is the right trend, the middle of August is going to turn pretty hot across much of the country. Cool in the Northwest.
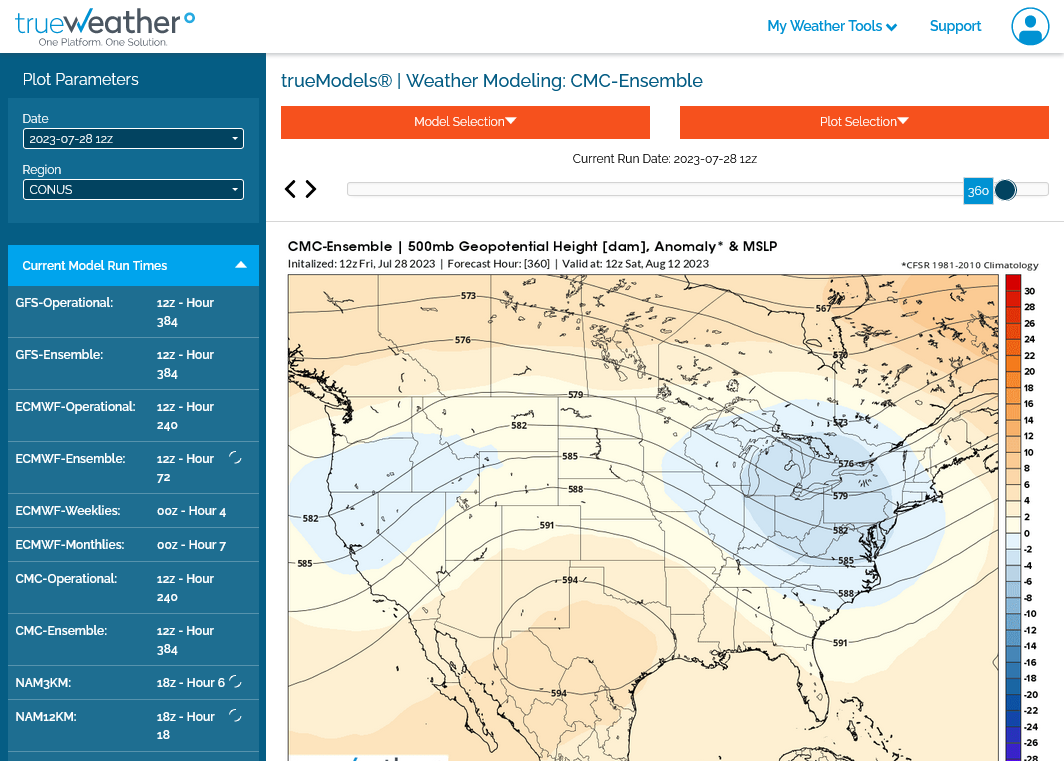
3. Latest 12z Canadian model still likes the trough there
As updated forecasts continued to advertise more moderate summer temperatures over key markets in the Lower 48’s northern half, natural gas futures retreated in early trading Wednesday. The September Nymex contract was down 4.9 cents to $2.511/MMBtu at around 8:45 a.m. ET. The American and European models both showed minor cooling degree day gains overnight…
++++++++++++
The 0z European model actually showed +1 CDD! Purple line bottom/right.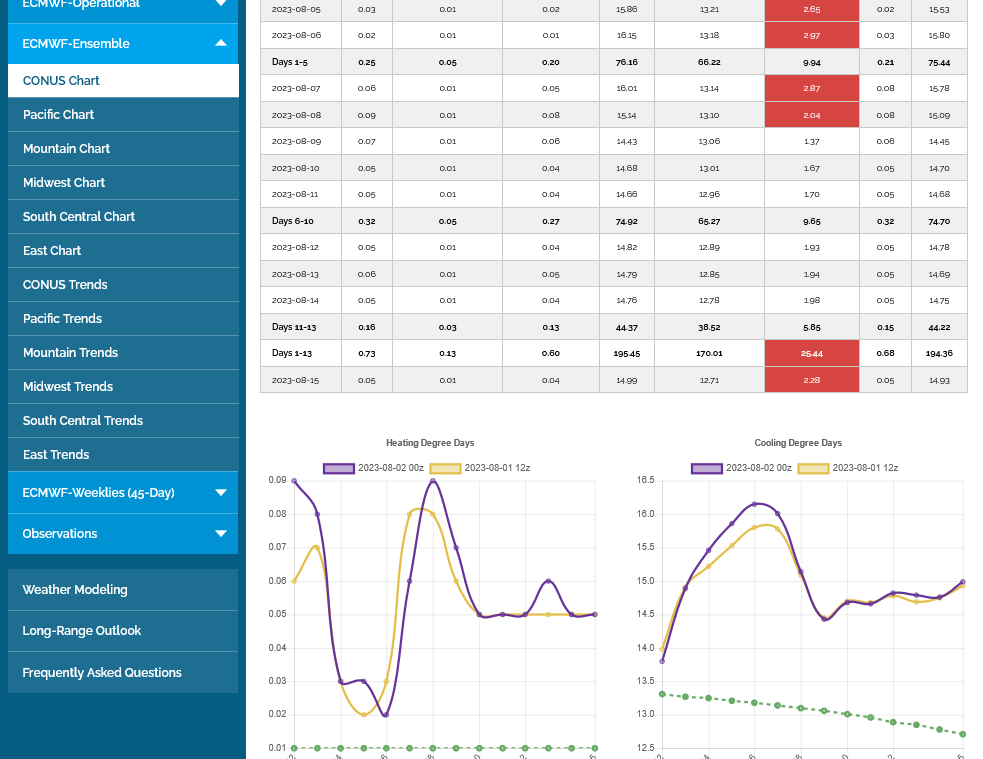
The last 6z GEFS was actually +5 CDDs WARMER!
Purple line bottom right.
Widespread heat last week caused a small injection earlier this morning.
https://www.cpc.ncep.noaa.gov/products/tanal/temp_analyses.php
+++++++++
The blue line below on the chart is dropping down a tiny bit vs the 5 year range. However, supplies are still ROBBUST!
![]()
for week ending July 28, 2023 | Released: August 3, 2023 at 10:30 a.m. | Next Release: August 10, 2023
| Working gas in underground storage, Lower 48 states Summary text CSV JSN | |||||||||||||||||||||||||
|---|---|---|---|---|---|---|---|---|---|---|---|---|---|---|---|---|---|---|---|---|---|---|---|---|---|
| Historical Comparisons | |||||||||||||||||||||||||
| Stocks billion cubic feet (Bcf) | Year ago (07/28/22) | 5-year average (2018-22) | |||||||||||||||||||||||
| Region | 07/28/23 | 07/21/23 | net change | implied flow | Bcf | % change | Bcf | % change | |||||||||||||||||
| East | 680 | 670 | 10 | 10 | 547 | 24.3 | 603 | 12.8 | |||||||||||||||||
| Midwest | 775 | 757 | 18 | 18 | 640 | 21.1 | 684 | 13.3 | |||||||||||||||||
| Mountain | 191 | 189 | 2 | 2 | 147 | 29.9 | 167 | 14.4 | |||||||||||||||||
| Pacific | 230 | 232 | -2 | -2 | 253 | -9.1 | 266 | -13.5 | |||||||||||||||||
| South Central | 1,124 | 1,139 | -15 | -15 | 865 | 29.9 | 961 | 17.0 | |||||||||||||||||
| Salt | 297 | 310 | -13 | -13 | 195 | 52.3 | 244 | 21.7 | |||||||||||||||||
| Nonsalt | 828 | 829 | -1 | -1 | 670 | 23.6 | 717 | 15.5 | |||||||||||||||||
| Total | 3,001 | 2,987 | 14 | 14 | 2,451 | 22.4 | 2,679 | 12.0 | |||||||||||||||||
Totals may not equal sum of components because of independent rounding. | |||||||||||||||||||||||||
Working gas in storage was 3,001 Bcf as of Friday, July 28, 2023, according to EIA estimates. This represents a net increase of 14 Bcf from the previous week. Stocks were 550 Bcf higher than last year at this time and 322 Bcf above the five-year average of 2,679 Bcf. At 3,001 Bcf, total working gas is within the five-year historical range.
For information on sampling error in this report, see Estimated Measures of Sampling Variability table below.
+++++++++
The Energy Information Administration (EIA) reported a smaller-than-expected 14 Bcf injection into natural gas storage inventories for the week ending July 28, trimming surpluses and lending support to prices. Hotter trends in the latest weather forecasts lifted the September Nymex futures early. In the minutes leading up to the weekly EIA report, the prompt month…
++++++++++++
metmike: In addition, the EE was +5 CDDs overnight and crude is up $2+
The West, South and East will be seeing some hot weather the next 2 weeks(mild in the Northeast). This is bullish for natural gas prices because it increases demand for electricity to use in air conditioning that's generated by burning natural gas.
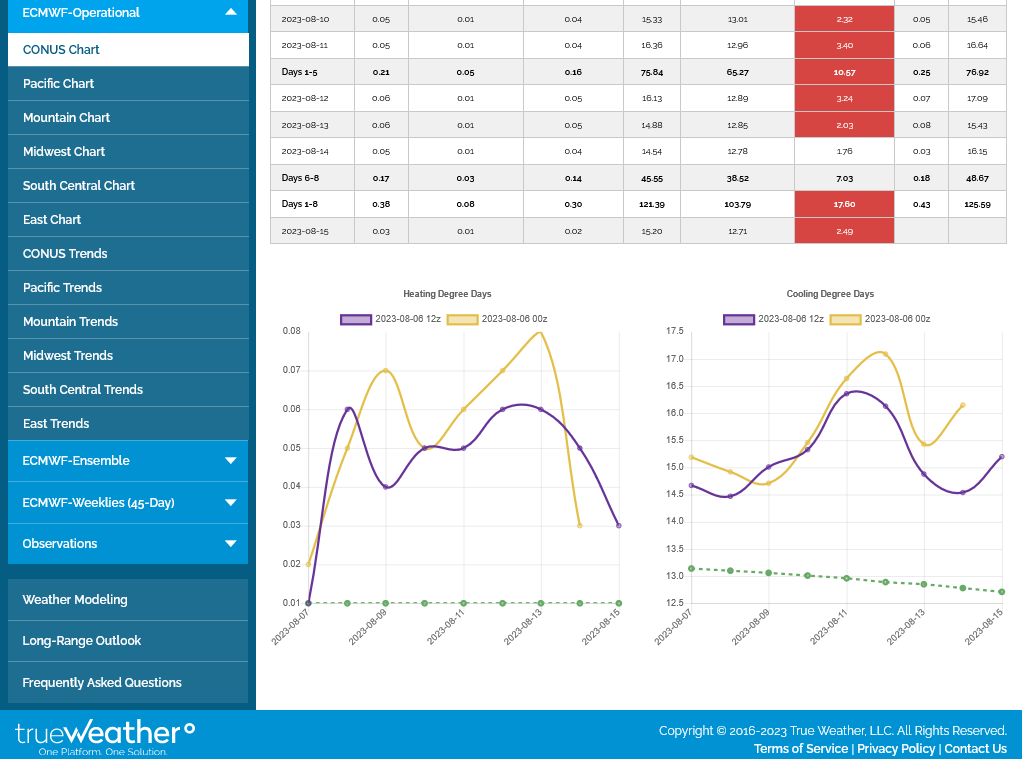
Despite the last EE being -1 CDDs(purple line on the right graph below, the pattern features well above average CDDs the next 2 weeks.
++++++++++++++
Last weeks temps for this Thursday's EIA. HOT in the middle/Plains/TX, mild in the East. Should be another smallish injection.
https://www.cpc.ncep.noaa.gov/products/tanal/temp_analyses.php