Monday, May 8, 2023
10:00 AM ET. April Employment Trends Index
ETI (previous 116.24)
ETI, Y/Y%
10:00 AM ET. March Monthly Wholesale Trade
Inventories, M/M% (previous +0.1%)
N/A ISM Semiannual Report On Business Economic Forecast
Tuesday, May 9, 2023
6:00 AM ET. April NFIB Index of Small Business Optimism
Small Business Idx (previous 90.1)
8:55 AM ET. Johnson Redbook Retail Sales Index
Ret Sales Mo-to-Date, Y/Y% (previous +1.4%)
Latest Wk, Y/Y% (previous +1.3%)
10:00 AM ET. May IBD/TIPP Economic Optimism Index
Economic Optimism Idx (previous 47.4)
6-Mo Economic Outlook (previous 41.6)
4:30 PM ET. API Weekly Statistical Bulletin
Crude Stocks, Net Chg (Bbls) (previous -3.9M)
Gasoline Stocks, Net Chg (Bbls) (previous +0.4M)
Distillate Stocks, Net Chg (Bbls) (previous -1.0M)
Wednesday, May 10, 2023
7:00 AM ET. MBA Weekly Mortgage Applications Survey
Composite Idx (previous 214.4)
Composite Idx, W/W% (previous -1.2%)
Purchase Idx-SA (previous 165.8)
Purchase Idx-SA, W/W% (previous -2.0%)
Refinance Idx (previous 461.2)
Refinance Idx, W/W% (previous +0.8%)
8:30 AM ET. April Real Earnings
8:30 AM ET. April CPI
CPI, M/M% (previous +0.1%)
Core CPI, M/M% (previous +0.4%)
Energy Idx, M/M% (previous -3.5%)
Food Idx, M/M% (previous +0.0%)
Real Avg Wkly Pay-Inflation Adj, M/M% (previous -0.1%)
CPI, Y/Y% (previous +5.0%)
Core Annual, Y/Y% (previous +5.6%)
10:00 AM ET. April Online Help Wanted Index
10:30 AM ET. EIA Weekly Petroleum Status Report
Crude Oil Stocks (Bbl) (previous 459.633M)
Crude Oil Stocks, Net Chg (Bbl) (previous -1.281M)
Gasoline Stocks (Bbl) (previous 222.878M)
Gasoline Stocks, Net Chg (Bbl) (previous +1.742M)
Distillate Stocks (Bbl) (previous 110.323M)
Distillate Stocks, Net Chg (Bbl) (previous -1.19M)
Refinery Usage (previous 90.7%)
Total Prod Supplied (Bbl/day) (previous 19.805M)
Total Prod Supplied, Net Chg (Bbl/day) (previous -0.403M)
Thursday, May 11, 2023
8:30 AM ET. Unemployment Insurance Weekly Claims Report - Initial Claims
Jobless Claims (previous 242K)
Jobless Claims, Net Chg (previous +13K)
Continuing Claims (previous 1805000)
Continuing Claims, Net Chg (previous -38K)
8:30 AM ET. April PPI
PPI, M/M% (previous -0.5%)
Ex-Food & Energy PPI, M/M% (previous -0.1%)
Personal Consumption (previous -0.4%)
8:30 AM ET. U.S. Weekly Export Sales
10:30 AM ET. EIA Weekly Natural Gas Storage Report
Working Gas In Storage (Cbf) (previous 2063B)
Working Gas In Storage, Net Chg (Cbf) (previous +54B)
4:30 PM ET. Foreign Central Bank Holdings
4:30 PM ET. Federal Discount Window Borrowings
Friday, May 12, 2023
8:30 AM ET. April Import & Export Price Indexes
Import Prices (previous -0.6%)
Non-Petroleum Prices (previous -0.6%)
Petroleum Prices (previous -1.2%)
10:00 AM ET. May University of Michigan Survey of Consumers - preliminary
Mid-Mo Sentiment (previous 63.5)
Mid-Mo Expectations (previous 60.3)
Mid-Mo Current Idx (previous 68.6)
12:00 PM ET. World Agricultural Supply & Demand Estimates (WASDE)
Corn, End Stocks (Bushels)
Soybeans, End Stocks (Bushels)
Wheat, End Stocks (Bushels)
Cotton, End Stocks (Bales)
Thanks tallpine!
We'll be especially watching for the USDA report on Friday.
Also the crop progress report on Monday.
The weather is looking dry-ish right now for some places but that will help planting to accelerate so its hard to know in May weather dry is bullish or bearish.
However, the amount of rain in #1 wheat producer KS is looking pretty skinny and is probably a supportive factor for the HRW wheat, which is up a bit more after the monster rally last week.
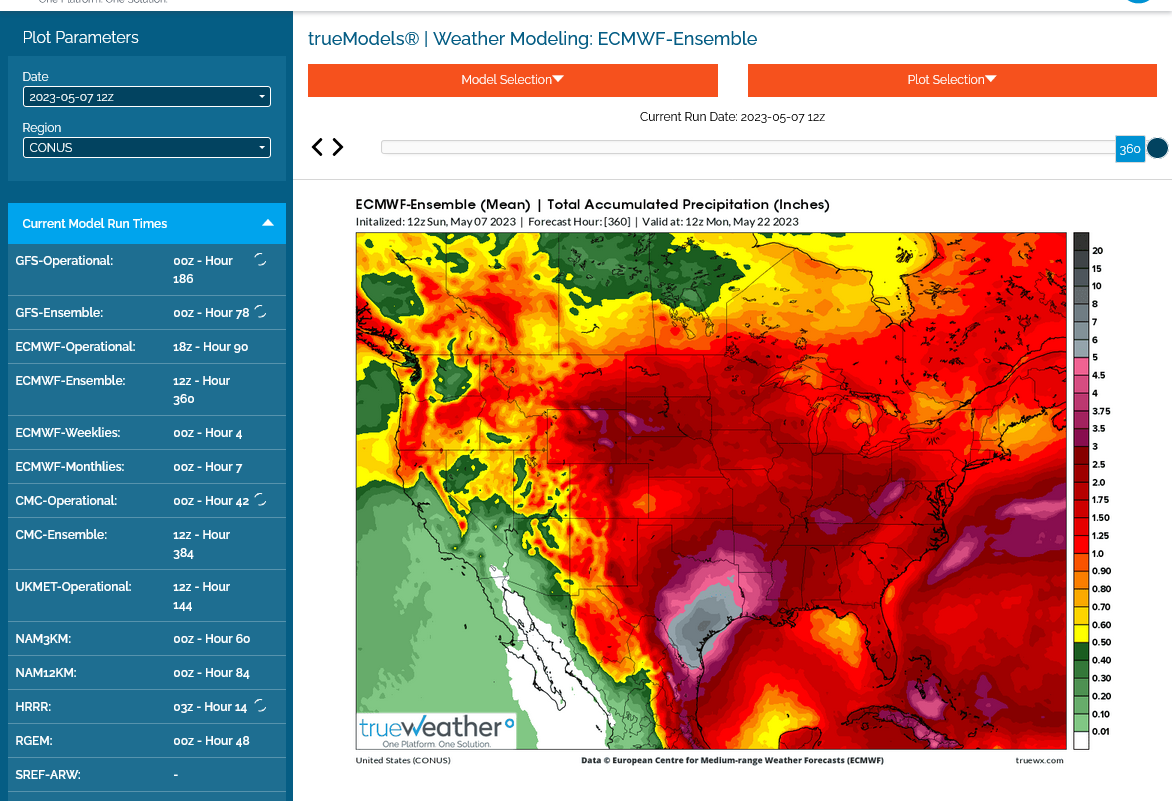
2 week rains below from the 12z European Ensemble model. Lots of areas less than 1 inch in the center. Pretty dry in KS.
7 Day Total precipitation below:
http://www.wpc.ncep.noaa.govcdx /qpf/p168i.gif?1530796126

Extended weather.
https://www.cpc.ncep.noaa.gov/products/predictions/610day/ | ||||||||
| 6 to 10 day outlooks | ||||||||
| Click below for information about how to read 6-10 day outlook maps Temperature Precipitation | ||||||||
| Click below for archives of past outlooks (data & graphics), historical analogs to todays forecast, and other formats of the 6-10 day outlooks ArchivesAnalogsLines-Only FormatGIS Data | ||||||||
Temperature Probability | ||||||||
Precipitation Probability | ||||||||
Soilmoisture anomaly:
These maps sometimes take a day to catch up to incorporate the latest data(the bottom map is only updated once a week).
https://www.cpc.ncep.noaa.gov/products/Soilmst_Monitoring/US/Soilmst/Soilmst.shtml#
![]()

All the weather

