KEY EVENTS TO WATCH FOR:
Friday, August 18, 2023
10:00 AM ET. 2nd Quarter Advance Quarterly Services
10:00 AM ET. July State Employment and Unemployment
The STOCK INDEXES? http://quotes.ino.com/ex?changes/?c=indexes
The STOCK INDEXES: The September NASDAQ 100 was lower overnight as it extends the decline off July's high. Overnight weakness sets the stage a lower opening when the day session begins trading. Stochastics and the RSI are oversold but remain neutral to bearish signaling that sideways to lower prices are possible near-term. If September extends the decline off July's high, the June 8th low crossing at 14,425.00 is the next downside target. Closes above the 20-day moving average crossing at 15,367.50 would temper the near-term bearish outlook. First resistance is the 20-day moving average crossing at 15,367.50. Second resistance is the July 17th high crossing at 15,917.00. First support is the 25% retracement level of the 2022-2023 rally crossing at 14,789.53. Second support is the June 8th low crossing at 14,425.00.
The September S&P 500 was steady to slightly lower overnight as it extends the decline off July's high. Overnight weakness sets the stage for a slightly lower opening when the day session begins trading. Stochastics and the RSI are oversold but remain neutral to bearish signaling that sideways to lower prices are possible near-term. If September extends the decline off July's high, the 38% retracement level of the March-July rally crossing at 4344.68 is the next downside target. Closes above the 20-day moving average crossing at 4518.46 would temper the bearish outlook. First resistance is the 20-day moving average crossing at 4518.46. Second resistance is July's high crossing at 4634.50. First support is the June 26th low crossing at 4368.50. Second support is the 38% retracement level of the March-July rally crossing at 4344.68.
INTEREST RATES http://quotes.ino.com/ex changes/?c=interest"
INTEREST RATES: September T-bonds were higher overnight as it consolidates some of the decline off April's high. Overnight trading sets the stage for a higher opening when the day session begins trading. Stochastics and the RSI are oversold but remain neutral to bearish signaling that sideways to lower prices are possible near-term. If September extends the decline off July's high, the October-2022 low on the weekly continuation chart crossing at 117-19 is the next downside target.Closes above the 20-day moving average crossing at 122-09 would signal that a low has been posted. First resistance is the 20-day moving average crossing at 122-09. Second resistance is the 50-day moving average crossing at 124-29. First support is Thursday's low crossing at 118-14. Second support is the October-2022 low on the weekly continuation chart crossing at 117-19.
September T-notes was higher overnight as it consolidates some of the decline off May's high. Overnight trading and sets the stage for a higher opening when the day session begins trading. Stochastics and the RSI are oversold, diverging and are neutral to bearish signaling that sideways to lower prices are possible near-term. If September extends the decline off July's high, the October-2022 low crossing at 108.265 is the next downside target. Closes above the 20-day moving average crossing at 110.257 would signal that a short-term low has been posted. First resistance is the 10-day moving average crossing at 110.109. Second resistance is the 20-day moving average crossing at 110.257. First support is Thursday's low crossing at 109.035. Second support is the October-2022 low on the weekly continuation chart crossing at 108.265.
ENERGY MARKETS? http://quotes.ino.com/ex?changes/?c=energy ""
ENERGIES:Octobercrude oil was slightly lower overnight as it consolidates below broken support marked by the 20-day moving average crossing at $80.70. Overnight trading sets the stage for a slightly lower opening when the day session begins trading. Stochastics and the RSI remain neutral to bearish signaling that sideways to lower prices are possible near-term. If October extends the decline off last-Thursday's high, the 38% retracement level of the May-August rally crossing at $76.68 is the next downside target. If October renews the rally off the June 28th low, the 75% retracement level of the 2022-2023 decline crossing at $87.70 is the next upside target. First resistance is last-Thursday's high crossing at $84.16. Second resistance is the 75% retracement level of the 2022-2023 decline crossing at $87.70. First support is the August 3rd low crossing at $78.33. Second support is the 38% retracement level of the May-August rally crossing at $76.68.
October heating oil was higher overnight as it consolidates some of the decline off last-Thursday's high. Overnight trading sets the stage for a higher opening when the day session begins trading. Stochastics and the RSI are turning neutral to bullish signaling that sideways to higher prices are possible near-term. If October renews the rally off May's low, the June-2022 crossing at 3.2100 is the next upside target. Closes below the 20-day moving average crossing at 2.9903 would signal that a short-term top has been posted. First resistance is last-Thursday's high crossing at 3.1928. Second resistance is the June-2022 high crossing at 3.2100. First support is the 20-day moving average crossing at 2.9903. Second support is the August 8th low crossing at 2.9174.
October unleaded gas was slightly lower overnight and sets the stage for a slightly lower opening when the day session begins trading. Stochastics and the RSI are neutral to bearish signaling that sideways to lower prices are possible near-term. Closes below the 20-day moving average crossing at 2.6018 would signal that a short-term top has been posted while opening the door for a test of the August 3rd low crossing at 2.4847. If October renews the rally off the June 23rd low, the October-2022 high on the weekly continuation chart crossing at 3.0221 is the next upside target. First resistance is the August 11th high crossing at $2.7209. Second resistance is the October-2022 high on the weekly continuation chart crossing at $3.0221. First support is the 20-day moving average crossing at $2.6018. Second support is August 3rd low crossing at $2.4847.
October natural gas was lower overnight as it extends the decline off the August 9th high. Overnight trading sets the stage for a lower opening when the day session begins trading. Stochastics and the RSI are neutral to bearish signaling that sideways to lower prices are possible near-term. Closes below the 50-day moving average crossing at 2.740 would signal that a short-term top has been posted. If September resumes the rally off August's low, the 25% retracement level of the 2022-2023 decline crossing at 3.193 is the next upside target. First resistance is the August 9th high crossing at 3.096. Second resistance is the 25% retracement level of the 2022-2023 decline crossing at 3.301. First support is the 50-day moving average crossing at 2.740. Second support is August's low crossing at 2.570.
CURRENCIEShttp://quotes.ino.com/ex changes/?c=currencies"
CURRENCIES:The September Dollar was slightly lower overnight as it consolidates some of the rally off July's low. Overnight weakness sets the stage for a slightly lower opening when the day session begins trading later this morning. Stochastics and the RSI are overbought but remain neutral to bullish signaling that sideways to higher prices are possible near-term. If September extends the rally off July's low, May's high crossing at $104.205 is the next upside target. Closes below the 20-day moving average crossing at $102.194 would signal that a short-term top has been posted. First resistance is Thursday's highcrossing at $103.495. Second resistance is May's high crossing at $104.205. First support is the 10-day moving average crossing at $102.785. Second support is the 20-day moving average crossing at $102.195.
The September Euro was slightly higher overnight as it consolidates some of this week's decline. Overnight trading sets the stage for a slightly higher opening when the day session begins trading. Stochastics and the RSI are oversold but remain neutral to bearish signaling that sideways to lower prices are possible near-term. If September extends the decline off July's high, the June 12th low crossing at 1.07920 is the next downside target. Closes above the 50-day moving average crossing at $1.10084 would signal that a short-term low has been posted. First resistance is the August 10th high crossing at $1.10850. Second resistance is the July 27th high crossing at $1.11770. First support is July's low crossing at 1.08715. Second support is the June 12th low crossing at 1.07920.
The September British Pound was slightly higher overnight and sets the stage for a slightly higher opening when the day session begins trading. Stochastics and the RSI are bullish signaling that sideways to higher prices near-term. Closes above the August 10th high crossing at 1.2822 would confirm that a short-term low has been posted while opening the door for additional short-covering gains. If September renews the decline off July's high, the 50% retracement level of the March-July rally crossing at 1.2508 is the next downside target. First resistance the August 10th high crossing at 1.2822. Second resistance is the July 27th high crossing at 1.2999. First support is the 38% retracement level of the March-July rally crossing at 1.2658. Second support is the 50% retracement level of the March-July rally crossing at 1.2508.
The September Swiss Franc was steady to slightly lower overnight as it remains poised to extend the decline off July's high. Overnight trading sets the stage for a slightly lower opening when the day session begins trading. Stochastics and the RSI are oversold but remain neutral to bearish signaling that sideways to lower prices are possible near-term. Closes below Monday's low crossing at 1.13700 would open the door for a possible test of the June 30th low crossing at 1.11790. Closes above the 20-day moving average crossing at 1.14943 would signal that a short-term low has been posted. First resistance is the 20-day moving average crossing at 1.14943. Second resistance is the August 10th high crossing at 1.15535. First support is Monday's low crossing at 1.13700. Second support is the June 30th low crossing at 1.11790.
The September Canadian Dollar was higher overnight as it consolidates some of the decline off July's high. Overnight trading sets the stage for a higher opening when the day session begins trading. Stochastics and the RSI are oversold but remain neutral to bearish signaling that sideways to lower prices are possible near-term. If September extends the decline off July's high, the 75% retracement level of the March-July rally crossing at $73.49 is the next downside target. Closes above the August 10th high crossing at $74.82 would signal that a short-term low has been posted. First resistance is the 10-day moving average crossing at $74.30. Second resistance is the August 10th high crossing at $74.82. First support is the 75% retracement level of the March-July rally crossing at $73.49. Second support is the 87% retracement level of the March-July rally crossing at crossing at $73.02.
The September Japanese Yen was slightly higher overnight. Overnight trading sets the stage for a slightly higher opening when the day session begins trading. Stochastics and the RSI are oversold and remain neutral to bearish signaling that sideways to lower prices are possible near-term. If September extends the decline off the July 14th high, the October-2022 low on the weekly continuation chart crossing at 0.066235 is the next downside target. Closes above the 20-day moving average crossing at 0.070297 would signal that a short-term low has been posted. First resistance is the 10-day moving average crossing at 0.069436. Second resistance is the 20-day moving average crossing at 0.070297. First support is Thursday's low crossing at 0.068545. Second support is the October-2022 low on the weekly continuation chart crossing at 0.066235.
PRECIOUS METALS http://quotes.ino.com/ex changes/?c=metals"
Precious Metals: December gold was higher overnight as it consolidates some of the decline off May's high. Overnight trading sets the stage for a higher opening when the day session begins trading later this morning. Stochastics and the RSI are oversold but remain neutral to bearish signaling that sideways to lower prices are possible near-term. If October extends the decline off July's high, February's low crossing at $1883.80 is the next downside target. Closes above the 50-day moving average crossing at $1979.50 would confirm that a short-term low has been posted. First resistance is the 10-day moving average crossing at $1942.20. Second resistance is the 20-day moving average crossing at $1966.40. First support is the 50% retracement level of the 2022-2023 rally crossing at $1919.90. Second support is February's low crossing at $1883.80.
September silver was higher overnight as it consolidates above the 50% retracement level of the 2022-2023 rally crossing at $22.450. Overnight trading sets the stage for a higher opening when the day session begins trading later this morning. Stochastics and the RSI are oversold but remain neutral to bearish signaling that sideways to lower prices are possible near-term. If September extends the decline off July's high, the 62% retracement level of the 2022-2023 rally crossing at $21.452 is the next downside target. Closes above the 50-day moving average crossing at $23.759 would signal that a short-term low has been posted. First resistance is the 20-day moving average crossing at $22.581. Second resistance is the 50-day moving average crossing at $23.759. First support is the 50% retracement level of the 2022-2023 rally crossing at $22.450. Second support is the 62% retracement level of the 2022-2023 rally crossing at $21.452.
September copper was slightly lower overnight as it consolidates some of Thursday's rally. Overnight trading sets the stage for a slightly lower opening when the day session begins trading. Stochastics and the RSI are oversold but remain neutral to bearish signaling that sideways to lower prices are possible near-term. If September extends this month's decline, May's low crossing at 3.5650 is the next downside target. Closes above the 50-day moving average crossing at 3.8198 would signal that a short-term low has been posted. First resistance is the 50-day moving average crossing at 3.8198. Second resistance is the August 4th high crossing at 3.9280. First support is Thursday's low crossing at 3.6270. Second support is May's low crossing at 3.5650.
GRAINS http://quotes.ino.com/ex changes/?c=grains
Grains: December corn was slightly higher overnight as it consolidates some of the decline off July's high. Overnight trading sets the stage for a slightly higher opening when the day sessions begins trading. Stochastics and the RSI are oversold but are turning neutral to bullish signaling that sideways to higher prices are possible near-term. Closes above last-Friday's high crossing at $5.07 1/2 would signal that a short-term low has been posted. If December extends the decline off July's high, the 75% retracement level of the 2020-2022 rally crossing at $4.50 3/4 is the next downside target. First resistance is last-Friday's high crossing at $5.07 1/2. Second resistance is the 50-day moving average crossing at $5.26 3/4. First support is Wednesday's low crossing at $4.73 1/2. Second support is the 75% retracement level of the 2020-2022 rally crossing at $4.50 3/4.
December wheat was higher overnight as it consolidates some of the decline off July's high. Overnight trading sets the stage for a higher opening when the day session begins trading. Stochastics and the RSI are oversold but remain neutral to bearish signaling that sideways to lower prices are possible near-term. If December extends the decline off July's high, May's low crossing at $6.08 1/4 is the next downside target. Closes above the 20-day moving average crossing at $6.79 1/4 would signal that a short-term low has been posted. First resistance is the 10-day moving average crossing at $6.47. Second resistance is the 20-day moving average crossing at $6.79 1/4. First support is Thursday's low crossing at $6.12. Second support is May's low crossing at $6.08 1/4.
December Kansas City wheat was higher overnight as it extends this week's trading range. Overnight trading sets the stage for a higher opening when the day session begins trading later this morning. Stochastics and the RSI are oversold but remain neutral to bearish signaling that sideways to lower prices are possible near-term. If December extends the decline off July's high, May's low crossing at $7.36 is the next downside target. Closes above last-Tuesday's high crossing at $7.89 1/4 would signal that a short-term low has been posted. First resistance is last-Tuesday's high crossing at $7.89 1/4. Second resistance is the 20-day moving average crossing at $8.05. First support is Wednesday's low crossing at $7.39. Second support is May's low crossing at $7.36.
December Minneapolis wheat was higher overnight. Overnight trading sets the stage for a higher opening when the day session begins trading. Stochastics and the RSI are oversold but remain neutral to bearish signaling that sideways to lower prices are possible near-term. If December extends the decline off July's high, the May 31st low crossing at $7.85 3/4 is the next downside target. Closes above the 50-day moving average crossing at $8.57 1/2 would signal that a low has been posted. First resistance is the 10-day moving average crossing at $8.22 1/2. Second resistance is the 50-day moving average crossing at $8.57 1/2. First support is the June 8th low crossing at $7.98 1/4. Second support is the May 31st low crossing at $7.85 3/4.
SOYBEAN COMPLEX? http://quotes.ino.com/ex?changes/?c=grains "
November soybeans was higher overnight and sets the stage for a higher opening when the day session begins trading later this morning. Stochastics and the RSI are bullish signaling that sideways to higher prices are possible near-term. Closes above the 20-day moving average crossing at $13.43 1/4 would signal that a low has been posted. If November renews the decline off July's high, the 62% retracement level of the May-July rally crossing at $12.46 3/4 is the next downside target. First resistance is the 20-day moving average crossing at $13.43 1/4. Second resistance is the July 31st gap crossing at $13.79. First support is the 50% retracement level of the May-July rally crossing at $12.82 3/4. Second support is the June 28th low crossing at $12.56 3/4.
December soybean meal was higher overnight as it extends this week's trading range. Overnight trading sets the stage for a higher opening when the day session begins trading. Stochastics and the RSI are oversold but remain neutral to bearish signaling that sideways to lower prices are possible near-term. If December extends the decline off July's high, the June 29th low crossing at $374.60 is the next downside target. Closes above the 20-day moving average crossing at $396.50 would temper the bearish outlook. First resistance is the 50-day moving average crossing at $395.30. Second resistance is the 20-day moving average crossing at $396.50. First support is the June 29th low crossing at $374.60. Second support is the May 31st low crossing at $361.80.
December soybean oil was steady to slightly lower in overnight trading as it consolidates some of the rally off the August 8th low. Overnight trading sets the stage for a steady to slightly lower opening when the day session begins trading. Stochastics and the RSI are overbought but remain neutral to bullish signaling that sideways to higher prices are possible near-term. If December extends the aforementioned rally, July's high crossing at 65.58 is the next upside target. Closes below the 50-day moving average crossing at 59.21 would signal that a short-term top has been posted. First resistance is the overnight high crossing at 64.42. Second resistance is July's high crossing at 65.58. First support is the 50-day moving average crossing at 59.21. Second support is the August 8th low crossing at 57.86.
Thanks tallpine!
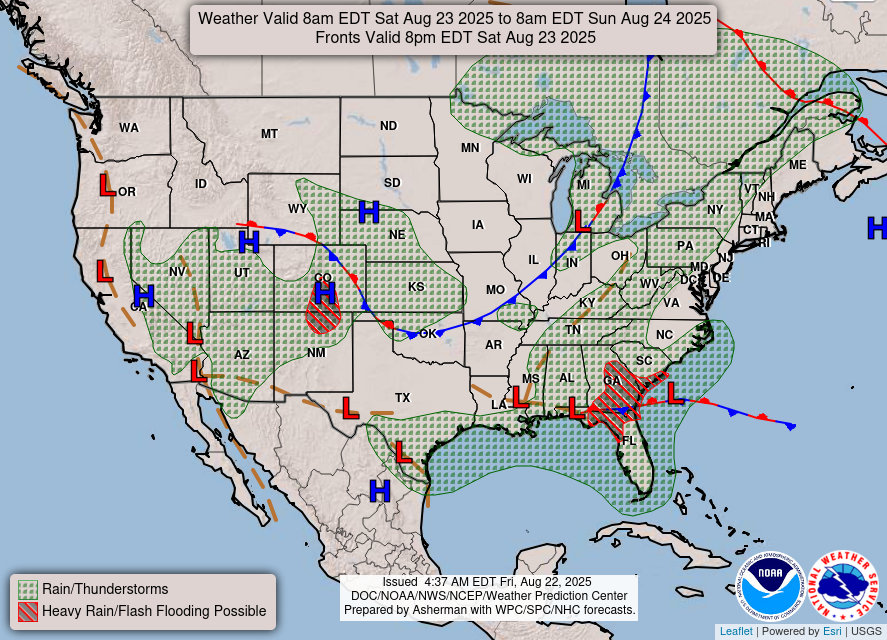
No changes to the weather.
Very bullish the next 10 days, turning hot and staying dry......then increasing chances for rain and less heat.
Temps were cooler by 3 CDDs overnight on the EE, so NG is down.
This was the last EE for Sept. 2.
Ridge weakened and backed up southwest again.
Potentially active flow crossing the Midwest.


All the weather:
https://www.marketforum.com/forum/topic/83844/
As expected, no rain anywhere in the Cornbelt the next week. But look at the West! Remnants of Hurricane Hillary!
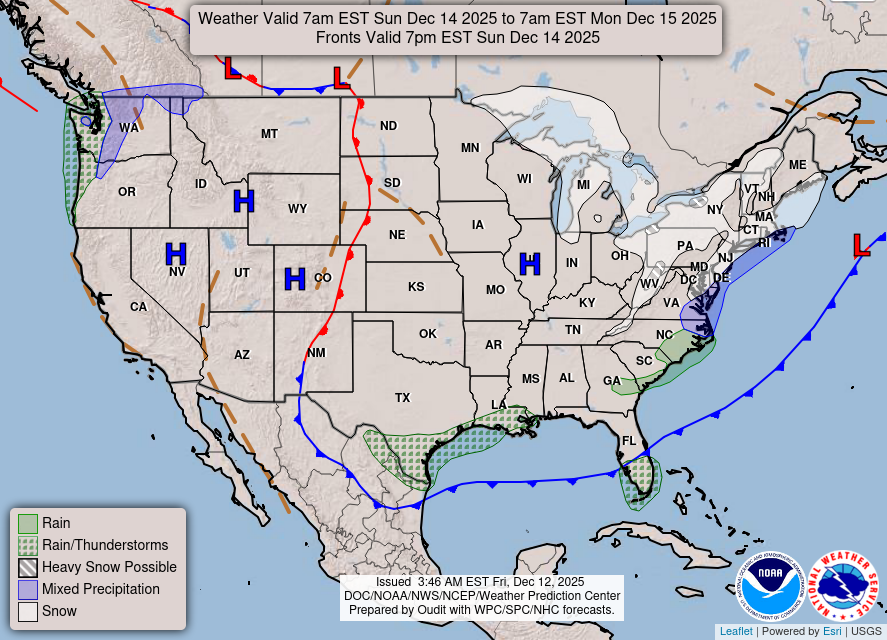
Weather maps now.
In 24 hours and
In 48 hours.
https://www.wpc.ncep.noaa.gov/#

+++++++++++++++++++++++++++++++++++++++++++++++++
Surface Weather maps for days 3-7 below:
https://www.wpc.ncep.noaa.gov/medr/medr.shtml

+++++++++++++++++++++++++++++++++++++++++++
The latest 7 day precip forecasts are below.
Day 1 below:
http://www.wpc.ncep.noaa.gov/qpf/fill_94qwbg.gif?1526306199054

Day 2 below:
http://www.wpc.ncep.noaa.gov/qpf/fill_98qwbg.gif?1528293750112

Day 3 below:
http://www.wpc.ncep.noaa.gov/qpf/fill_99qwbg.gif?1528293842764

Days 4-5 below:
http://www.wpc.ncep.noaa.gov/qpf/95ep48iwbg_fill.gif?1526306162

Days 6-7 below:
http://www.wpc.ncep.noaa.gov/qpf/97ep48iwbg_fill.gif?1526306162

7 Day Total precipitation below:
http://www.wpc.ncep.noaa.govcdx /qpf/p168i.gif?1530796126

Beans have broken out to the upside from the bull flag mentioned earlier this week and corn shows a solid double bottom on the price charts.