Money managers sold 45k contracts of CBOT #corn futures and options in the week ended July 11 despite futures rising nearly 2%. It was the second straight week where funds added a bunch of gross shorts, reflecting a rise in bearish sentiment. July 11 net short was 63k contracts.
Will be interesting to 'see' if Funds sell more with the higher opening Sunday night!
Thanks, tjc!
I know this is really intriguing for you, like it is for me.
My thoughts are that funds leaning the wrong way before that report might have made them more vulnerable to short covering and helped with the strength on Friday.
The best huge moves that happen fast are when a huge fund position has to be covered that was a bet on weather that CHANGED and they have to get out.
In corn, the funds were +200K in Feb, they sold heavy to -100K on May 1.
Then the weather turned dry and they bought to +50K in May to mid June.
Then, we got some nice rains and they sold hard again down to -63 K in the last report.
This is almost nothing compared to recent extreme positions (that make them vulnerable)
In the Springs of 2021 and 2022, they were +400K.
In the Spring of 2019 and Summer of 2020, they were -300K.
I haven't followed their position much for many years but will guess that they are not committed strongly here nor are they especially vulnerable because -63K is nothing for them.
In June of 2020, they went from -250K to +350 K in 6 months.
Here's the January 2021 crop report from the USDA for 2020. There's no definitive, obvious reason for funds to go +600K in their position in the last 6 months of the year based on weather or crop size.
https://www.nass.usda.gov/Newsroom/archive/2021/01-12-2021a.php
https://www.nass.usda.gov/Charts_and_Maps/Field_Crops/cornyld.php
171.4 was the yield for 2020 on this graph, up from 167.5 in 2019. Maybe 2 years below trend eroded stocks along with bad crops elsewhere and increased demand and that's what triggered the massive buying campaign??
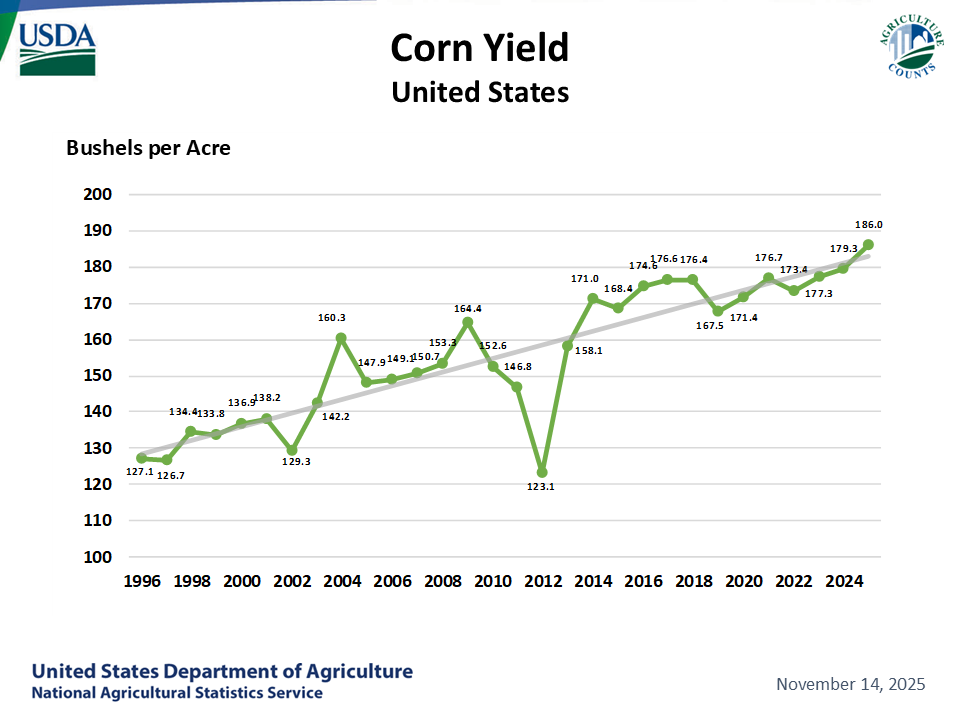
OK, looks like that might have been it.
Corn ending stocks were shrinking for 3 years in a row and got pretty low in 2020/21. Funds will try to see this sort of thing coming well in advance and pile on in that direction. I'll guess that's what compelled them to short so much in the 2nd half of 2020.
Cutworm is an extremely sharp producer that follows this sort of thing closely. Maybe he has a comment.
https://www.nass.usda.gov/Charts_and_Maps/Field_Crops/cornstks.php
https://www.marketforum.com/forum/topic/97340/#97345
By cutworm - July 17, 2023, 10:46 a.m.
Breaking news this am
Russia-Ukraine Black Sea grain deal: All you need to know | Russia-Ukraine war News | Al Jazeera
Russia has declined to extend the Black Sea grain deal, stalling the export of Ukrainian grain to the rest of the world.
But the wartime accord, which had been extended several times, will be terminated on Tuesday, Russia announced on Monday.
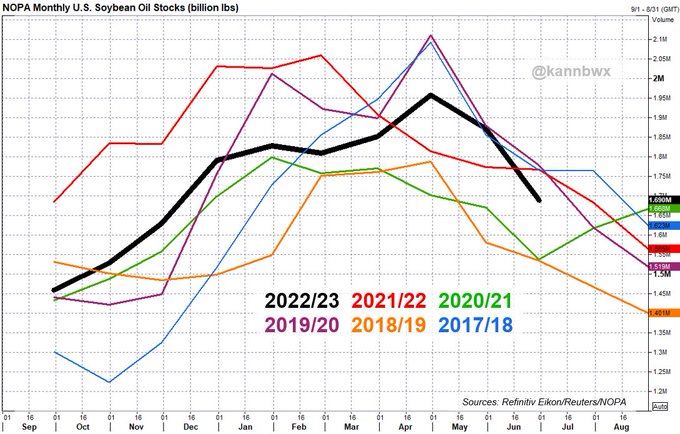
NOPA U.S. crush, June 2023:165.023 mln bu of #soybeans9-month low but +0.2% on June 2022Below trade guess of 170.568 mln#Soyoil stocks 1.69 bln lbs7-month low and -4% from June 2022Trade guess was 1.816 blnOil yield highest since May 2022
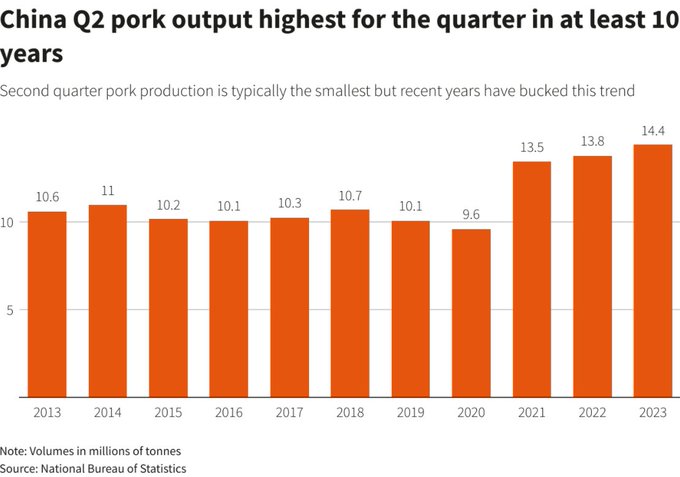
#China's Q2 #pork output was Q2's highest in at least a decade, some 4.6% more than in Q2 2022. Herds were expanded last year, but some farmers were reducing in Q2 based on weaker prices, and that increased slaughter volumes. (Graphic from Reuters).https://reuters.com/article/china-economy-output-pork/update-2-chinas-q2-pork-output-highest-for-the-period-in-at-least-a-decade-idINL1N39303R
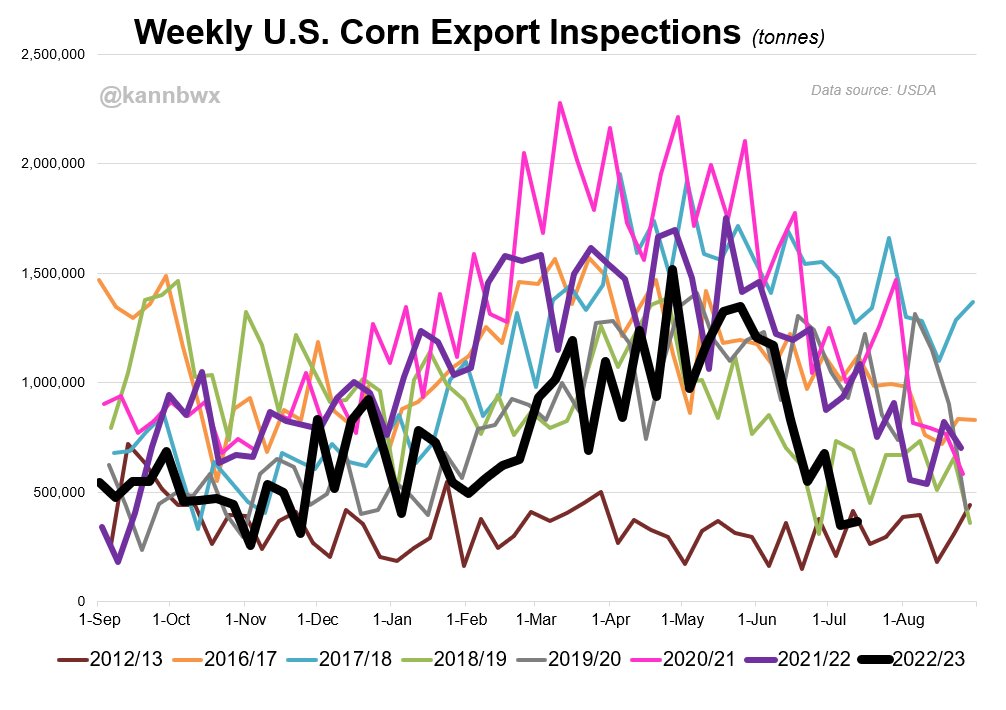
Always a great chart to consult when making comparisons. Funds' current positioning in CBOT #corn futures and options checks out with the 2013 narrative.
The Nov beans 2023-2022-2021 comparison.... perhaps the new 2023-2013-2012 Dec #corn comparison? Here's a checkup on that. 2013 is in full control. 2012 analog is dead. Question now is, does corn continue to follow 2013? Or will it prove to be unique as it did in late June?
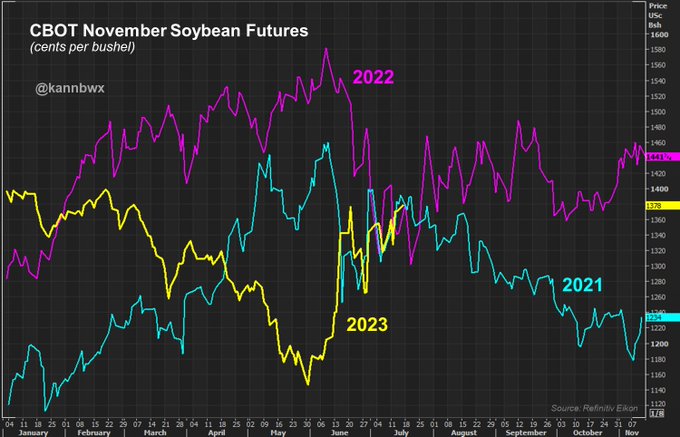
It's still a dead heat among 2023, 2022 and 2021 for mid-July in CBOT November #soybeans, but which path is 2023 more likely to follow from here? Weakening as in 2021, or steady to strengthening as in 2022?
In corn the funds are at an extreme when they are long 300K to 400K time to watch for a change. Same when they are short 250K.
But right now they are in no man's land. By the time I know their position the market has it dialed in.
I'm NOT an expert on this.
Thanks, cutworm,
I apologize for messing up the question. It was about the fundamentals at the time, with stocks getting tighter and tighter.
I was mainly referring to ending stocks shrinking for several years. Producers usually are very on top of this sort of thing.
"Corn ending stocks were shrinking for 3 years in a row and got pretty low in 2020/21. Funds will try to see this sort of thing coming well in advance and pile on in that direction. I'll guess that's what compelled them to short BUY so much in the 2nd half of 2020."
+++++++++++++++++++++++
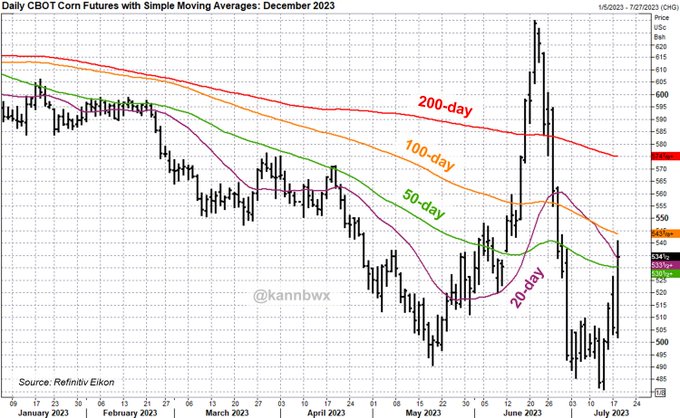
July 18: CBOT Dec #corn jumps 28.5 cents/bu on dry U.S. weather, finishing at $5.34-1/2. That is corn's highest settle since June 28 and just above the 20- and 50-day averages.
Relative Strength Index shows Dec #corn is neither overbought nor oversold - right in the middle. Nov beans are near yearly highs, but not corn. Some Dec 23 corn FYIs: 2023 high: $6.29-3/4 per bu (June 21) 2023 low: $4.81 (July 13) Avg Feb (insurance) price: $5.91
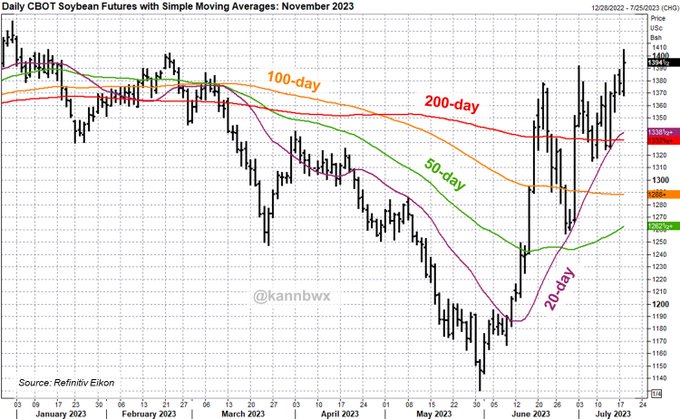
July 18: CBOT Nov #soybeans hit $14/bu for the first time since Feb on unfavorable U.S. weather forecasts, and Tuesday's top of $14.05 was the highest since Jan. 12. Beans settled at $13.95-1/4, well above short- and long-term averages.
July 19: New 2023 high for CBOT November #soybeans: $14.28-3/4 per bushel - taking out the Jan. 3 high of $14.15-3/4. That's the highest price for Nov23 beans since June 9, 2022. Beans have eased to near $14.10 by noon CT on Wednesday.
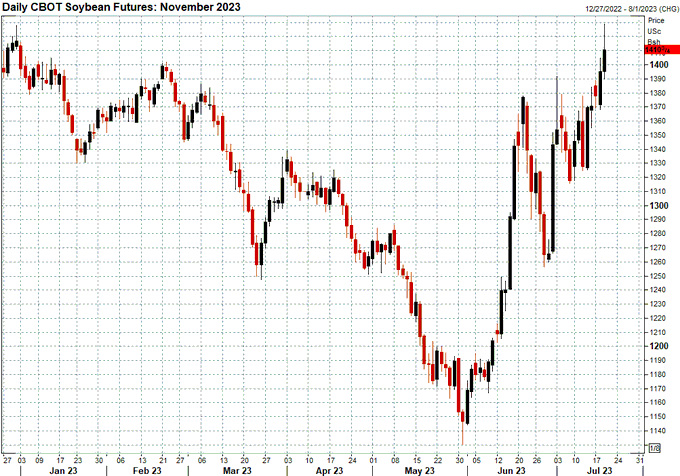
#Corn apparently didn't appreciate being compared to 2013. December corn has gained 9.3% in the last two sessions, a record two-day rise for the Dec23 contract.
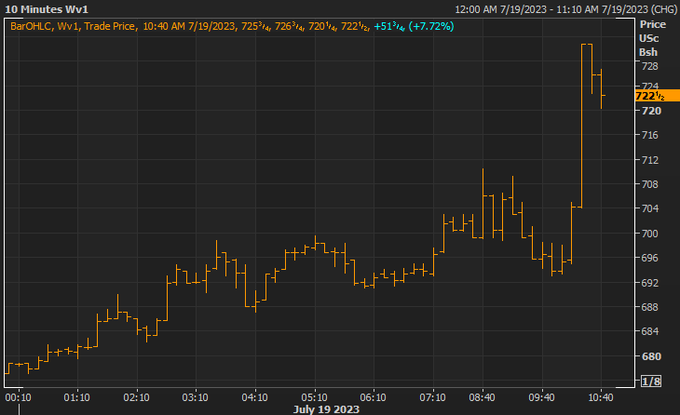
metmike: Funds got blown out of some shorts today!
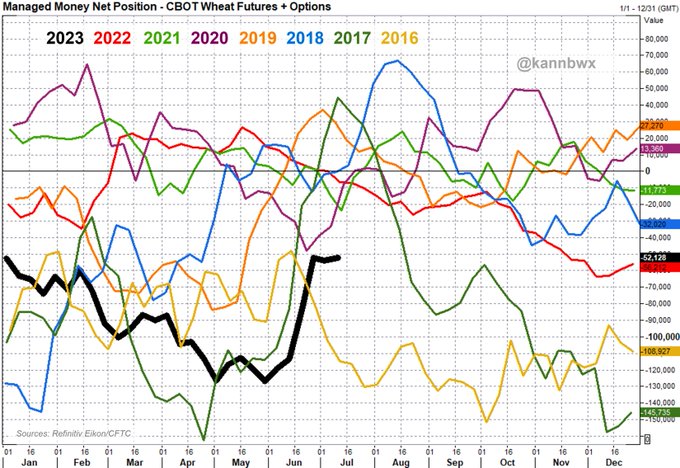
Here is money managers' net short in CBOT #wheat f&o as of July 11. Interesting that funds haven't shown too much anxiety over Russia/Ukraine (at least per this position) since early March 2022 when prices hit records - there's a mostly steady selling trend March 2022 - May 2023.
++++++++++++
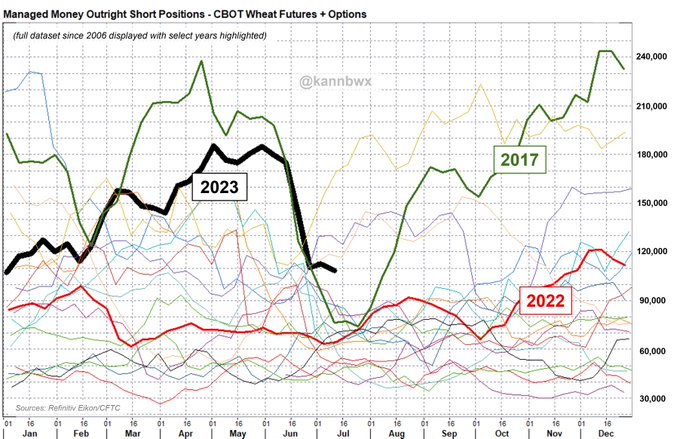
Funds covered a good portion of their gross shorts in CBOT #wheat fut&opt in mid/late June, though they were still relatively exposed as of July 11 (shown). Especially given that open interest in wheat f&o is at 18yr lows for the date and -9% YOY.