KEY EVENTS TO WATCH FOR:
Monday, July 17, 2023
8:30 AM ET. July Empire State Manufacturing Survey
Mfg Idx (previous 6.6)
Employment Idx (previous -3.6)
New Orders Idx (previous 3.1)
Prices Received (previous 9.0)
Tuesday, July 18, 2023
8:30 AM ET. June Advance Monthly Sales for Retail & Food Services
Overall Sales-SA, M/M% (expected +0.5%; previous +0.3%)
Sales, Ex-Auto, M/M% (expected +0.3%; previous +0.1%)
Sales, Ex-Auto & Gas, M/M% (previous +0.4%)
8:55 AM ET. Johnson Redbook Retail Sales Index
Ret Sales Mo-to-Date, Y/Y% (previous -0.4%)
Latest Wk, Y/Y% (previous -0.4%)
9:15 AM ET. June Industrial Production & Capacity Utilization
Industrial Production, M/M% (expected +0.0%; previous -0.2%)
Capacity Utilization % (expected 79.5%; previous 79.6%)
Capacity Utilization, Net Chg (Pts.) (previous -0.2)
10:00 AM ET. July NAHB Housing Market Index
Housing Mkt Idx (expected 56; previous 55)
10:00 AM ET. May Manufacturing & Trade: Inventories & Sales
Total Inventories (expected +0.2%; previous +0.2%)
4:00 PM ET. May Treasury International Capital Data
4:30 PM ET. API Weekly Statistical Bulletin
Crude Stocks, Net Chg (Bbls) (previous +3.0M)
Gasoline Stocks, Net Chg (Bbls) (previous +1.0M)
Distillate Stocks, Net Chg (Bbls) (previous +2.9M)
Wednesday, July 19, 2023
7:00 AM ET. MBA Weekly Mortgage Applications Survey
Composite Idx (previous 208.4)
Composite Idx, W/W% (previous +0.9%)
Purchase Idx-SA (previous 165.3)
Purchase Idx-SA, W/W% (previous +1.8%)
Refinance Idx (previous 416)
Refinance Idx, W/W% (previous -1.3%)
8:30 AM ET. June New Residential Construction - Housing Starts and Building Permits
Total Starts (expected 1.48M; previous 1.631M)
Housing Starts, M/M% (expected -9.3%; previous +21.7%)
Building Permits (expected 1.48M; previous 1.491M)
Building Permits, M/M% (expected -0.7%; previous +5.2%)
10:30 AM ET. EIA Weekly Petroleum Status Report
Crude Oil Stocks (Bbl) (previous 458.128M)
Crude Oil Stocks, Net Chg (Bbl) (previous +5.946M)
Gasoline Stocks (Bbl) (previous 219.452M)
Gasoline Stocks, Net Chg (Bbl) (previous -0.004M)
Distillate Stocks (Bbl) (previous 118.181M)
Distillate Stocks, Net Chg (Bbl) (previous +4.815M)
Refinery Usage (previous 93.7%)
Total Prod Supplied (Bbl/day) (previous 18.701M)
Total Prod Supplied, Net Chg (Bbl/day) (previous -2.534M)
The STOCK INDEXES? http://quotes.ino.com/ex?changes/?c=indexes
The STOCK INDEXES: The September NASDAQ 100 was steady to slightly higher overnight. The stage is set for a steady to slightly higher opening when the day session begins trading. Stochastics and the RSI are overbought but remain neutral to bullish signaling that sideways to higher prices are possible near-term. If September extends this year's rally, the 87% retracement level of the 2021-2022-decline on the weekly continuation chart crossing at 15,957.86 is the next upside target. Closes below last-Monday's low crossing at 15,063.25 would signal that a short-term top has been posted. First resistance is last-Friday's high crossing at 15,857.25. Second resistance is the 87% retracement level of the 2021-2022-decline on the weekly continuation chart crossing at 15,957.86. First support is last-Monday's low crossing at 15,063.25. Second support is the June 26th low crossing at 14,853.50.
The September S&P 500 was steady to slightly lower overnight as it consolidates some of last-week's rally to new highs for the year. Overnight trading sets the stage for a slightly lower opening when the day session begins trading. Stochastics and the RSI are overbought but remain neutral to bullish signaling that sideways to higher prices are possible near-term. If June extends the rally off March's low, the 87% retracement level of the 2022 decline crossing at 4639.07 is the next upside target. Closes below last-Monday's low crossing at 4411.25 would signal that a short-term top has been posted. First resistance is last-Friday's high crossing at 4560.50. Second resistance is the 87% retracement level of the 2022 decline crossing at 4639.07. First support is last-Monday's low crossing at 4411.25. Second support is the June 26th low crossing at 4368.50.
INTEREST RATES http://quotes.ino.com/ex changes/?c=interest"
INTEREST RATES: September T-bonds was higher overnight as it extends the rally off the July 10th low. Overnight trading sets the stage for a higher opening when the day session begins trading. Stochastics and the RSI remain neutral to bullish signaling that sideways to higher prices are possible near-term. If September extends the aforementioned rally, the 50-day moving average crossing at 127-20 is the next upside target. Closes below the 10-day moving average crossing at 125-13 would temper the near-term friendly outlook. First resistance is the 50-day moving average crossing at 127-20. Second resistance is the 50% retracement level of the April-July decline crossing at 128-21. First support is the 10-day moving average crossing at 125-13. Second support is the July 10th low crossing at 122-30.
September T-notes were higher overnight and sets the stage for a higher opening when the day session begins trading. Stochastics and the RSI are neutral to bullish signaling that sideways to higher prices are possible near-term. If September extends this month's rally, the 50-day moving average crossing at 113.230 is the next upside target. Closes below the 10-day moving average crossing at 111.247 would signal that a short-term top has likely been posted. First resistance is the 50-day moving average crossing at 113.230. Second resistance is June's high crossing at 115.000. First support is the 10-day moving average crossing at 111.246. Second support is the July 6th low crossing at 110.050.
ENERGY MARKETS? http://quotes.ino.com/ex?changes/?c=energy ""
ENERGIES:Augustcrude oil was lower overnight as it consolidates some of the rally off the June 28th low. Overnight trading sets the stage for a lower opening when the day session begins trading. Stochastics and the RSI are overbought and are turning neutral to bearish signaling that sideways to lower prices are possible near-term. Closes below the 20-day moving average crossing at $71.95 would signal that a short-term top has been posted. If August extends the rally off the June 28th low, the 75% retracement level of the April-May decline crossing at $77.85 is the next upside target. First resistance is last-Thursday's high crossing at $77.33. Second resistance is the 75% retracement level of the April-May decline crossing at $77.85. First support is the 10-day moving average crossing at 73.76. Second support is the 20-day moving average crossing at $71.95.
September heating oil was steady to slightly higher overnight and set sets the stage for a slightly higher opening when the day session begins trading. Stochastics and the RSI are overbought but remain neutral to bullish signaling that sideways to higher prices are possible near-term. If September extends the rally off May's low, April's high crossing at 2.6618 is the next upside target. Closes below the 20-day moving average crossing at 2.4754 would signal that a short-term top has been posted. First resistance is April's high crossing at 2.6618. Second resistance is the 50% retracement level of the 2022-2023 decline crossing at 2.7273. First support is the 10-day moving average crossing at 2.5336. Second support is the 20-day moving average crossing at 2.4754.
September unleaded gas was lower overnight as it consolidates some of the rally off May's low. Overnight trading sets the stage for a lower opening when the day session begins trading. Stochastics and the RSI are overbought but remain neutral to bullish signaling that sideways to higher prices are possible near-term. If September extends the rally off May's low, April's high crossing at $2.6388 is the next upside target. Closes below the 20-day moving average crossing at 2.4700 would signal that a short-term top has been posted. First resistance is last-Thursday's high crossing at $2.6211. Second resistance is April's high crossing at $2.6388. First support is the 10-day moving average crossing at $2.5199. Second support is the 20-day moving average crossing at $2.4700.
September natural gas was steady to slightly higher overnight and sets the stage for a slightly higher opening when the day session begins trading. Stochastics and the RSI are oversold but remain neutral to bearish signaling that sideways to lower prices are possible near-term. Multiple closes below the 50-day moving average crossing at 2.554 would open the door for additional weakness near-term. If September renews the rally off June's low, the 25% retracement level of the 2022-2023 decline crossing at 3.193 is the next upside target. First resistance is the June 26th high crossing at 2.911. Second resistance is the 25% retracement level of the 2022-2023 decline crossing at 3.193. First support is the 50-day moving average crossing at 2.554. Second support is the June 1st low crossing at 2.249.
CURRENCIEShttp://quotes.ino.com/ex changes/?c=currencies"
CURRENCIES:The September Dollar was steady to slightly lower overnight. Overnight trading sets the stage for a slightly lower opening when the day session begins trading later this morning. Stochastics and the RSI are oversold but remain neutral to bearish signaling that sideways to lower prices are possible near-term. If September extends the decline off the July 6th high, the March 30th low on the weekly continuation chart crossing at $97.730 is the next downside target. Closes above the 20-day moving average crossing at $101.797 would signal that a short-term low has been posted. First resistance is the 10-day moving average crossing at $101.234. Second resistance is the 20-day moving average crossing at $101.797. First support is last-Friday's low crossing at $99.260. Second support is the March 30th -2022 low on the weekly continuation chart crossing at $97.730.
The September Euro was steady to slightly higher overnight and sets the stage for a slightly higher opening when the day session begins trading. Stochastics and the RSI are overbought but remain neutral to bullish signaling that sideways to higher prices are possible near-term. If September extends the rally off May's low, the March 30th -2022 crossing at $1.15190 is the next upside target. Closes below the 20-day moving average crossing at 1.10284 would signal that a short-term top has been posted while opening the door for additional weakness near-term. First resistance is the overnight high crossing at $1.12845. Second resistance is the March 30th -2022 crossing at $1.15190. First support is the 10-day moving average crossing at 1.10825. Second support is the 20-day moving average crossing at 1.10284.
The September British Pound was steady to slightly lower overnight as it consolidates some of the rally off March's low. Overnight trading and sets the stage for a slightly lower opening when the day session begins trading. Stochastics and the RSI are overbought but remain neutral to bullish signaling that sideways to higher prices near-term. If September extends the rally off May's low, the 75% retracement level of the 2022-2023 decline crossing at 1.3253 is the next upside target. Closes below the 20-day moving average crossing at 1.2821 would signal that a short-term top has been posted. First resistance is last-Friday's high crossing at 1.3146. Second resistance is the 75% retracement level of the 2022-2023 decline crossing at 1.3253. First support is the 10-day moving average crossing at 1.2909. Second support is the 20-day moving average crossing at 1.2820.
The September Swiss Franc was higher overnight as it extends the rally off May's low. Overnight trading sets the stage for a higher opening when the day session begins trading. Stochastics and the RSI are overbought but remain neutral to bullish signaling that sideways to higher prices are possible near-term. If September extends the rally off May's low, the January 2019 high crossing at 1.18680 is the next upside target. Closes below the 20-day moving average crossing at 1.13620 would signal that a short-term top has been posted. First resistance is last-Friday's high crossing at 1.17535. Second resistance is the January 2019 high crossing at 1.18680. First support is the 10-day moving average crossing at 1.14606. Second support is the 20-day moving average crossing at 1.13620.
The September Canadian Dollar was slightly lower overnight and sets the stage for a slightly lower opening when the day session begins trading. Stochastics and the RSI are turning neutral to bearish signaling that sideways to lower prices are possible near-term. Closes below the 10-day moving average crossing at $75.60 would signal that a short-term top has been posted. If September extends the rally off July's low, the September-12th -2022 high crossing at $77.11 is the next upside target. First resistance is the 38% retracement level of the 2022-2023 decline crossing at $76.28. Second resistance is the September-12th -2022 high crossing at $77.11. First support is the 10-day moving average crossing at $75.60. Second support is the 50-day moving average crossing at $75.00.
The September Japanese Yen was slightly higher overnight. Overnight trading sets the stage for a higher opening when the day session begins trading. Stochastics and the RSI are overbought but remain neutral to bullish signaling that sideways to higher prices are possible near-term. If September extends the rally off May's low, the 38% retracement level of the January-July decline crossing at 0.074017 is the next upside target. Closes below the 20-day moving average crossing at 0.071190 would signal that a short-term top has been posted. First resistance is last-Friday's high crossing at 0.073585. Second resistance is the 38% retracement level of the January-June decline crossing at 0.074017. First support is the 20-day moving average crossing at 0.071190. Second support is July's low crossing at 0.069755.
PRECIOUS METALS http://quotes.ino.com/ex changes/?c=metals"
Precious Metals: Augustgold was slightly lower overnight and sets the stage for a slightly lower opening when the day session begins trading later this morning. Stochastics and the RSI are overbought but remain neutral to bullish signaling that sideways to higher prices are possible near-term. If August extends the rally off June's low, the 50-day moving average crossing at $1974.70 is the next upside target. Closes below the 20-day moving average crossing at $1938.40 would signal that a short-term top has been posted. First resistance is the 50-day moving average crossing at $1974.70. Second resistance is June's high crossing at $2000.70. First support is June's low crossing at $1900.60. Second support is the 50% retracement level of the September-May rally crossing at $1892.30.
September silver was slightly lower overnight and sets the stage for a slightly lower opening when the day session begins trading later this morning. Stochastics and the RSI are overbought but remain neutral to bullish signaling that sideways to higher prices are possible near-term. If July extends the rally off June's low, the 75% retracement level of the May-June decline crossing at $25.561 is the next upside target. Closes below the 20-day moving average crossing at $23.496 would signal that a short-term top has been posted. First resistance is last-Friday's high crossing at $25.255. Second resistance is the 75% retracement level of the May-June decline crossing at 25.561. First support is the 50-day moving average crossing at $24.027. Second support is the 20-day moving average crossing at $23.496.
September copper was sharply lower overnight as it consolidates some of the rally off the June 29th low and sets the stage for a sharply lower opening when the day session begins trading. Stochastics and the RSI are neutral to bearish signaling that sideways to lower prices are possible near-term. Closes below the 50-day moving average crossing at 3.7872 would signal that a short-term top has been posted. If September extends the rally off the June 29th low, June's high crossing at 3.9640 is the next upside target. First resistance June's high crossing at 3.9640. Second resistance is May's high crossing at 4.0100. First support is the June 29th low crossing at 3.6830. Second support is May's low crossing at 3.5650.
GRAINS http://quotes.ino.com/ex changes/?c=grains
Grains: December corn gapped up and was higher overnight as it extends the rally off last-Thursday's low. Overnight trading sets the stage for a higher opening when the day sessions begins trading. Stochastics and the RSI are turning bullish signaling that sideways to higher prices are possible near-term. If December extends the rally off last-Thursday's low, the 50-day moving average crossing at $5.30 1/2 is the next upside target. If December renews the decline off the June 21st high, the September 2022 low crossing at $4.62 1/2 is the next downside target.First resistance is the 50-day moving average crossing at $5.30 1/2. Second resistance is the 20-day moving average crossing at $5.37 1/4. First support is last-Thursday's low crossing at $4.81. Second support is the September 2022 low crossing at $4.62 1/2.
September wheat gapped up and was higher overnight as it extends the rally off last-Thursday's low. Overnight trading sets the stage for a higher opening when the day session begins trading. Stochastics and the RSI are turning neutral to bullish signaling that sideways to higher prices are possible near-term. Closes above the 20-day moving average crossing at $6.81 1/4 would signal that a short-term low has been posted. If September renews the decline off June's high, May's low crossing at $5.87 3/4 is the next downside target. First resistance is the 20-day moving average crossing at $6.81 1/4. Second resistance is June's high crossing at $7.70 1/4. First support is last-Thursday's low crossing at $6.22. Second support is May's low crossing at $5.87 3/4.
September Kansas City wheat was higher overnight as it extends the rally off last-Wednesday's low. Overnight trading sets the stage for a higher opening when the day session begins trading later this morning. Stochastics and the RSI are turning bullish signaling that sideways to higher prices are possible near-term. Closes above the 20-day moving average crossing at $8.30 1/4 would signal that a short-term low has been posted while opening the door for additional gains near-term. If September renews the decline off July's high, July's low crossing at $7.87 1/4 is the next downside target. First resistance is July's high crossing at $8.55 3/4. Second resistance is June's high crossing at $8.89 1/2. First support is July's low crossing at $7.87 1/4. Second support is the June 14th low crossing at $7.76 3/4.
September Minneapolis wheat was higher overnight as it extends the rally off July's low. Overnight trading sets the stage for a higher opening when the day session begins trading. Stochastics and the RSI are neutral to bullish signaling that sideways to higher prices are possible near-term. If September extends the rally off July's low, April's high crossing at $9.10 1/2 is the next upside target. Closes below the 20-day moving average crossing at $8.55 1/4 would temper the near-term friendly outlook. First resistance is June's high crossing at $8.94 1/2. Second resistance is April's high crossing at $9.10 1/2. First support is the 20-day moving average crossing at $8.55 1/4. Second support is the 50-day moving average crossing at $8.36 1/2. Second support is July's low crossing at $8.07 1/4.
SOYBEAN COMPLEX? http://quotes.ino.com/ex?changes/?c=grains "
November soybeans were higher overnight and sets the stage for a higher opening when the day session begins trading later this morning. Stochastics and the RSI are becoming overbought but remain neutral to bullish signaling that sideways to higher prices are possible near-term. If November renews the rally off May's low, the 87% retracement level of the 2022-2023 decline crossing at $14.07 1/2 is the next upside target. Closes below the 20-day moving average crossing at $13.36 1/4 would signal that a short-term top has been posted. First resistance is the 87% retracement level of the 2022-2023 decline crossing at $14.07 1/2. Second resistance is the December 2022 high crossing at $14.27 3/4. First support is the 20-day moving average crossing at $13.36 1/4. Second support is the 50-day moving average crossing at $12.60 1/4.
December soybean meal was higher overnight and sets the stage for a higher opening when the day session begins trading. Stochastics and the RSI are neutral to bullish signaling that sideways to higher prices are possible near-term. If December renews the rally off the June 29th low, the 75% retracement level of the March-May decline crossing at $418.80 is the next upside target. Closes below the 50-day moving average crossing at $386.80 would confirm that a short-term top has been posted. First resistance is July's high crossing at $4.15 1/4. Second resistance is the 75% retracement level of the March-May decline crossing at $418.80. First support is the July 7th low crossing at $3.84 3/4. Second support is the June 29th low crossing at $374.60.
December soybean oil was higher overnight as it extends the trading range of the past two-weeks. Overnight strength sets the stage for a higher opening when the day session begins trading. Stochastics and the RSI are neutral to bullish signaling that sideways to higher prices are possible near-term. If December renews the rally off May's low, the 75% retracement level of the 2022-2023 decline crossing at 65.45 is the next upside target. Closes below the 20-day moving average crossing at 58.18 would signal that a short-term top has been posted. First resistance is the 62% retracement level of the 2022-2023 decline crossing at 61.75. Second resistance is the 75% retracement level of the 2022-2023 decline crossing at 65.45. First support is the 20-day moving average crossing at 58.18. Second support is the June 29th low crossing at 54.67.
Thanks much tallpine!
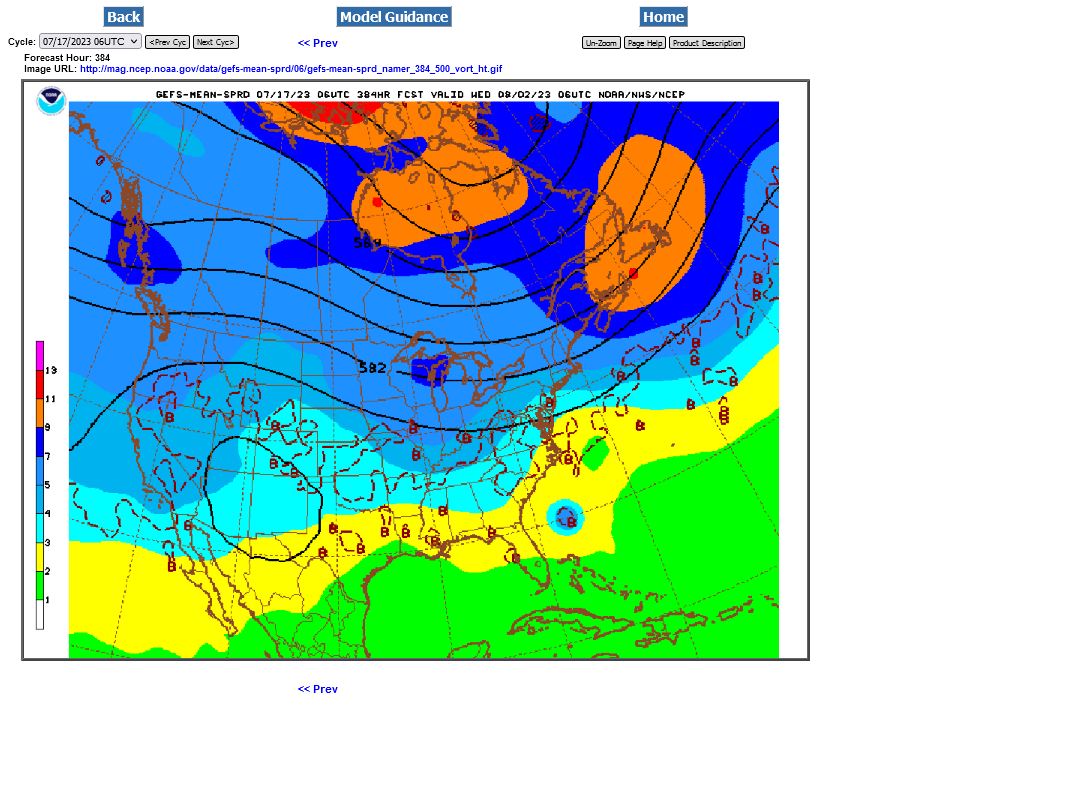
The 6z GEFS that came out towards the end of the overnight session had more rains/shifted rain amounts farther west. Just a subtle change and the weather is still not bearish (mostly bullish for the northwest half of the cornbelt)
1. NEW 500mb Upper level trough backing up farther west and deepening a bit. Dome backs up a tad
2. Previous 0z 500 mb. Note the 588 contour covered most of IA then but recedes on the one above-yes, it's pretty subtle!
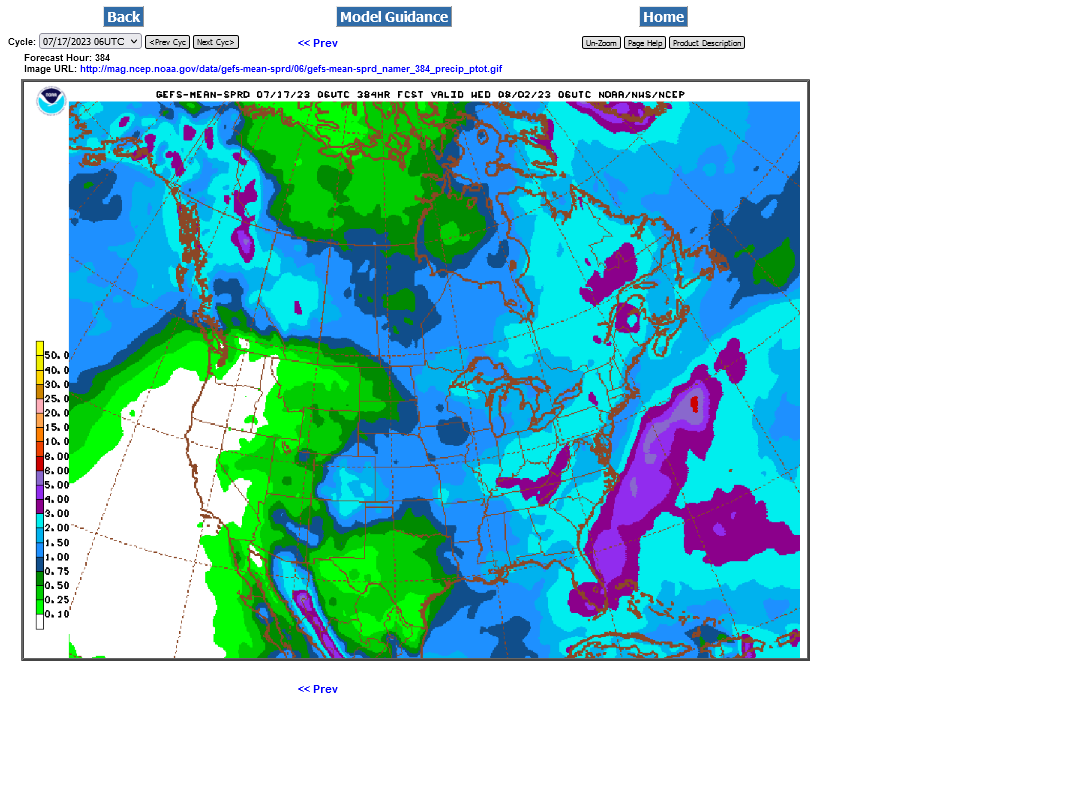
3. New 6z GEFS rains wetter WCB/Upper Midwest-just slightly
4. Previous 0z GEFS


Breaking news this am
Russia-Ukraine Black Sea grain deal: All you need to know | Russia-Ukraine war News | Al Jazeera
Russia has declined to extend the Black Sea grain deal, stalling the export of Ukrainian grain to the rest of the world.
But the wartime accord, which had been extended several times, will be terminated on Tuesday, Russia announced on Monday.
Thanks a ton cutworm, maybe this is expected? I would think that this is pretty bullish, if not.
I think it made the spike about 4 am edt, But the market has since fallen back
Or maybe it's buy the rumor, sell the fact and this totally explains why corn charged ahead on Friday and left beans behind, then gapped higher last evening but not beans.
The spike up you refer to overnight corresponded to the drier EE model coming out.
+++++++++++++++++
HOWEVER, I just checked the wheat chart and YOU ARE RIGHT. Wheat spiked 20c higher right when you said and that was NOT from the EE. Wheat would be impacted the most by this.
At 3:57 am, wheat spike 12c in less than a minute. The thing that causes something like that is NEWS!
Regardless, I think this was probably expected with buy the rumor going on Friday and early Sun Night and now its sell the fact.
The Canadian model, below, always comes out around an hour before the other models. The market usually doesn't pay a great deal of attention to it.
This is the just out 12z run. There is a slight majority of members that are bearish vs bullish but a huge disparity continues.
However, the ensemble mean does not have that much rain in it, which is bulish.
https://weather.gc.ca/ensemble/charts_e.html?Hour=384&Day=0&RunTime=12&Type=gz
384h GZ 500 forecast valid on Aug 02, 2023 12 UTC


