KEY EVENTS TO WATCH FOR:
Thursday, July 13, 2023
8:30 AM ET. Unemployment Insurance Weekly Claims Report - Initial Claims
Jobless Claims (previous 248K)
Jobless Claims, Net Chg (previous +12K)
Continuing Claims (previous 1720000)
Continuing Claims, Net Chg (previous -13K)
8:30 AM ET. June PPI
PPI, M/M% (previous -0.3%)
Ex-Food & Energy PPI, M/M% (previous +0.2%)
Personal Consumption (previous -0.4%)
8:30 AM ET. U.S. Weekly Export Sales
10:30 AM ET. EIA Weekly Natural Gas Storage Report
Working Gas In Storage (Cbf)
Working Gas In Storage, Net Chg (Cbf)
2:00 PM ET. June Monthly Treasury Statement of Receipts and Outlays of the U.S. Government
4:30 PM ET. Federal Discount Window Borrowings
4:30 PM ET. Foreign Central Bank Holdings
The STOCK INDEXES? http://quotes.ino.com/ex?changes/?c=indexes
The STOCK INDEXES: The September NASDAQ 100 was higher overnight as it is resuming this year's rally. The stage is set for a higher opening when the day session begins trading. Stochastics and the RSI are becoming overbought but remain neutral to bullish signaling that sideways to higher prices are possible near-term. If September extends this year's rally, the 87% retracement level of the 2021-2022-decline on the weekly continuation chart crossing at 15,957.86 is the next upside target. Closes below Monday's low crossing at 15,063.25 would signal that a short-term top has been posted. First resistance is the overnight high crossing at 15,559.75. Second resistance is the 87% retracement level of the 2021-2022-decline on the weekly continuation chart crossing at 15,957.86. First support is Monday's low crossing at 15,063.25. Second support is the June 26th low crossing at 14,853.50. Third support is the June 6th low crossing at 14,420.00.
The September S&P 500 was higher overnight as it extends Wednesday's rally, which posted a new high for the year. Overnight trading sets the stage for a higher opening when the day session begins trading. Stochastics and the RSI are overbought but remain neutral to bullish signaling that sideways to higher prices are possible near-term. If June extends the rally off March's low, the 87% retracement level of the 2022 decline crossing at 4639.07 is the next upside target. Closes below the June 26th low crossing at 4368.50 would confirm that a short-term top has been posted. First resistance is the 75% retracement level of the 2022 decline crossing at 4505.40. Second resistance is the 87% retracement level of the 2022 decline crossing at 4639.07. First support is Monday's low crossing at 4411.25. Second support is the June 26th low crossing at 4368.50. Third support is the 50-day moving average crossing at 4322.97.
INTEREST RATES http://quotes.ino.com/ex changes/?c=interest"
INTEREST RATES: September T-bonds was higher overnight and sets the stage for a higher opening when the day session begins trading. Stochastics and the RSI are bullish signaling that sideways to higher prices are possible near-term. Closes above 20-day moving average crossing at 126-16 would signal that a short-term low has been posted while opening the door for additional short-term gains. If September resumes the decline off April's high, the March 22nd low on the continuation chart crossing at 122-22 is the next downside target. First resistance is the 20-day moving average crossing at 126-16. Second resistance is the 50-day moving average crossing at 127-26. First support is Monday's low crossing at 122-30. Second support is the March 22nd low on the weekly continuation chart crossing at 122-22.
September T-notes were higher overnight as it extends the rally off last-Thursday's low. Overnight trading sets the stage for a higher opening when the day session begins trading. Stochastics and the RSI are neutral to bullish signaling that sideways to higher prices are possible near-term. Closes above the 20-day moving average crossing at 112.118 would signal that a short-term low has been posted. If September renews the decline off May's high, the October-2022 low on the weekly continuation chart crossing at 108.265 is the next downside target. First resistance is the 20-day moving average crossing at 112.118. Second resistance is the 50-day moving average crossing at 113.277. First support is last-Thursday's low crossing at 110.050. Second support is the October-2022 low on the weekly continuation chart crossing at 108.265.
ENERGY MARKETS? http://quotes.ino.com/ex?changes/?c=energy ""
ENERGIES:Augustcrude oil was steady to slightly higher overnight and sets the stage for a slightly higher opening when the day session begins trading. Stochastics and the RSI are overbought but remain neutral to bullish signaling that sideways to higher prices are possible near-term. If August extends the rally off the June 28th low, the 75% retracement level of the April-May decline crossing at $77.85 is the next upside target. Closes below the 20-day moving average crossing at $71.37 would signal that a short-term top has been posted. First resistance is the overnight high crossing at $76.16. Second resistance is the 75% retracement level of the April-May decline crossing at $77.85. First support is the 20-day moving average crossing at $71.37. Second support is the June 28th low crossing at $67.05.
September heating oil was steady to slightly higher overnight and set sets the stage for a slightly higher opening when the day session begins trading. Stochastics and the RSI are overbought but remain neutral to bullish signaling that sideways to higher prices are possible near-term. If September extends the rally off May's low, April's high crossing at 2.6618 is the next upside target. Closes below the 20-day moving average crossing at 2.4565 would signal that a short-term top has been posted. First resistance is the 38% retracement level of the 2022-2023 decline crossing at 2.6107. Second resistance is April's high crossing at 2.6618. First support is the 20-day moving average crossing at 2.4565. Second support is the 50-day moving average crossing at 2.3927.
September unleaded gas was slightly higher overnight as it extends the rally off May's low. Overnight trading sets the stage for a slightly higher opening when the day session begins trading. Stochastics and the RSI are overbought but remain neutral to bullish signaling that sideways to higher prices are possible near-term. If September extends the rally off May's low, April's high crossing at $2.6388 is the next upside target. Closes below the 20-day moving average crossing at 2.4537 would signal that a short-term top has been posted. First resistance is the overnight high crossing at $2.6114. Second resistance is April's highcrossing at $2.6388. First support is the 10-day moving average crossing at $2.4929. Second support is the 20-day moving average crossing at $2.4537.
September natural gas was steady to slightly higher overnight and sets the stage for a slightly higher opening when the day session begins trading. Stochastics and the RSI are turning neutral to bearish signaling that sideways to lower prices are possible near-term. Closes below the 50-day moving average crossing at 2.552 would signal that a short-term low has been posted while opening the door for additional weakness near-term. If September renews the rally off June's low, the 25% retracement level of the 2022-2023 decline crossing at 3.193 is the next upside target. First resistance is the June 26th high crossing at 2.911. Second resistance is the 25% retracement level of the 2022-2023 decline crossing at 3.193. First support is the 50-day moving average crossing at 2.552. Second support is the June 1st low crossing at 2.249.
CURRENCIEShttp://quotes.ino.com/ex changes/?c=currencies"
CURRENCIES:The September Dollar was lower overnight marking a downside breakout of this year's trading. Overnight trading sets the stage for a lower opening when the day session begins trading later this morning. Stochastics and the RSI are oversold but remain neutral to bearish signaling that sideways to lower prices are possible near-term. If September extends the decline off last-Thursday's high, the March 30th low on the weekly continuation chart crossing at $97.730 is the next downside target. Closes above the 50-day moving average crossing at $102.482 would signal that a short-term low has been posted. First resistance is the 50-day moving average crossing at $102.443. Second resistance is last-Thursday's high crossing at $103.275. First support is the overnight low crossing at $99.890. Second support is the March 30th -2022 low on the weekly continuation chart crossing at $100.340.
The September Euro was higher overnight and sets the stage for a higher opening when the day session begins trading. Stochastics and the RSI are overbought but remain neutral to bullish signaling that sideways to higher prices are possible near-term. If September extends the rally off May's low, the 38% retracement level of the 2018-2022 decline crossing at $1.12547 is the next upside target. Closes below the 50-day moving average crossing at 1.09354 would signal that a short-term top has been posted while opening the door for additional weakness near-term. First resistance is the overnight high crossing at $1.12110. Second resistance is the 38% retracement level of the 2018-2022 decline crossing at $1.12547. First support is the 20-day moving average crossing at 1.09933. Second support is the 50-day moving average crossing at 1.09354.
The September British Pound was higher overnight as it extends the rally off March's low. Overnight trading and sets the stage for a higher opening when the day session begins trading. Stochastics and the RSI are overbought but remain neutral to bullish signaling that sideways to higher prices near-term. If September extends the rally off May's low, the 75% retracement level of the 2022-2023 decline crossing at 1.3253 is the next upside target. Closes below the 20-day moving average crossing at 1.2782 would signal that a short-term top has been posted. First resistance is the overnight high crossing at 1.3083. Second resistance is the 75% retracement level of the 2022-2023 decline crossing at 1.3253. First support is the 20-day moving average crossing at 1.2782. Second support is the 50-day moving average crossing at 1.2620.
The September Swiss Franc was higher overnight as it extends the rally off May's low. Overnight trading sets the stage for a higher opening when the day session begins trading. Stochastics and the RSI are overbought but remain neutral to bullish signaling that sideways to higher prices are possible near-term. If September extends the rally off May's low, the January 2021 high crossing at 1.17430 is the next upside target. Closes below the 20-day moving average crossing at 1.13169 would signal that a short-term top has been posted. First resistance is the overnight high crossing at 1.16855. Second resistance is the January 2021 high crossing at 1.17430. First support is the 10-day moving average crossing at 1.11220. Second support is the 20-day moving average crossing at 1.11257.
The September Canadian Dollar was higher overnight and sets the stage for a higher opening when the day session begins trading. Stochastics and the RSI are neutral to bullish signaling that sideways to higher prices are possible near-term. If September extends the rally off last-Friday's low, the 38% retracement level of the 2022-2023 decline crossing at $76.28 is the next upside target. Closes below the 10-day moving average crossing at $75.55 would signal that a short-term top has been posted. First resistance is the 38% retracement level of the 2022-2023 decline crossing at $76.28. Second resistance is the September-12th -2022 high crossing at $77.11. First support is the 10-day moving average crossing at $75.55. Second support is the 50-day moving average crossing at $74.92.
The September Japanese Yen was slightly lower overnight as it consolidates some of the rally off May's low. Overnight trading sets the stage for a slightly lower opening when the day session begins trading. Stochastics and the RSI are overbought but remain neutral to bullish signaling that sideways to higher prices are possible near-term. If September extends the rally off May's low, the 38% retracement level of the January-July decline crossing at 0.074017 is the next upside target. Closes below the 10-day moving average crossing at 0.071059 would signal that a short-term top has been posted. First resistance is June's high crossing at 0.073430. Second resistance is the 38% retracement level of the January-June decline crossing at 0.074017. First support is the 10-day moving average crossing at 0.071059. Second support is July's low crossing at 0.069755.
PRECIOUS METALS http://quotes.ino.com/ex changes/?c=metals"
Precious Metals: Augustgold was slightly higher overnight and sets the stage for a slightly higher opening when the day session begins trading later this morning. Stochastics and the RSI are overbought but remain neutral to bullish signaling that sideways to higher prices are possible near-term. If August extends the rally off June's low, the 50-day moving average crossing at $1978.10 is the next upside target. Closes below the 10-day moving average crossing at $1934.40 would signal that a short-term top has been posted. First resistance is the 50-day moving average crossing at $1978.10. Second resistance is June's high crossing at $2000.70. First support is the 50% retracement level of the September-May rally crossing at $1892.30. Second support is the 62% retracement level of the September-May rally crossing at $1842.60.
September silver was steady to slightly higher overnight and sets the stage for a slightly higher opening when the day session begins trading later this morning. Stochastics and the RSI are overbought but remain neutral to bullish signaling that sideways to higher prices are possible near-term. If July extends the rally off June's low, June's high crossing at $24.835 is the next upside target. Closes below the 20-day moving average crossing at $23.384 would signal that a short-term top has been posted. First resistance is June's high crossing at $24.835. Second resistance is May's high crossing at $26.630. First support is the 75% retracement level of the March-April rally crossing at 21.982. Second support is the 87% retracement level of the March-April rally crossing at 21.233.
September copper was higher overnight and sets the stage for a higher opening when the day session begins trading. Stochastics and the RSI are neutral to bullish signaling that sideways to higher prices are possible near-term. If September extends the rally off the June 29th low, June's high crossing at 3.9640 is the next upside target. Closes below the 10-day moving average crossing at 3.7834 would signal that a short-term top has been posted. First resistance June's high crossing at 3.9640. Second resistance is May's high crossing at 4.0100. First support is the June 29th low crossing at 3.6830. Second support is May's low crossing at 3.5650.
GRAINS http://quotes.ino.com/ex changes/?c=grains
Grains: December corn was higher overnight as it consolidates some of Wednesday's sharp loss following a bearish WASDE supply-demand report. Overnight trading sets the stage for a higher opening when the day sessions begins trading. Stochastics and the RSI are oversold but remain bearish signaling that sideways to lower prices are possible near-term. If December extends the decline off the June 21st high, the September 2022 low crossing at $4.62 1/2 is the next downside target. Closes above the 50-day moving average crossing at $5.30 3/4 would signal that a short-term low has been posted. First resistance is the 50-day moving average crossing at $5.30 3/4. Second resistance is the 20-day moving average crossing at $5.41 1/4. First support is the overnight low crossing at $4.81. Second support is the September 2022 low crossing at $4.62 1/2.
September wheat was slightly higher overnight as it consolidates some of Wednesday's decline. Overnight trading sets the stage for a slightly higher opening when the day session begins trading. Stochastics and the RSI are oversold but remain neutral to bearish signaling that sideways to lower prices are possible near-term. If September extends the decline off June's high, May's low crossing at $5.87 3/4 is the next downside target. Closes above the 20-day moving average crossing at $6.79 1/2 would signal that a short-term low has been posted. First resistance is the 20-day moving average crossing at $6.79 1/2. Second resistance is June's high crossing at $7.70 1/4. First support is the overnight low crossing at $6.22. Second support is May's low crossing at $5.87 3/4.
September Kansas City wheat was higher overnight and working on a possible inside day as it consolidates some of Wednesday's loss. Overnight trading sets the stage for a higher opening when the day session begins trading later this morning. Stochastics and the RSI remain neutral to bearish signaling that sideways to lower prices are possible near-term. If September extends the decline off last-Thursday's high, July's low crossing at $7.87 1/4 is the next downside target. Closes above the 20-day moving average crossing at $8.26 1/4 would signal that a short-term low has been posted. First resistance is last-Thursday's high crossing at $8.55 3/4. Second resistance is June's high crossing at $8.89 1/2. First support is July's low crossing at $7.87 1/4. Second support is the June 14th low crossing at $7.76 3/4.
September Minneapolis wheat was higher overnight and is working on a possible inside day as it consolidates some of Wednesday's loss. Overnight trading sets the stage for a higher opening when the day session begins trading. Stochastics and the RSI are neutral to bullish signaling that sideways to higher prices are possible near-term. If September extends the rally off July's low, June's high crossing at $8.94 1/2 is the next upside target. Closes below the 50-day moving average crossing at $8.32 1/2 would temper the near-term friendly outlook. First resistance is Wednesday's high crossing at $8.71 1/2. Second resistance is June's high crossing at $8.94 1/2. First support is the 50-day moving average crossing at $8.32 1/4. Second support is July's low crossing at $8.07 1/4.
SOYBEAN COMPLEX? http://quotes.ino.com/ex?changes/?c=grains "
November soybeans were higher overnight and sets the stage for a higher opening when the day session begins trading later this morning. Stochastics and the RSI are neutral to bullish signaling that sideways to higher prices are possible near-term. If November renews the rally off May's low, the 87% retracement level of the 2022-2023 decline crossing at $14.07 1/2 is the next upside target. Closes below the 20-day moving average crossing at $13.24 would signal that a short-term top has been posted. First resistance is the 87% retracement level of the 2022-2023 decline crossing at $14.07 1/2. Second resistance is the December 2022 high crossing at $14.27 3/4. First support is the 20-day moving average crossing at $13.24. Second support is the 50-day moving average crossing at $12.55 1/2.
December soybean meal was higher overnight as it consolidates some of Wednesday's loss. Overnight trading sets the stage for a higher opening when the day session begins trading. Stochastics and the RSI are turning neutral to bullish signaling that sideways to higher prices are possible near-term. If December renews the rally off the June 29th low, the 75% retracement level of the March-May decline crossing at $418.80 is the next upside target. If December resumes the decline off July's high, the June 29th low crossing at $374.60 is the next downside target. First resistance is the 75% retracement level of the March-May decline crossing at $418.80. Second resistance is the June 21st high crossing at $432.60. First support is the June 29th low crossing at $374.60. Second support is the June 14th low crossing at $372.80.
December soybean oil was sharply higher overnight as it extends the trading range of the past two-weeks. Overnight strength sets the stage for a higher opening when the day session begins trading. Stochastics and the RSI are neutral to bullish signaling that sideways to higher prices are possible near-term. If December renews the rally off May's low, the 75% retracement level of the 2022-2023 decline crossing at 65.45 is the next upside target. Closes below the 20-day moving average crossing at 57.54 would signal that a short-term top has been posted. First resistance is the 62% retracement level of the 2022-2023 decline crossing at 61.75. Second resistance is the 75% retracement level of the 2022-2023 decline crossing at 65.45. First support is the 20-day moving average crossing at 57.54. Second support is the June 29th low crossing at 54.67.
Thanks tallpine
Sorry for the delay.
Thanks too tallpine!
Rains shutting down in the northwest half of the belt for the rest of the month are causing the huge move up today.
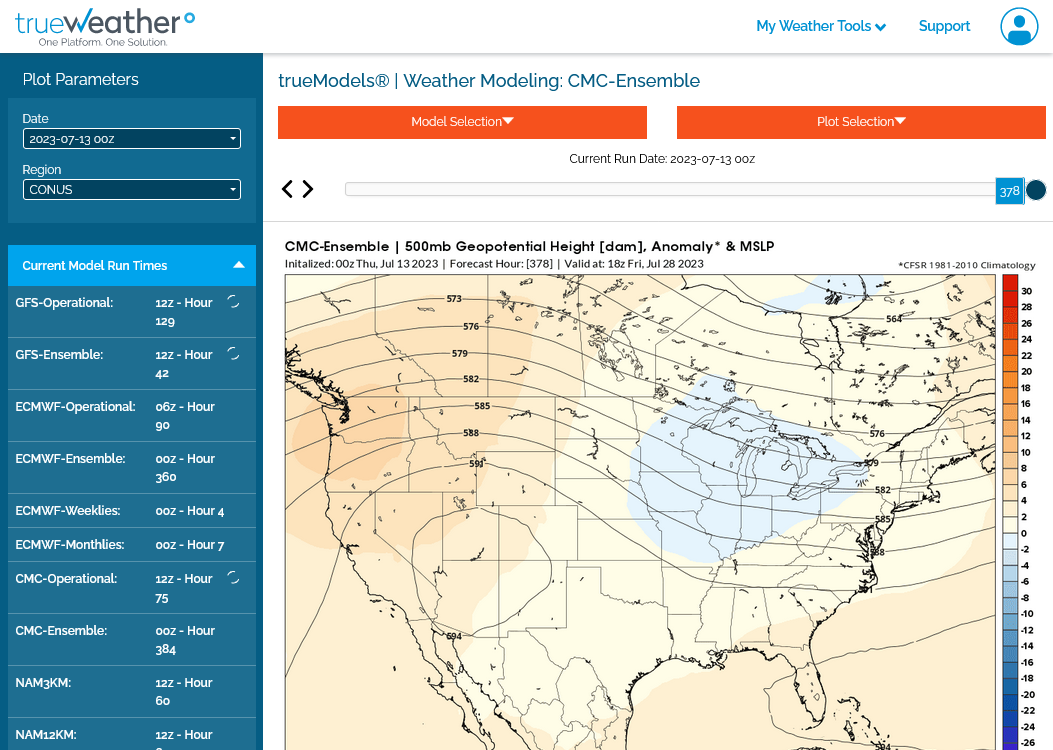
This is the EE at 2 weeks. The dome is parked pretty far southwest with northwest flow but northwest flow is tricky.
With no Bermuda high to pump in the moisture in this case, weather disturbances tracking over the dome and into the Midwest will struggle to be productive
![]()
https://ir.eia.gov/ngs/ngs.html
for week ending July 7, 2023 | Released: July 13, 2023 at 10:30 a.m. | Next Release: July 20, 2023
+49 Bcf
| Working gas in underground storage, Lower 48 states Summary textCSVJSN | |||||||||||||||||||||||||
|---|---|---|---|---|---|---|---|---|---|---|---|---|---|---|---|---|---|---|---|---|---|---|---|---|---|
| Historical Comparisons | |||||||||||||||||||||||||
| Stocks billion cubic feet (Bcf) | Year ago (07/07/22) | 5-year average (2018-22) | |||||||||||||||||||||||
| Region | 07/07/23 | 06/30/23 | net change | implied flow | Bcf | % change | Bcf | % change | |||||||||||||||||
| East | 653 | 643 | 10 | 10 | 498 | 31.1 | 547 | 19.4 | |||||||||||||||||
| Midwest | 724 | 705 | 19 | 19 | 583 | 24.2 | 619 | 17.0 | |||||||||||||||||
| Mountain | 180 | 173 | 7 | 7 | 142 | 26.8 | 158 | 13.9 | |||||||||||||||||
| Pacific | 225 | 216 | 9 | 9 | 248 | -9.3 | 266 | -15.4 | |||||||||||||||||
| South Central | 1,147 | 1,144 | R | 3 | 3 | 890 | 28.9 | 976 | 17.5 | ||||||||||||||||
| Salt | 323 | 329 | R | -6 | -6 | 223 | 44.8 | 272 | 18.8 | ||||||||||||||||
| Nonsalt | 824 | 816 | 8 | 8 | 667 | 23.5 | 704 | 17.0 | |||||||||||||||||
| Total | 2,930 | 2,881 | R | 49 | 49 | 2,361 | 24.1 | 2,566 | 14.2 | ||||||||||||||||
| R=Revised. The reported revision caused the stocks for June 30, 2023 to change from 2,877 Bcf to 2,881 Bcf. As a result, the implied net change between the weeks ending June 23 and June 30 changed from 72 Bcf to 76 Bcf. Totals may not equal sum of components because of independent rounding. | |||||||||||||||||||||||||
Working gas in storage was 2,930 Bcf as of Friday, July 7, 2023, according to EIA estimates. This represents a net increase of 49 Bcf from the previous week. Stocks were 569 Bcf higher than last year at this time and 364 Bcf above the five-year average of 2,566 Bcf. At 2,930 Bcf, total working gas is within the five-year historical range.
For information on sampling error in this report, see Estimated Measures of Sampling Variability table below.

+++++++++++++
Market is down, EE was -6 CDDs over night. Right bottom purple line. 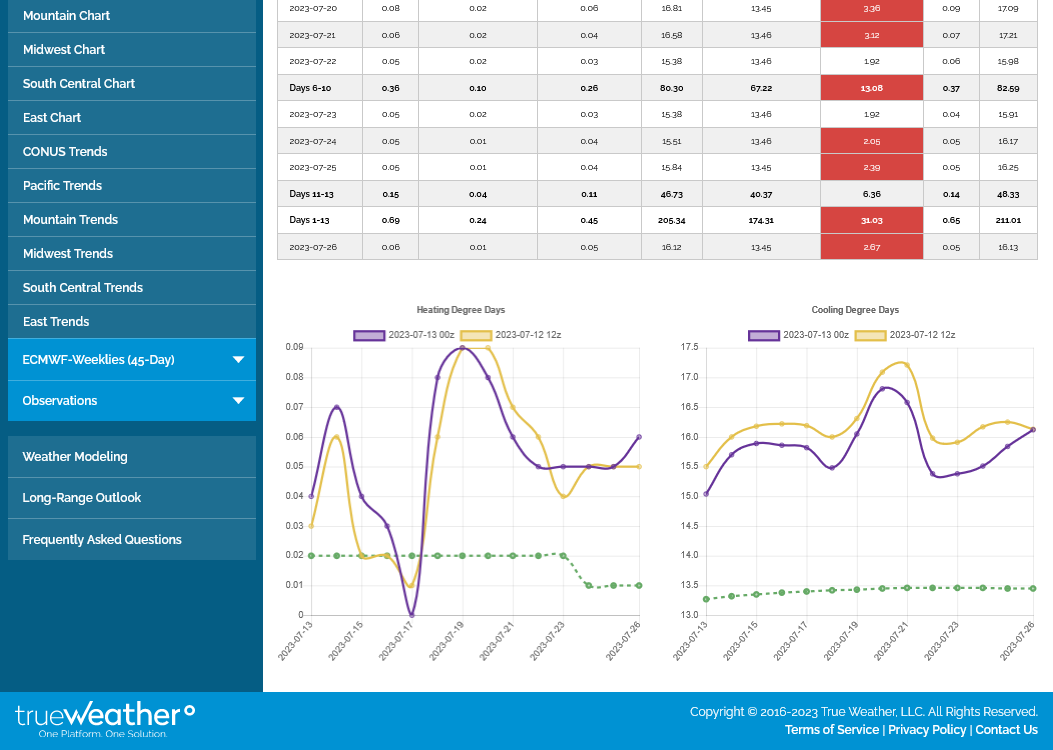
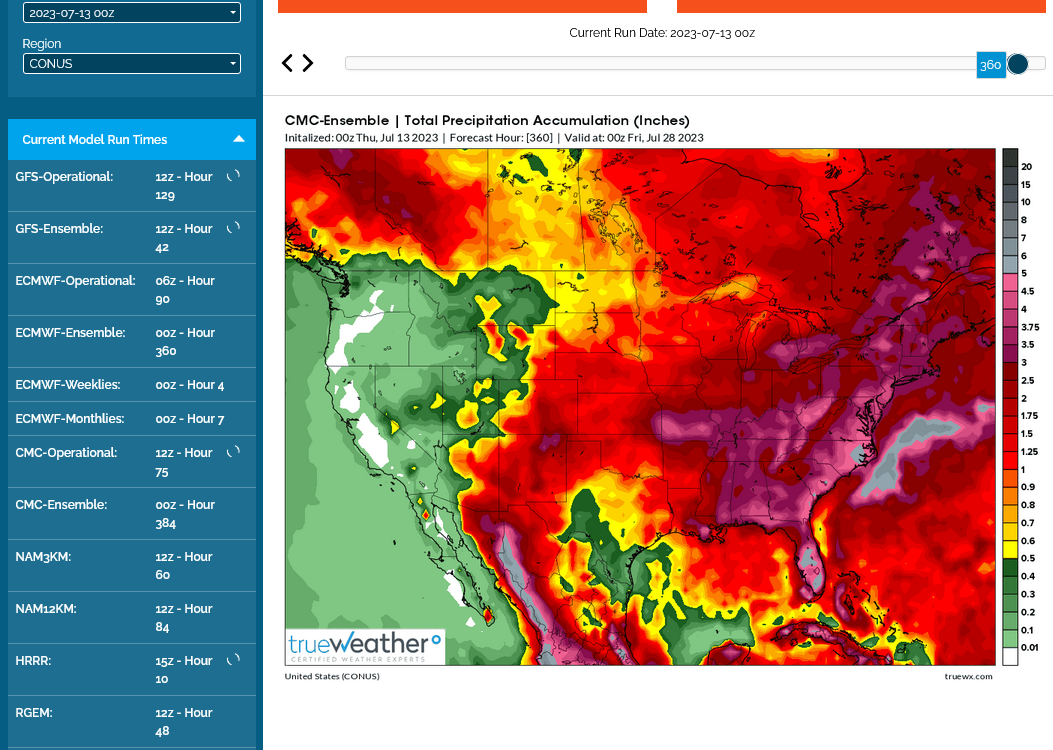
Again, here's those low rain amounts for the Upper Midwest/N.Plains(WCB) we've been discussing this week. See the 7 day totals on the last map.
https://www.marketforum.com/forum/topic/83844/#83848
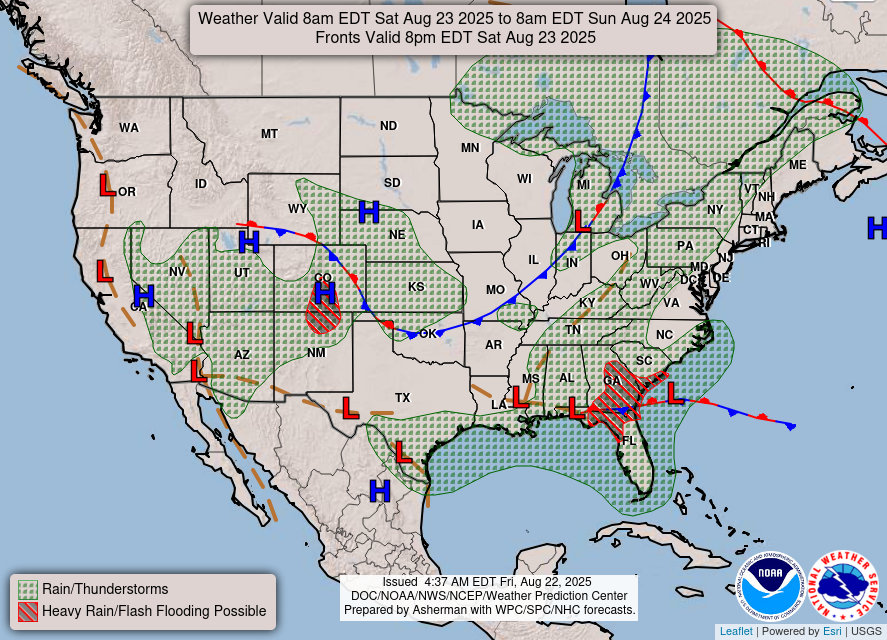
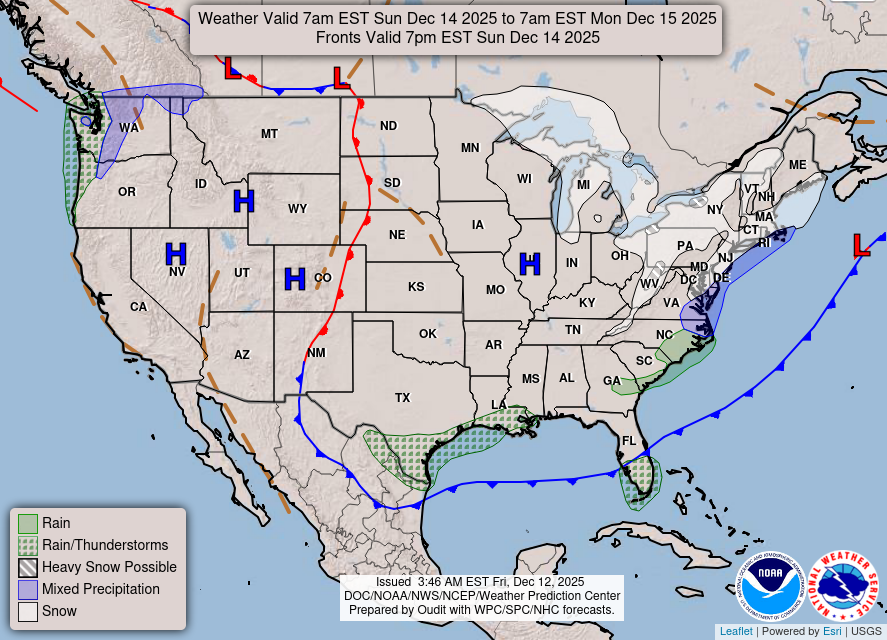
Weather map now.
In 24 hours and
In 48 hours.
https://www.wpc.ncep.noaa.gov/#

+++++++++++++++++++++++++++++++++++++++++++++++++
Surface Weather maps for days 3-7 below:
https://www.wpc.ncep.noaa.gov/medr/medr.shtml

+++++++++++++++++++++++++++++++++++++++++++
The latest 7 day precip forecasts are below.
Day 1 below:
http://www.wpc.ncep.noaa.gov/qpf/fill_94qwbg.gif?1526306199054

Day 2 below:
http://www.wpc.ncep.noaa.gov/qpf/fill_98qwbg.gif?1528293750112

Day 3 below:
http://www.wpc.ncep.noaa.gov/qpf/fill_99qwbg.gif?1528293842764

Days 4-5 below:
http://www.wpc.ncep.noaa.gov/qpf/95ep48iwbg_fill.gif?1526306162

Days 6-7 below:
http://www.wpc.ncep.noaa.gov/qpf/97ep48iwbg_fill.gif?1526306162

7 Day Total precipitation below:
http://www.wpc.ncep.noaa.govcdx /qpf/p168i.gif?1530796126

Another item that I just noticed on this model.
It shows the positive anomalies shifting into the Midwest at the end of 2 weeks.
This could be a signal that the heat dome will be moving in.
GFS ensemble mean anomalies at 2 weeks.
https://www.psl.noaa.gov/map/images/ens/z500anom_nh_alltimes.html 
2 week 850 temp for ensemble mean anomaly
https://www.psl.noaa.gov/map/images/ens/t850anom_nh_alltimes.html
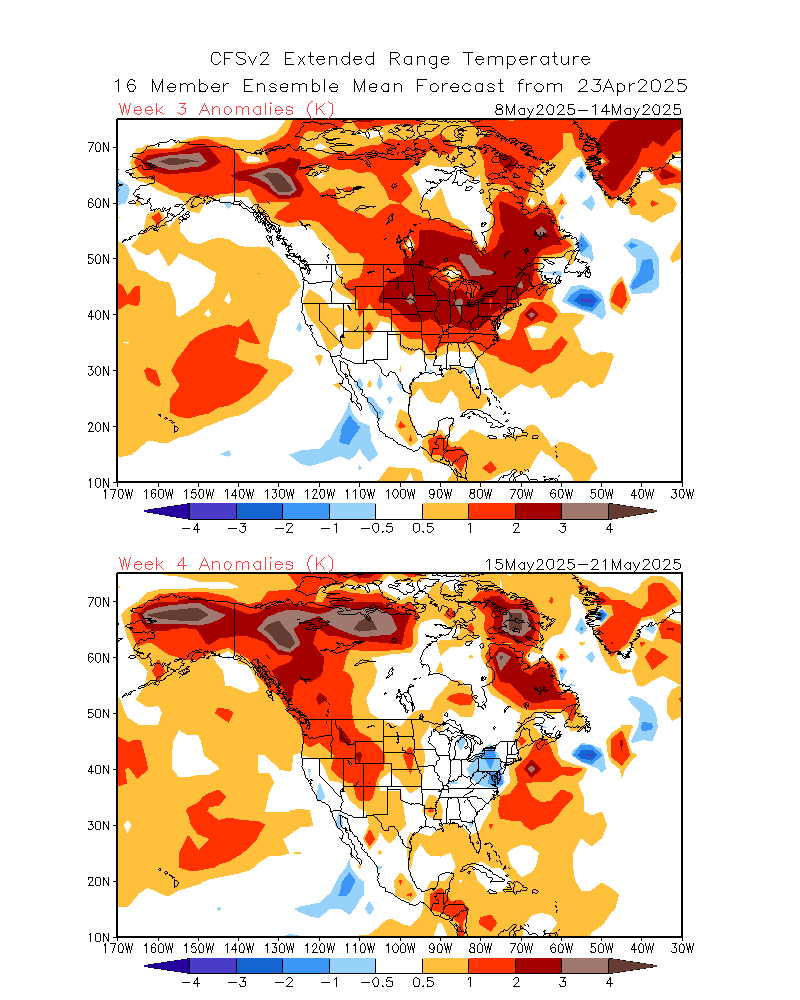
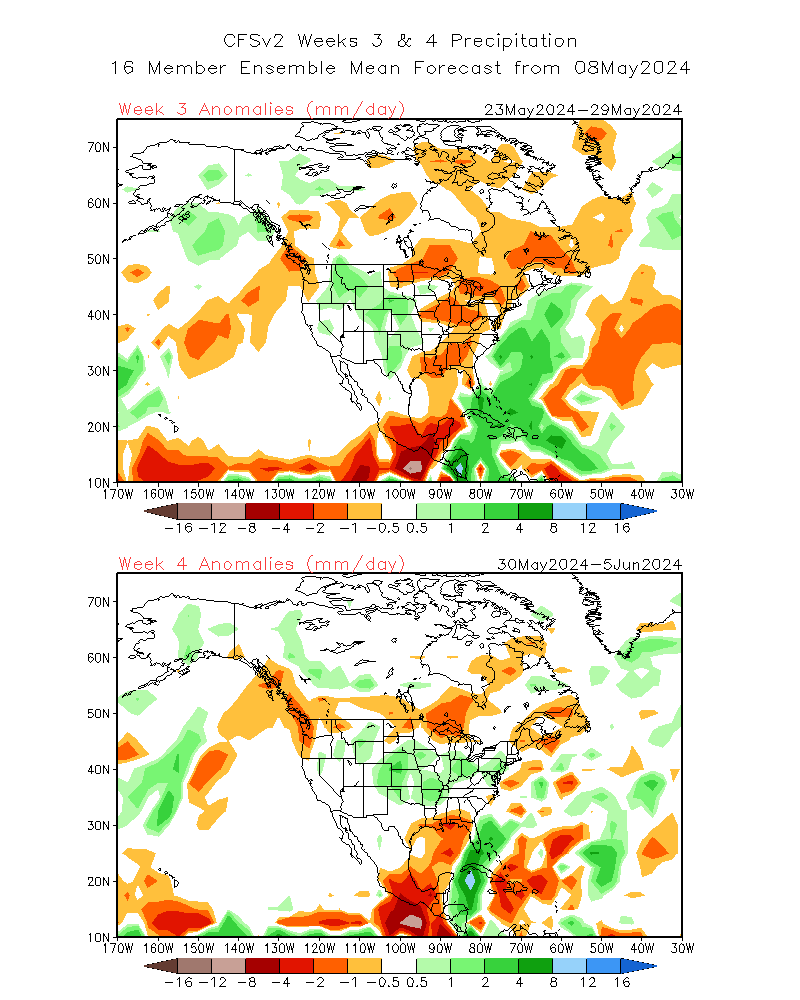
The week 3-4 CFS model with low skill says the opposite about the heat.
Week 3-4 forecasts don't have a great deal of skill.
https://www.cpc.ncep.noaa.gov/products/people/mchen/CFSv2FCST/weekly/
Temperatures below. These maps are 1 day old.
Precip below..