KEY EVENTS TO WATCH FOR:
Friday, May 26, 2023
8:30 AM ET. April Personal Income and Outlays
Personal Income, M/M% (previous +0.3%)
Consumer Spending, M/M% (previous +0%)
PCE Price Idx, M/M% (previous +0.1%)
PCE Price Idx, Y/Y% (previous +4.2%)
PCE Core Price Idx, M/M% (previous +0.3%)
PCE Core Price Idx, Y/Y% (previous +4.6%)
8:30 AM ET. April Advance Report on Durable Goods
Durable Goods-SA, M/M% (previous +3.2%)
Dur Goods, Ex-Defense, M/M% (previous +3.5%)
Dur Goods, Ex-Transport, M/M% (previous +0.3%)
Orders: Cap Gds, Non-Def, Ex-Air, M/M% (previous -0.4%)
Shipments: Cap Gds, Non-Def, Ex-Air, M/M% (previous -0.4%)
8:30 AM ET. April Advance Economic Indicators Report
10:00 AM ET. May University of Michigan Survey of Consumers - final
End-Mo Sentiment Idx (previous 63.5)
End-Mo Expectations Idx (previous 60.5)
12-Month Inflation Forecast (previous 4.6%)
5-Year Inflation Forecast (previous 3.0%)
End-Mo Current Idx (previous 68.2)
The STOCK INDEXES? http://quotes.ino.com/ex?changes/?c=indexes
The Dow closed lower on Thursday as it extends this week's decline.Today's mid-range close sets the stage for a steady to lower opening when Friday's day session begins trading. Stochastics and the RSI are oversold but remain neutral to bearish signaling that sideways to lower prices are possible near-term. Wednesday's close below the May 4th low crossing at 32,937.50 has opened the door for additional weakness near-term. Closes above the 20-day moving average crossing at 33,399.48 would signal that a short-term low has been posted. First resistance is the 20-day moving average crossing at 33,399.48. Second resistance is May's high crossing at 34,257.83. First support is the 38% retracement level of the 2022 rally crossing at 32,399.25. Second support is the March 24th low crossing at 31,805.18.
The June NASDAQ 100 closed sharply higher on Thursday and posted a new high for the year. The high-range close sets the stage for a steady to higher opening when Friday's day session begins trading. Stochastics and the RSI are overbought but are turning neutral to bullish signaling sideways to higher prices are possible. If June extends this year's rally, the 75% retracement level of the 2022-decline crossing at 14,245.67 is the next upside target. Closes below the 20-day moving average crossing at 13,486.11 would signal that a short-term top has been posted. First resistance is today's high crossing at 14,031.25. Second resistance is the 75% retracement level of the 2022-decline crossing at 14,245.01. First support is the 20-day moving average crossing at 13,486.11. Second support is the 50-day moving average crossing at 13,199.73.
The June S&P 500 closed higher on Thursday. The high-range close sets the stage for a steady to higher opening when Friday's day session begins trading. Stochastics and the RSI are neutral to bearish signaling that sideways to lower prices are possible near-term. Closes below the 50-day moving average crossing at 4117.05 would confirm that a short-term top has been posted. If June renews the rally off March's low, the February 14th high crossing at 4223.00 is the next upside target. First resistance is last-Friday's high crossing at 4227.25. Second resistance is the February 14th high crossing at 4223.00. First support is the 50-day moving average crossing at 4117.08. Second support is May's low crossing at 4062.25.
INTEREST RATES? http://quotes.ino.com/ex?changes/?c=interest ""
June T-bonds closed down 1-03/32's at 125-15.
June T-bonds closed sharply lower on Thursday as it extends the decline off April's high. The low-range close sets the stage for a steady to lower opening when Friday's day session begins trading. Stochastics and the RSI are oversold but remain neutral to bearish signaling that sideways to lower prices are possible near-term. If June extends the decline off April's high, the 62% retracement level of the October-January rally crossing at 124-11 is the next upside target. Closes above the 20-day moving average crossing at 129-13 would confirm that a short-term low has been posted. First resistance is the 10-day moving average crossing at 127-29. Second resistance is the 20-day moving average crossing at 129-13. First support is the 62% retracement level of the October-January rally crossing at 124-11. Second support is March's low crossing at 122-22.
June T-notes closed down 280-pts. At 112.175.
June T-notes closed sharply lower on Thursday as it extends this month's decline. The low-range close sets the stage for a steady to lower opening when Friday's day session begins trading. Stochastics and the RSI are oversold but remain neutral to bearish signaling that sideways to lower prices are possible near-term. If June extends the decline off May's high, the 62% retracement level of the 2022-2023 rally crossing at 112.157 is the next downside target. Closes above the 50-day moving average crossing at 115.019 would signal that a short-term low has been posted. First resistance is the 10-day moving average crossing at 114.023. Second resistance is the 20-day moving average crossing at 114.264. First support is the 62% retracement level of the 2022-2023 rally crossing at 112.157. Second support is the 75% retracement level of the 2022-2023 rally crossing at 111.165.
ENERGY MARKETS? http://quotes.ino.com/ex?changes/?c=energy ""
July crude oil closed sharply lower on Thursday as it consolidated some of this month's rally. The low-range close sets the stage for a steady to lower opening when Friday's day session begins. Stochastics and the RSI are overbought and are turning neutral to bearish signaling that sideways to lower prices are possible near-term. If July extends today's decline, the May 15th low crossing at $69.39 is the next downside target. Closes above the 50-day moving average crossing at $74.45 would confirm that a short-term low has been posted. First resistance is the 50-day moving average crossing at $74.45. Second resistance is the April 28th high crossing at $76.74. First support is the May 15th low crossing at $69.39. Second support is the March 24th low crossing at $67.04.
July heating oil closed lower on Thursday. The low-range close sets the stage for a steady to lower opening when Friday's day trading session begins. Stochastics and the RSI are turning neutral to bearish signaling that sideways to lower prices are possible near-term. Closes below last-Monday's low crossing at $2.2739 would signal that a short-term top has been posted. If July extends this month's rally, the 50-day moving average crossing at $2.4567 is the next upside target. First resistance is the 50-day moving average crossing at $2.4567. Second resistance is April's high crossing at $2.6760. First support is last-Monday's low crossing at $2.2739. Second support is the May 4th low crossing at $2.1550.
July unleaded gas closed lower on Thursday as it consolidates some of this month's rally. The mid-range close sets the stage for a steady to lower opening when Friday's day session begins trading. Stochastics and the RSI are overbought but remain neutral to bullish signaling that sideways to higher prices are possible near-term. If July extends the rally off May's low, the 75% retracement level of the April-May decline crossing at 2.6308 is the next upside target. Closes below the 20-day moving average crossing at 2.4520 would signal that a short-term top has been posted. First resistance is the 75% retracement level of the April-May decline crossing at 2.6803. Second resistance is the 87% retracement level crossing at 2.6979. First support is the 50-day moving average crossing at 2.5196. Second support is the 20-day moving average crossing at 2.4520.
July Henry natural gas closed lower on Thursday as it extends the decline off last-Friday's high. The low-range close sets the stage for a steady to lower opening when Friday's day session begins trading. Stochastics and the RSI are neutral to bearish signaling that sideways to lower prices are possible near-term. If July renews the decline off March's high, May's low crossing at 2.233 is the next downside target. If July resumes this month's rally, the 25% retracement level of the 2022-2023 decline crossing at 3.189 is the next upside target. First resistance is last-Friday's high crossing at 2.816. Second resistance is the 25% retracement level of the 2022-2023 decline crossing at 3.189. First support is the May 12th low crossing at 2.310. Second support is the May 5th low crossing at 2.233.
CURRENCIES? http://quotes.ino.com/ex?changes/?c=currencies ""
The June Dollar closed higher on Thursday and above the 25% retracement level of the September-February decline crossing at $103.586. The high-range close sets the stage for a steady to higher opening when Friday's session begins trading. Stochastics and the RSI are overbought but remain neutral to bullish signaling that sideways to higher prices are possible near-term. If June extends the rally off May's low, the March 15th high crossing at 104.720 is the next upside target. Closes below the 20-day moving average crossing at 102.248 would signal that a short-term top has been posted. First resistance is the March 15th high crossing at 104.720. Second resistance is the March 8t high crossing at 105.490. First support is the 10-day moving average crossing at 103.091. Second support is the 20-day moving average crossing at 101.247.
The June Euro closed lower on Thursday as it extends this month's decline. The low-range close sets the stage for a steady to lower opening when Friday's day session begins trading. Stochastics and the RSI are oversold but remain neutral to bearish signaling that sideways to lower prices is possible near-term. If June extends this month's decline, the 38% retracement level of the 2022-2023 rally crossing at $1.05914 is the next downside target. Closes above the 50-day moving average crossing at $1.09030 would signal that a short-term low has been posted. First resistance is the 10-day moving average crossing at $1.08258. Second resistance is the 50-day moving average crossing at 1.09030. First support is the overnight low crossing at $1.09665. Second support is the 38% retracement level of the 2022-2023 rally crossing at $1.05914.
The June British Pound closed lower on Thursday as it extends this month's decline. The low-range close sets the stage for a steady to lower opening when Friday's day session begins trading. Stochastics and the RSI are oversold but remain neutral to bearish signaling sideways to lower prices are possible near-term. If June extends the decline off May's high, April's low crossing at 1.2293 is the next downside target. Closes above the 20-day moving average crossing at 1.2511 would signal that a short-term low has been posted. First resistance is the 20-day moving average crossing at 1.2511. Second resistance is May's high crossing at 1.2692. First support is the April 10th low crossing at 1.2364. Second support is April's low crossing at 1.2293.
The June Swiss Franc closed lower on Thursday. The low-range close sets the stage for a steady to lower opening when Friday's day session begins trading. Stochastics and the RSI are oversold but remain neutral to bearish signaling that sideways to lower prices are possible near-term. If June extends this month's decline, the April 3rd low crossing at 1.09640 is the next downside target. Closes above the 20-day moving average crossing at 1.12131 would signal that a short-term low has been posted. First resistance is the 20-day moving average crossing at 1.12131. Second resistance is the May 4th high crossing at 1.13940. First support is the April 10th low crossing at 1.10495. Second support is the April 3rd low crossing at 1.09640.
The June Canadian Dollar closed lower on Thursday as it extends this month's decline. The low-range close sets the stage for a steady to lower opening when Friday's day session begins trading. Stochastics and the RSI are neutral to bearish signaling that sideways to lower prices are possible near-term. If June extends this month's decline, April's low crossing at 73.23 is the next downside target. Closes above the 20-day moving average crossing at 74.13 would signal that a short-term low has been posted. First resistance is the 20-day moving average crossing at 74.13. Second resistance is May's high crossing at 75.18. First support is April's low crossing at 73.23. Second support is the 75% retracement level of the March-April rally crossing at 73.02.
The June Japanese Yen closed lower on Thursday as it extends the decline off January's high. The low-range close sets the stage for a steady to lower opening when Friday’s day session begins trading. Stochastics and the RSI are oversold but remain neutral to bearish signaling that sideways to lower prices are possible near-term. If June extends the decline off March's high, the 75% retracement level of the October-January rally crossing at 0.071337 is the next downside target. Closes above the 20-day moving average crossing at 0.073600 would signal that a short-term low has been posted. First resistance is the 20-day moving average crossing at 0.073600. Second resistance is the 50-day moving average crossing at 0.075133. First support is the 75% retracement level of the October-January rally crossing at 0.071337. Second support is the 87% retracement level of the October-January rally crossing at 0.069908.
PRECIOUS METALS? http://quotes.ino.com/ex?changes/?c=metals ""
June gold closed sharply lower on Thursday as it renewed the decline off May's high. The low-range close sets the stage for a steady to lower opening when Friday's day session begins trading. Stochastics and the RSI are oversold but remain neutral to bearish signaling that sideways to lower prices are possible near-term. If June extends this month's decline, the 38% retracement level of the 2022-2023 rally crossing at $1925.20. Closes above the 20-day moving average crossing at $2004.20 would signal that a short-term low has been posted. First resistance is the 20-day moving average crossing at $2004.20. Second resistance is May's high crossing at $2085.40. First support is the 38% retracement level of the 2022-2023 rally crossing at $1925.20. Second support is the 50% retracement level of the 2022-2023 rally crossing at $1873.90.
July silver closed lower on Thursday as it extended this month's decline. The low-range close sets the stage for a steady to lower opening when Friday's day session begins trading. Stochastics and the RSI are oversold but remain neutral to bearish signaling that sideways to lower prices are possible near-term. If July extends this month's decline, the 62% retracement level of the March-May rally crossing at 22.541 is the next downside target. Closes above the 20-day moving average crossing at 24.660 would signal that a short-term low has been posted. First resistance is the 20-day moving average crossing at 24.660. Second resistance is May's high crossing at 26.435. First support is the 62% retracement level of the March-May rally crossing at 22.541. Second support is the 75% retracement level of the March-May rally crossing at 21.705.
July copper closed higher on Thursday as it consolidates some of the decline off April's high. The mid-range close sets the stage for a steady to higher opening when Friday's day session begins trading. Stochastics and the RSI are oversold but remain neutral to bearish signaling that sideways to lower prices are possible near-term. If July extends the decline off April's high, the 75% retracement level of the 2022-2023 rally crossing at 3.4383 is the next downside target. Closes above the 20-day moving average crossing at 3.7738 would signal that a low has been posted. First resistance is the 10-day moving average crossing at 3.6816. Second resistance is the 20-day moving average crossing at 3.7738. First support is the 75% retracement level of the 2022-2023 rally crossing at 3.4683. Second support is the 87% retracement level of the 2022-2023 rally crossing at 3.3261.
GRAINS? http://quotes.ino.com/ex?changes/?c=grains "
July Corn closed up $0.03 1/2-cents at $5.90 3/4.
July corn closed higher on Thursday as it extends the rally off last-Thursday's low. The high-range close sets the stage for a steady to higher opening when Friday's night session begins trading. Stochastics and the RSI are neutral to bullish signaling that sideways to higher prices are possible near-term. If July extends this week's rally, the 50-day moving average crossing at $6.06 1/4 is the next upside target. If July renews the decline off April's high, the November-2021 low crossing at $5.41 1/2 is the next downside target. First resistance is the May 8th high crossing at $6.00. Second resistance is the 50-day moving average crossing at $6.06 1/4. First support is last-Thursday's low crossing at $5.47. Second support is the November-2021 low crossing at $5.41 1/2.
July wheat closed down $0.02-cents at $6.04 1/4.
July wheat closed lower on Thursday as it extends this week's trading range. The mid-range close sets the stage for a steady to lower opening when Friday's day session begins trading. Stochastics and the RSI are turning neutral to bullish signaling signaling that sideways to higher prices are possible near-term. Closes above the 20-day moving average crossing at $6.29 3/4 would signal that a short-term low has been posted while opening the door for additional short-covering gains. If July extends the decline off February's high, the March-2021 low crossing at $5.71 is the next downside target. First resistance is the 20-day moving average crossing at $6.29 3/4. Second resistance is the 50-day moving average crossing at $6.65 3/4. First support is Tuesday's low crossing at $5.94 1/4. Second support is the March-2021 low crossing at $5.71.
July Kansas City Wheat closed up $0.05 3/4-cents at $8.18.
July Kansas City wheat closed higher on Thursday as it consolidates some of the decline off May's high. The mid-range close sets the stage for a steady to higher opening when Friday's day session begins trading. Stochastics and the RSI are neutral to bearish signaling that sideways to lower prices are possible near-term. If July extends this month's decline, the March 22nd low crossing at $7.80 3/4 is the next downside target. Closes above the 10-day moving average crossing at $8.53 1/2 would signal that a short-term low has been posted. First resistance is the 10-day moving average crossing at $8.53 1/2. Second resistance is May's high crossing at $9.18 3/4. First support is the March 22nd low crossing at $7.80 3/4. Second support is March's low crossing at $7.63 3/4.
July Minneapolis wheat closed up $0.06 1/2-cents crossing at $8.05 1/2.
July Minneapolis wheat closed higher on Thursday as it consolidates some of this month's decline. The mid-range close sets the stage for a steady to higher opening when Friday's day session begins trading. Stochastics and the RSI are neutral to bearish signaling that sideways to lower prices are possible near-term. If July extends this month's decline, May's low crossing at $8.69 is the next downside target. Closes above the 50-day moving average crossing at $8.46 3/4 would signal that a short-term low has been posted. First resistance is the 20-day moving average crossing at $8.26. Second resistance is the 50-day moving average crossing at $8.46 3/4. First support is Monday's low crossing at $7.93. Second support is May's low crossing at $8.69.
SOYBEAN COMPLEX? http://quotes.ino.com/ex?changes/?c=grains "
July soybeans closed down $0.00 1/2-cents at $13.24.
July soybeans closed fractionally lower on Thursday as it extends the trading range of the past five-days. The mid-range close sets the stage for a steady to lower opening when Friday's day session begins trading. Stochastics and the RSI are oversold but remain neutral to bearish signaling that sideways to lower prices are possible near-term. If July extends this month's decline, the July-22nd -2022 low crossing at $12.99 is the next downside target. Closes above the 20-day moving average crossing at $13.81 1/2 would signal that a low has been posted. First resistance is the 10-day moving average crossing at $13.44 1/2. Second resistance is the 20-day moving average crossing at $13.81 1/2. First support is Monday's low crossing at $13.04 3/4. Second support is the July-22nd -2022 low crossing at $12.99.
July soybean meal closed down $5.00 at $397.20.
July soybean meal closed lower on Thursday as it posted a new low for the year. The low-range close sets the stage for a steady to lower opening when Friday's day session begins trading. Stochastics and the RSI are oversold but remain neutral to bearish signaling that sideways to higher prices are possible near-term. If July extends the decline off March's high, the 50% retracement level of the 2020-2023 rally crossing at $388.80 is the next downside target. Closes above the 20-day moving average crossing at $421.20 would signal that a short-term low has been posted. First resistance is the 20-day moving average crossing at $421.20. Second resistance is the 50-day moving average crossing at $438.60. First support is today's low crossing at $395.60. Second support is the 50% retracement level of the 2020-2023 rally crossing at $388.80.
July soybean oil closed up 52-pts. at 48.52.
July soybean oil closed higher on Thursday. The high-range close sets the stage for a steady to higher opening when Friday's day session begins trading. Stochastics and the RSI are turning neutral to bullish signaling that sideways to higher prices are possible near-term. Closes above the 20-day moving average crossing at 50.27 would signal that a low has been posted. If July renews this month's decline, the 75% retracement level of the 2020-2022 rally crossing at 40.19 is the next downside target. First resistance is the 20-day moving average crossing at 50.27. Second resistance is the 50-day moving average crossing at 52.94. First support is last-Wednesday's low crossing at 45.75. Second support is the 75% retracement level of the 2020-2022 rally crossing at 40.19.
LIVESTOCKhttp://quotes.ino.com/exchanges/?c=livestock
July hogs closed down $3.83 at $77.00.
July hogs closed sharply lower on Thursday as it posted a new low for the year. The low-range close sets the stage for a steady to lower opening when Friday's day session begins trading. Stochastics and the RSI are oversold but remain neutral to bearish signaling that sideways to lower prices are possible near-term. If July extends this year's decline, weekly support on the continuation chart crossing at $76.26 is the next downside target. Closes above the 20-day moving average crossing at $85.93 would signal that a short-term low has been posted. First resistance is the 10-day moving average crossing at $83.62 Second resistance is the 20-day moving average crossing at $85.93. First support is today's low crossing at $77.00. Second support is weekly support on the continuation chart crossing at $76.26.
August cattle closed up $0.63 at $164.75.
August cattle closed higher on Thursday as it extends the rally off May's low. The high-range close sets the stage for a steady to higher opening on Friday. Stochastics and the RSI are overbought but remain neutral to bullish signaling that sideways to higher prices are possible near-term. If August extends the rally off May's low, the January-2014 high on the monthly continuation chart crossing at $171.65 is the next upside target. Closes below Wednesday's low crossing at $161.83 would signal that a double top with April's high has been posted. First resistance is April's high crossing at $165.05. Second resistance is the January-2014 high on the monthly continuation chart crossing at $171.65. First support is Wednesday's low crossing at $161.83. Second support is the 50-day moving average crossing at $161.30.
August Feeder cattle closed up $0.08 at $234.60.
August Feeder cattle closed higher on Thursday. The high-range close sets the stage for a steady to higher opening when Friday's day session begins trading. Stochastics and the RSI are overbought but remain neutral to bullish signaling that sideways to higher prices are possible near-term. If August extends the rally off May's low, the October-2014 high on the monthly continuation chart crossing at $245.20 is the next upside target. Closes below the 20-day moving average crossing at $229.27 would temper the near-term friendly outlook. First resistance is last-Friday's high crossing at $235.73. Second resistance is the October-2014 high on the monthly continuation chart crossing at $245.20. First support is the 20-day moving average crossing at $229.27. Second support is the 50-day moving average crossing at $224.95.
FOOD & FIBERhttp://quotes.ino.com/ex changes/?c=food
July coffee closed sharply lower on Thursday. The low-range close sets the stage for a steady to lower opening on Friday. Stochastics and the RSI are neutral to bearish signaling sideways to lower prices are possible near-term. Closes below May's low crossing at $18.06 would renew the decline off April's high thereby opening the door for additional weakness near-term. Closes above last-Friday's high crossing at $19.44 would confirm an upside breakout of the aforementioned trading range while opening the door for additional short covering gains. First resistance is last-Friday's high crossing at $19.44. Second resistance is April's high crossing at $20.49. First support is May's low crossing at $18.06. Second support is March's low crossing near $16.56.
July cocoa posted an inside day with a slightly higher close on Thursday. The high-range close sets the stage for a steady to higher opening on Friday. Stochastics and the RSI are neutral to bearish signaling that sideways to lower prices are possible near-term. If July extends the rally off March's low, monthly resistance crossing at 32.15 is the next upside target. Closes below the 20-day moving average crossing at 29.76 would signal that a short-term top has been posted.
July sugar closed sharply lower on Thursday and marked a downside breakout of the trading range of the past four-weeks, which crosses at 24.88. The low-range close sets the stage for a steady to lower opening on Friday. Stochastics and the RSI are neutral to bearish signaling that sideways to lower prices are possible near-term. If July extends today's decline, the 50-day moving average crossing at 23.90 is the next downside target. Closes above Tuesday's high crossing at 26.22 would signal that a short-term low has been posted.
July cotton closed lower for the fourth day in a row on Thursday. The low-range close sets the stage for a steady to lower opening on Friday. Stochastics and the RSI are bearish signaling sideways to lower prices are possible near-term. If July extends this week's decline, May's low crossing at 78.56 is the next downside target. Closes above the 10-day moving average crossing at 83.81 would signal that a low has been posted.
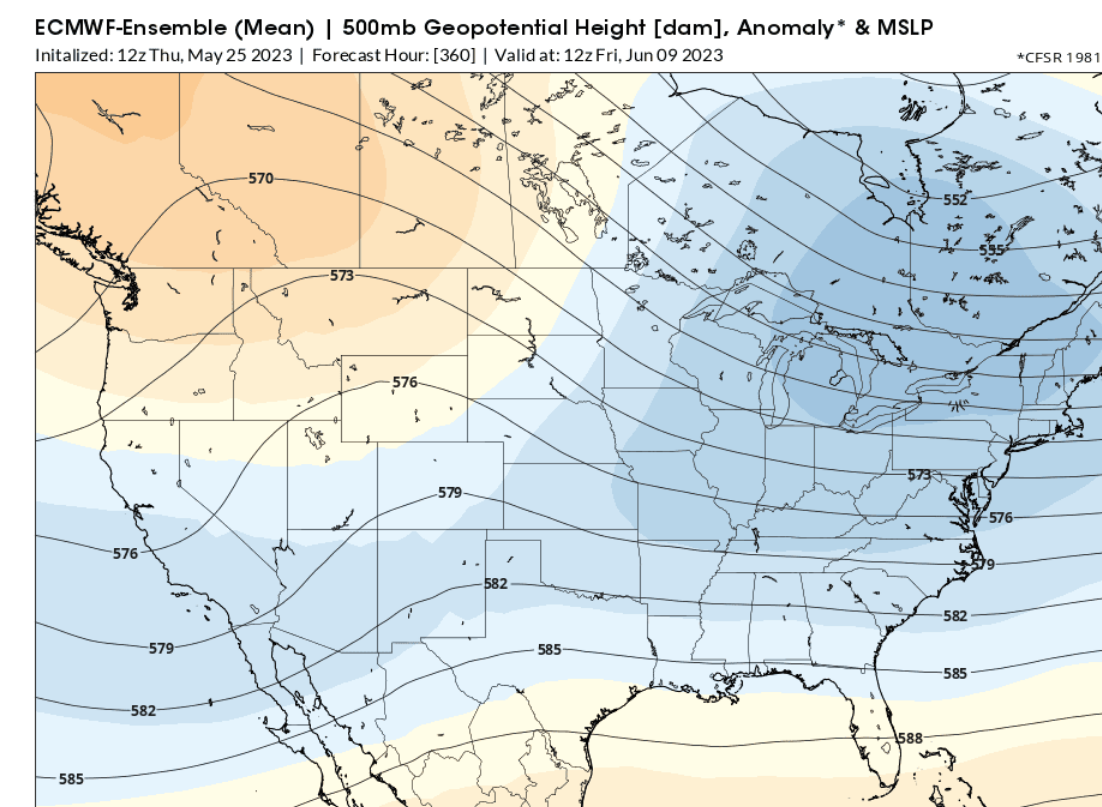
Same dry forecast for the most of the Cornbelt but as mentioned this morning. The upper level ridge backs up and we get into northwest flow at the end of week 2.
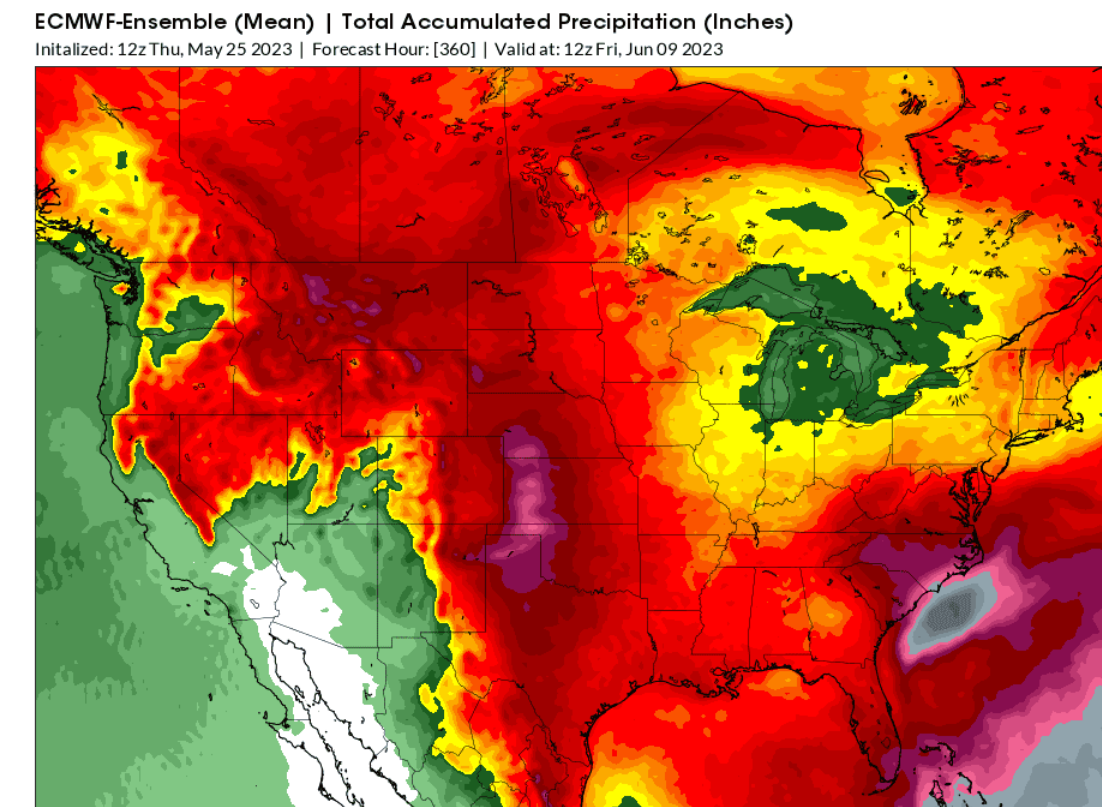
This means turning cooler and potentially, introduces better changes of rain at the end of the 2 week period and into week 3.
This is what's calming the drought fears (besides El Nino increasing chances for good growing weather)
Despite the very dry places growing in key Midwest locations.
GFS ensemble mean anomalies at 2 weeks.
https://www.psl.noaa.gov/map/images/ens/z500anom_nh_alltimes.html 
2 week 850 temp for ensemble mean anomaly
https://www.psl.noaa.gov/map/images/ens/t850anom_nh_alltimes.html
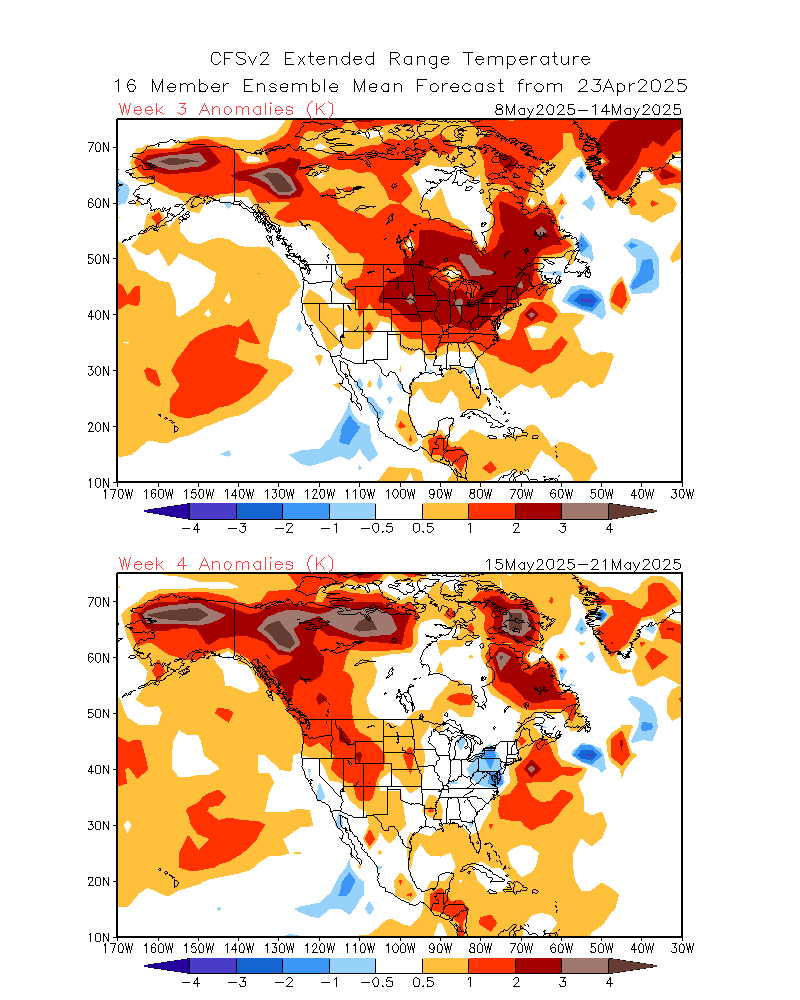
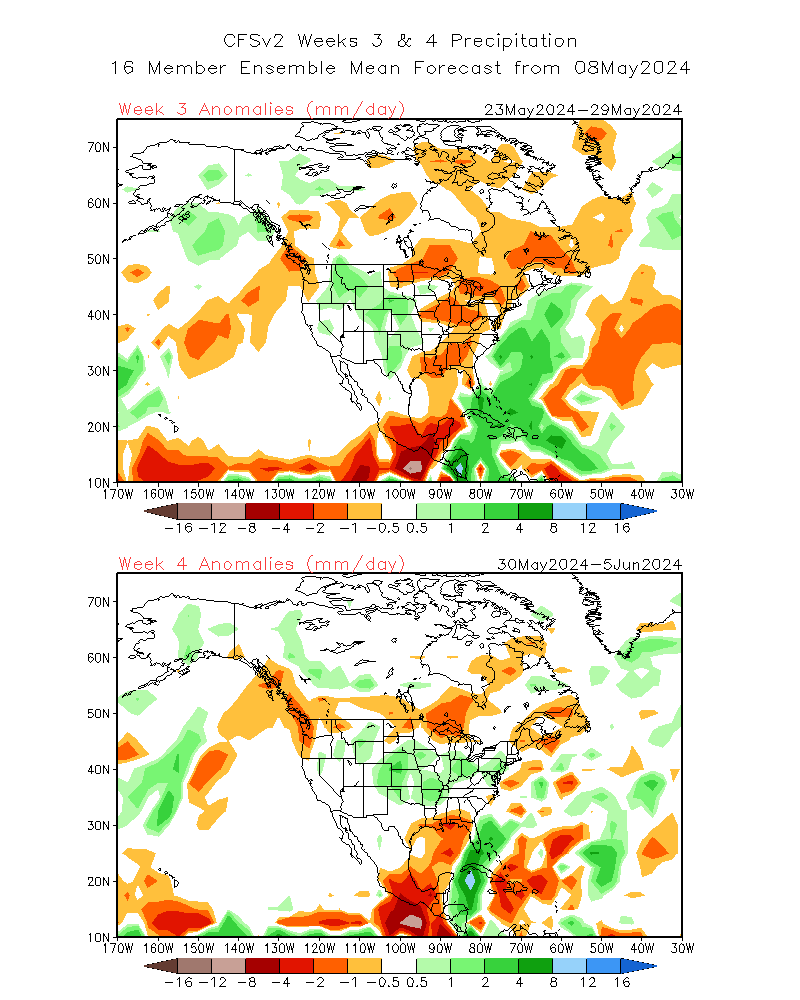
Week 3-4 forecasts don't have a great deal of skill.
https://www.cpc.ncep.noaa.gov/products/people/mchen/CFSv2FCST/weekly/
Temperatures below. These maps are 1 day old.
Precip below..
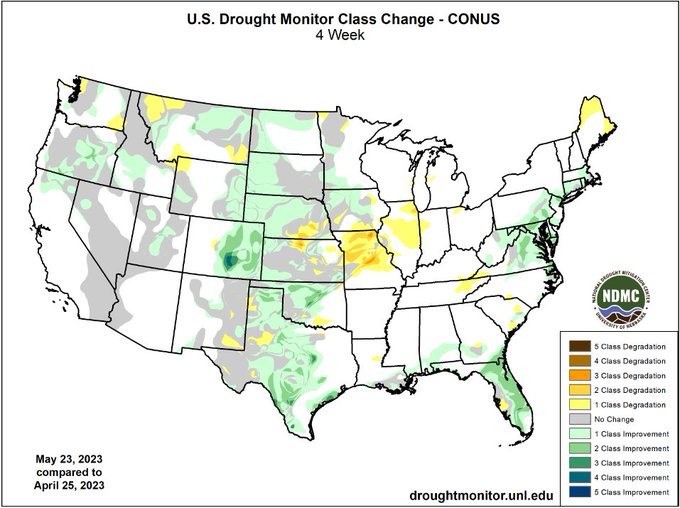
Drought update 5-25-23
https://www.marketforum.com/forum/topic/83844/#83853
Soilmoisture anomaly:
These maps sometimes take a day to catch up to incorporate the latest data(the bottom map is only updated once a week).
https://www.cpc.ncep.noaa.gov/products/Soilmst_Monitoring/US/Soilmst/Soilmst.shtml#
![]()


++++++++++++++++++++++++++++
https://mrcc.purdue.edu/cliwatch/watch.htm#curMonths

Most of the drought in the West has been wiped out!
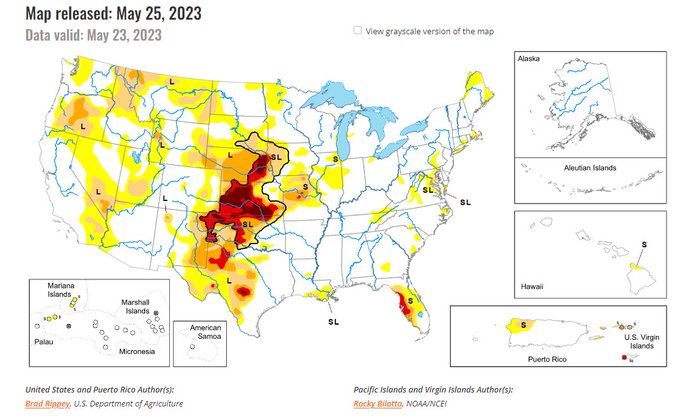
https://droughtmonitor.unl.edu/
Drought Monitor:
May 23, 2023
Over the last month, U.S. drought conditions eased in parts of the High Plains, incl. some of HRW #wheat country, but dryness has spread in the east, incl. Missouri & Illinois. However, #drought concerns are far from over in the western #Corn Belt.
Last week, May 16, 2023

Drought monitor previous years: You can see the natural La Niña, (cold water-in the tropical Pacific)causing the drought! Starting in 2020, then worsening for 2+ years!
The ending of La Niña in 2023-heading towards El Nino, is causing the opposite weather-bombarding us with moisture.…..too much in some cases. This is a natural cycle NOT climate change!
A big enough change in the forecast over this holiday weekend could result in C and S being close to limit up or down on Tuesday.
No rain with heat thru 2 weeks...........massive short covering by the huge fund short and beans could be +50c corn +25.
Huge rains on all models, starting on Sunday and it could be huge in the opposite direction.
IA is on the edge here, hanging on with this dry weather also featuring some heat in the first week of June.
To maximize yield potential there and surrounding areas, this dry weather CAN'T persist longer than what is on the forecast models right now.
A dry, and especially hot forecast next week thru 2 weeks will force the market to dial in a smaller crop and higher prices.
Extremely high confidence on the impact of that anomalous weather forecast(either way) above on the price reaction.