KEY EVENTS TO WATCH FOR:
Thursday, May 18, 2023
8:30 AM ET. May Philadelphia Fed Business Outlook Survey
Business Activity (previous -31.3)
Prices Paid (previous 8.2)
Employment (previous -0.2)
New Orders (previous -22.7)
Prices Received (previous -3.3)
Delivery Times (previous -25.0)
Inventories (previous -17.9)
Shipments (previous -7.3)
8:30 AM ET. Unemployment Insurance Weekly Claims Report - Initial Claims
Jobless Claims (previous 264K)
Jobless Claims, Net Chg (previous +22K)
Continuing Claims (previous 1813000)
Continuing Claims, Net Chg (previous +12K)
8:30 AM ET. U.S. Weekly Export Sales
10:00 AM ET. April Existing Home Sales
Existing Sales (previous 4.44M)
Existing Sales, M/M% (previous -2.4%)
Unsold Homes Month's Supply (previous 2.6)
Median Price (USD) (previous 375700)
Median Home Price, Y/Y% (previous -0.9%)
10:00 AM ET. April Leading Indicators
Leading Index, M/M% (previous -1.2%)
Leading Index
Coincident Index, M/M% (previous +0.2%)
Lagging Index, M/M% (previous -0.2%)
10:00 AM ET. 1st Quarter Quarterly Retail E-Commerce Sales
10:30 AM ET. EIA Weekly Natural Gas Storage Report
Working Gas In Storage (Cbf) (previous 2141B)
Working Gas In Storage, Net Chg (Cbf) (previous +78B)
4:30 PM ET. Federal Discount Window Borrowings
4:30 PM ET. Foreign Central Bank Holdings
Friday, May 19, 2023
10:00 AM ET. 1st Quarter Advance Quarterly Services
10:00 AM ET. April State Employment and Unemployment
The STOCK INDEXES? http://quotes.ino.com/ex?changes/?c=indexes
The STOCK INDEXES: The June NASDAQ 100 was higher overnight as it extends this year's rally. Overnight trading set the stage for a higher opening when the day session begins trading. Stochastics and the RSI are overbought but remain neutral to bullish signaling that sideways to higher prices are possible near-term. If June extends this year's rally, the August-2022 high crossing at 13,983.00 is the next upside target. Closes below the 20-day moving average crossing at 13,274.42 would signal that a short-term top has been posted. First resistance is the overnight high crossing at 13,676.75. Second resistance is the August-2022 high crossing at 13,983.00. First support is the 10-day moving average crossing at 13,445.75. Second support is the 20-day moving average crossing at 13,274.42.
The June S&P 500 was higher overnight as it extends the April-May trading range. Overnight strength sets the stage for a higher opening when the day session begins trading. Stochastics and the RSI are neutral to bullish signaling that sideways to higher prices are possible near-term. Closes above the May 1st high crossing at 4206.25 or below the May 4th low crossing at 4062.25 are needed to mark a breakout of the aforementioned trading range. First resistance is the May 1st high crossing at 4206.25. Second resistance February's high crossing at 4244.00. First support is the May 4th low crossing at 4062.25. Second support is the 38% retracement level of the 2022-2023 rally crossing at 3984.29.
INTEREST RATES http://quotes.ino.com/ex changes/?c=interest"
INTEREST RATES: June T-bonds were lower overnight as it extends this week's decline and are breaking out to the downside of the March-May trading range. Overnight weakness sets the stage for a steady to lower opening when the day session begins trading. Stochastics and the RSI are oversold but remain neutral to bearish signaling that sideways to lower prices are possible near-term. Multiple closes below the May 1st low crossing at 129-02 would mark a downside breakout of the March-May trading range thereby opening the door for additional weakness near-term. Closes above the May 4th high crossing at 133-00 would open the door for a possible test of April's high crossing at 134-14. First resistance is the May 4th high crossing at 133-00. Second resistance is April's high crossing at 134-14. First support is the May 1st low crossing at 129-02. Second support is the 38% retracement level of the October-January rally crossing at 128-08.
June T-notes were slightly lower overnight as it extends this month's decline. Overnight trading sets the stage for a slightly lower opening when the day session begins trading. Stochastics and the RSI are oversold but remain neutral to bearish signaling that sideways to lower prices are possible near-term. If June extends this month's decline, May's low crossing at 114.100 is the next downside target. Closes above the 20-day moving average crossing at 115.093 would temper the near-term bearish outlook. First resistance is the May 11th high crossing at 116.160. Second resistance is the May 4th high crossing at 117.000. First support is May's low crossing at 114.100. Second support is the April 19th low crossing at 113.305.
ENERGY MARKETS? http://quotes.ino.com/ex?changes/?c=energy ""
ENERGIES:Junecrude oil was slightly lower overnight. Overnight trading sets the stage for a slightly lower opening when the day session begins trading. Stochastics and the RSI are neutral to bullish signaling that sideways to higher prices are possible near-term. Closes above the 50-day moving average crossing at $74.67 would signal that a short-term low has been posted. If June renews last-week's decline, the March 24th low crossing at $67.02 is the next downside target. First resistance is the 50-day moving average crossing at $74.67. Second resistance is the April 24th high crossing at $79.18. First support is the March 24th low crossing at $67.02. Second support is the May 4th low crossing at $63.64.
June heating oil was slightly lower overnight and sets the stage for a slightly lower opening when the day session begins trading. Stochastics and the RSI are overbought but remain neutral to bullish signaling that sideways to higher prices are possible near-term. If June extends the rally off May's low, the 50-day moving average crossing at 2.4884 is the next upside target. Closes below Monday's low crossing at 2.2812 would signal that a short-term top has been posted. First resistance is the 50-day moving average crossing at 2.4884. Second resistance is the April 25th high crossing at $2.5377. First support is Monday's low crossing at 2.2812. Second support is May's low crossing at 2.1500.
June unleaded gas was steady to slightly higher overnight and sets the stage for a slightly higher opening when the day session begins trading. Stochastics and the RSI are overbought but remain neutral to bullish signaling that sideways to higher prices are possible near-term. Closes above the 50-day moving average crossing at $2.5602 would open the door for a possible test of the April 25th high crossing at $2.6295. Closes below the 10-day moving average crossing at $2.4793 would signal that a short-term top has been posted. First resistance is the April 25th high crossing at $2.6295. Second resistance is the 75% retracement level of the April-May decline crossing at $2.6834. First support is the 10-day moving average crossing at $2.4793. Second support is Monday's low crossing at $2.4017.
June natural gas was slightly higher overnight and sets the stage for a slightly higher opening when the day session begins trading. Stochastics and the RSI are neutral to bullish signaling that sideways to higher prices are possible near-term. Closes above the 50-day moving average crossing at 2.429 would open the door for additional short-covering gains. If June renews the decline off March's high, the September-2020 low on the monthly continuation chart crossing at 1.795 is the next downside target. First resistance is the 50-day moving average crossing at 2.429. Second resistance is the April 19th high crossing at 2.543. First support is the May 5th low crossing at 2.031. Second support is the September-2020 low on the monthly continuation chart crossing at 1.795.
CURRENCIEShttp://quotes.ino.com/ex changes/?c=currencies"
CURRENCIES:The June Dollar was higher overnight as it extends the rally off May's low. Overnight trading and sets the stage for a higher opening when the day session begins trading later this morning. Stochastics and the RSI are overbought but remain neutral to bullish signaling that sideways to higher prices are possible near-term. Closes above the April 3rd high crossing at $102.745 would mark a potential upside target of the aforementioned trading range. Closes below the 20-day moving average crossing at $101.680 temper the near-term friendly outlook. First resistance is the April 3rd high crossing at $102.745. Second resistance is the 25% retracement level of the 2022-2023 decline crossing at $103.594. First support is the April 14thlow crossing at $100.420. Second support is February's low crossing at $100.345.
The June Euro was lower overnight as it extends this month's decline. Overnight trading sets the stage for a lower opening when the day session begins trading. Stochastics and the RSI are oversold but remain neutral to bearish signaling that sideways to lower prices are possible near-term. If June extends this month's decline, the 25% retracement level of the 2022-2023 rally crossing at 1.07774 is the next downside target. Closes above the 20-day moving average crossing at $1.09909 would temper the near-term bearish outlook. First resistance is the 20-day moving average crossing at $1.09909. Second resistance is April's high crossing at $1.11290. First support is April's low crossing at $1.08355. Second support is the 25% retracement level of the 2022-2023 rally crossing at 1.07774.
The June British Pound was lower overnight and sets the stage for a lower opening when the day session begins trading. Stochastics and the RSI are neutral to bearish signaling that sideways to lower prices near-term. Closes below the 50-day moving average crossing at 1.2423 would open the door for additional weakness near-term. If June renews the rally off the March 8th low, the 62% retracement level of the 2021-2022 decline crossing at 1.2784 is the next upside target. First resistance is the May 10th high crossing at 1.2692. Second resistance is the 62% retracement level of the 2021-2022 decline crossing at 1.2784. First support is the 50-day moving average crossing at 1.2423. Second support is April's low crossing at 1.2293.
The June Swiss Franc was lower overnight as it extends this month's decline. Overnight weakness sets the stage for a lower opening when the day session begins trading. Stochastics and the RSI are oversold but remain neutral to bearish signaling that sideways to lower prices are possible near-term. Closes below the 50-day moving average crossing at 1.11487 would open the door for additional weakness near-term. If June resumes the rally off the March low, the May-2021 high crossing at 1.14120 is the next upside target. First resistance is the 20-day moving average crossing at 1.12571. Second resistance is May's high crossing at 1.13940. First support is the 50-day moving average crossing at 1.11487. Second support is the April 10th low crossing at 1.10495.
The June Canadian Dollar was lower overnight. Overnight trading sets the stage for a lower opening when the day session begins trading. Stochastics and the RSI are neutral to bearish signaling that sideways to lower prices are possible near-term. Closes below the 50-day moving average crossing at $73.92 would signal that a short-term top has been posted while opening the door for additional weakness near-term. Closes above the 10-day moving average crossing at $74.46 would temper the near-term bearish outlook. First resistance is the 10-day moving average crossing at $74.46. Second resistance is May's high crossing at $75.18. First support is the 50-day moving average crossing at $73.92. Second support is April's low crossing at $73.23.
The June Japanese Yen was lower overnight as it extends the decline off the May 4th high. Overnight weakness sets the stage for a slightly lower opening when the day session begins trading. Stochastics and the RSI are oversold but remain neutral to bearish signaling that sideways to lower prices are possible near-term. If June resumes the decline off the March's high, the November-21st-2022 low crossing at 0.072425 is the next downside target. Closes above the 20-day moving average crossing at 0.074372 would signal that a short-term low has been posted. First resistance is the 20-day moving average crossing at 0.074372. Second resistance is the 50-day moving average crossing at 0.075494. First support is the 62% retracement level of the October-January rally crossing at 0.072908. Second support is the November-21st-2022 low crossing at 0.072425.
PRECIOUS METALS http://quotes.ino.com/ex changes/?c=metals"
Junegold was lower overnight and sets the stage for a lower opening when the day session begins trading later this morning. Stochastics and the RSI are oversold but remain neutral to bearish signaling that sideways to lower prices are possible near-term. If June the decline off May's high, the March 22nd low crossing at $1953.70 is the next downside target. Closes above the 10-day moving average crossing at $2015.70 would temper the near-term bearish outlook. First resistance is the 10-day moving average crossing at $2015.70. Second resistance is the May 4th high crossing at $2085.40. First support is the 25% retracement level of the September-May rally crossing at $1981.40. Second support is the March 22nd low crossing at $1953.70.
July silver was lower overnight as it extends this month's decline and sets the stage for a lower opening when the day session begins trading later this morning. Stochastics and the RSI are oversold but remain neutral to bearish signaling that sideways to lower prices are possible near-term. If July extends this month's decline, the 50% retracement level of the March-April rally crossing at $23.289 is the next downside target. Closes above the 20-day moving average crossing at $25.091 would temper the near-term bearish outlook. First resistance is the 20-day moving average crossing at $25.091. Second resistance is the May 5th high crossing at $26.435. First support is the 50% retracement level of the March-April rally crossing at $23.289. Second support is the 62% retracement level of the March-April rally crossing at $22.541.
July copper was lower overnight as it extends this week's trading range. Overnight trading sets the stage for a lower opening when the day session begins trading. Stochastics and the RSI are oversold but remain bearish signaling that sideways to lower prices are possible near-term. If July extends the decline off April's high, the 62% retracement level of the 2022-2023 rally crossing at 3.6247 is the next downside target. Closes above the 20-day moving average crossing at 3.8425 would signal that a short-term low has been posted. First resistance is the 20-day moving average crossing at 3.8425. Second resistance is the 50-day moving average crossing at 3.9585. First support is Wednesday's low crossing at 3.6525. Second support is the 62% retracement level of the 2022-2023 rally crossing at 3.6247.
GRAINS http://quotes.ino.com/ex changes/?c=grains
July corn was lower overnight as it extends Wednesday's downside breakout of this month's trading range crossing at $5.69 1/4. Overnight trading sets the stage for a lower opening when the day sessions begins trading. Stochastics and the RSI have turned neutral to bearish signaling that sideways to lower prices are possible near-term. If July extends the decline off April's high, the December-2021 low crossing at $5.48 3/4 is the next downside target. Closes above the May 8th high crossing at $6.00 would signal that a short-term low has been posted. First resistance is the May 8th high crossing at $6.00. Second resistance is the 50-day moving average crossing at $6.09 1/4. First support is the December-2021 low crossing at $5.48 3/4. Second support is the 62% retracement level of the 2020-2022 rally crossing at $5.27 1/2.
July wheat was lower overnight as it extends the decline off Tuesday's high. Overnight trading sets the stage for a lower opening when the day session begins trading. Stochastics and the RSI have turned neutral to bearish signaling that sideways to lower prices are possible near-term. If July resumes the decline off March's high the March-2021 low crossing at $5.71 is the next downside target. Closes above the 50-day moving average crossing at $6.74 1/2 would confirm that a low has been posted. First resistance is last-Monday's high crossing at $6.69. Second resistance is the 50-day moving average crossing at $6.74 1/2. First support is May's low crossing at $6.03 3/4. Second support is the March-2021 low crossing at $5.71.
July Kansas City wheat was sharply lower overnight following Wednesday's key reversal down as it consolidates some of this month's rally. Overnight trading sets the stage for a sharply lower opening when the day session begins trading later this morning. Stochastics and the RSI are overbought but remain neutral to bullish signaling that sideways to higher prices are possible near-term. If July extends the rally off May's low, the November 15th high crossing at $9.48 1/2 is the next upside target. Closes below the 20-day moving average crossing at $8.24 3/4 would signal that a short-term top has been posted. First resistance is the 38% retracement level of the 2022-2023 decline crossing at $9.17 1/4. Second resistance is the November 15th high crossing at $9.48 1/2. First support is the 10-day moving average crossing at $8.64 3/4. Second support is the 20-day moving average crossing at $8.24 3/4.
July Minneapolis wheat was sharply lower overnight following Wednesday's key reversal down as it consolidates some of the rally off May's low. Overnight trading sets the stage for a sharply lower opening when the day session begins trading. Stochastics and the RSI are overbought and are turning neutral to bearish signaling that sideways to lower prices are possible near-term. Closes below the 20-day moving average crossing at $8.30 1/2 would signal that a short-term top has been posted. If July extends this month's rally, the April 18th high crossing at $8.95 1/4 is the next upside target. First resistance is the April 18th high crossing at $8.95 1/4. Second resistance is April's high crossing at $9.13 1/2. First support is the 20-day moving average crossing at $8.30 1/2. Second support is the May 3rd low crossing at $7.69.
SOYBEAN COMPLEX? http://quotes.ino.com/ex?changes/?c=grains "
July soybeans were lower overnight and sets the stage for a lower opening when the day session begins trading later this morning. Stochastics and the RSI are oversold but remain neutral to bearish signaling that sideways to lower prices are possible near-term. If July extends the decline off April's high, the July 25th 2022 low crossing at $13.22 3/4 is the next downside target. Closes above the 20-day moving average crossing at $14.06 1/2 would signal that a short-term low has been posted while opening the door for additional short-covering gains. First resistance is the 20-day moving average crossing at $14.06 1/2. Second resistance is the 50-day moving average crossing at $14.41 1/4. First support is the 87% retracement level of the 2022-2023 rally crossing at $13.31. Second support is the July 25th 2022 low crossing at $13.22 3/4.
July soybean meal was lower overnight as it extends the decline off Monday's high. Overnight trading sets the stage for a lower opening when the day session begins trading. Stochastics and the RSI are neutral to bearish signaling that sideways to lower prices are possible near-term. If July renews the decline off March's high, the 38% retracement level of the 2020-2023 rally crossing at $411.90 is the next downside target. Closes above Monday's high crossing at $442.30 would renew the rally off May's low while opening the door for a test of the 50-day moving average crossing at $445.50. First resistance is Monday's high crossing at $442.30. Second resistance is the 50-day moving average crossing at $445.50. First support is last-Wednesday's low crossing at $416.10. Second support is the 38% retracement level of the 2020-2023 rally crossing at $411.90.
July soybean oil was steady to slightly higher overnight as it consolidates some of this month's decline. Overnight trading sets the stage for a steady to slightly higher opening when the day session begins trading. Stochastics and the RSI are oversold but remain neutral to bearish signaling that sideways to lower prices are possible near-term. If July extends this month's decline, the 75% retracement level of the 2020-2022 rally crossing at 40.19 is the next downside target. Closes above the 20-day moving average crossing at 51.30 would signal that a low has been posted while opening the door for a possible test of the 50-day moving average crossing at 53.77. First resistance is the 20-day moving average crossing at 51.30. Second resistance is the 50-day moving average crossing at 53.77. First support is the 62% retracement level of the 2020-2022 rally crossing at 46.42. Second support is the 75% retracement level of the 2020-2022 rally crossing at 40.19.
Thanks tallpine.
still a lot of rain coming to dry areas in the next 2 weeks.
first big event in the southwest plains getting ready to start.
Here's all the weather
https://www.marketforum.com/forum/topic/83844/
7 Day Total precipitation below:
http://www.wpc.ncep.noaa.govcdx /qpf/p168i.gif?1530796126

The week 2 models are telling us it will be wetter in the Plains/WCB that need rain the most and dry in the east.
This could shift and become bullish if it shifts farther west and more bearish if it shifts east.
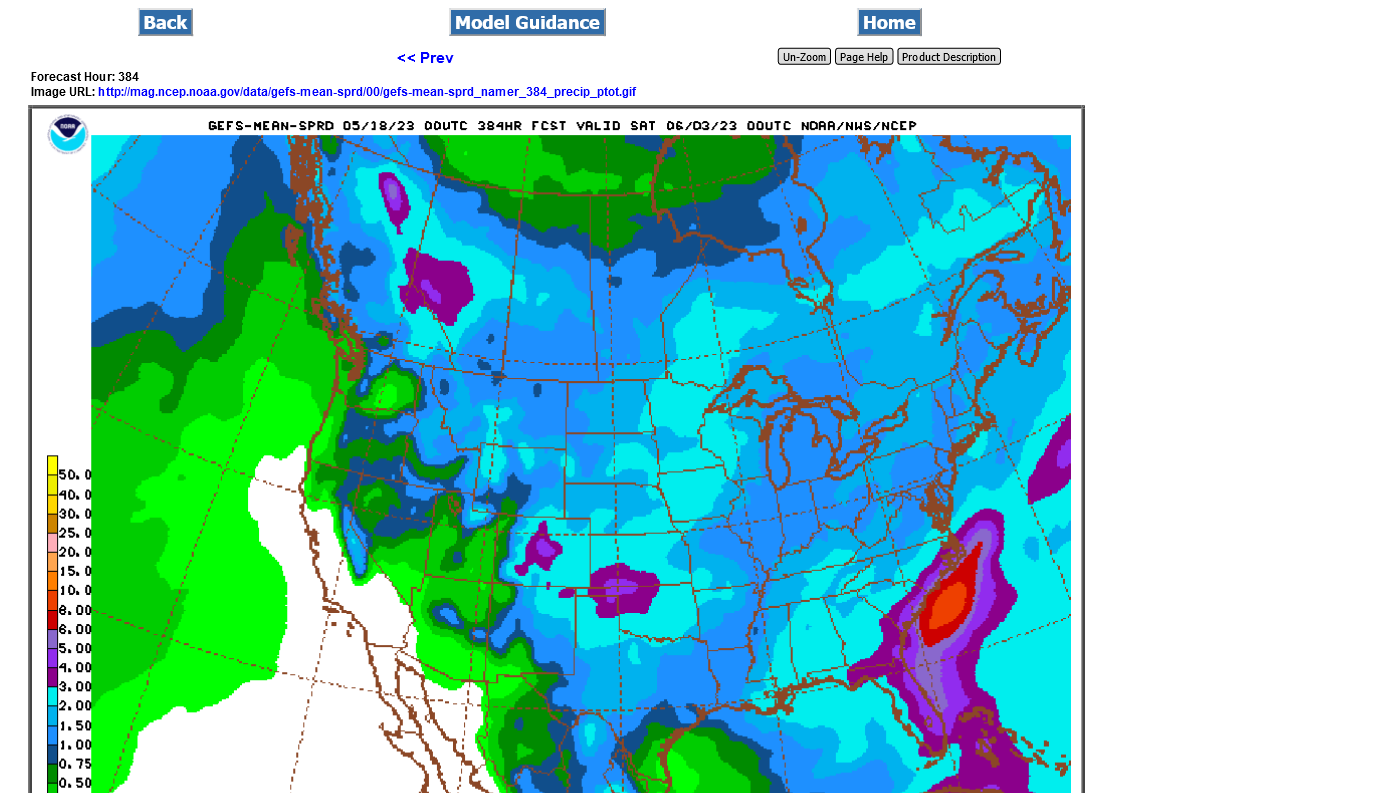
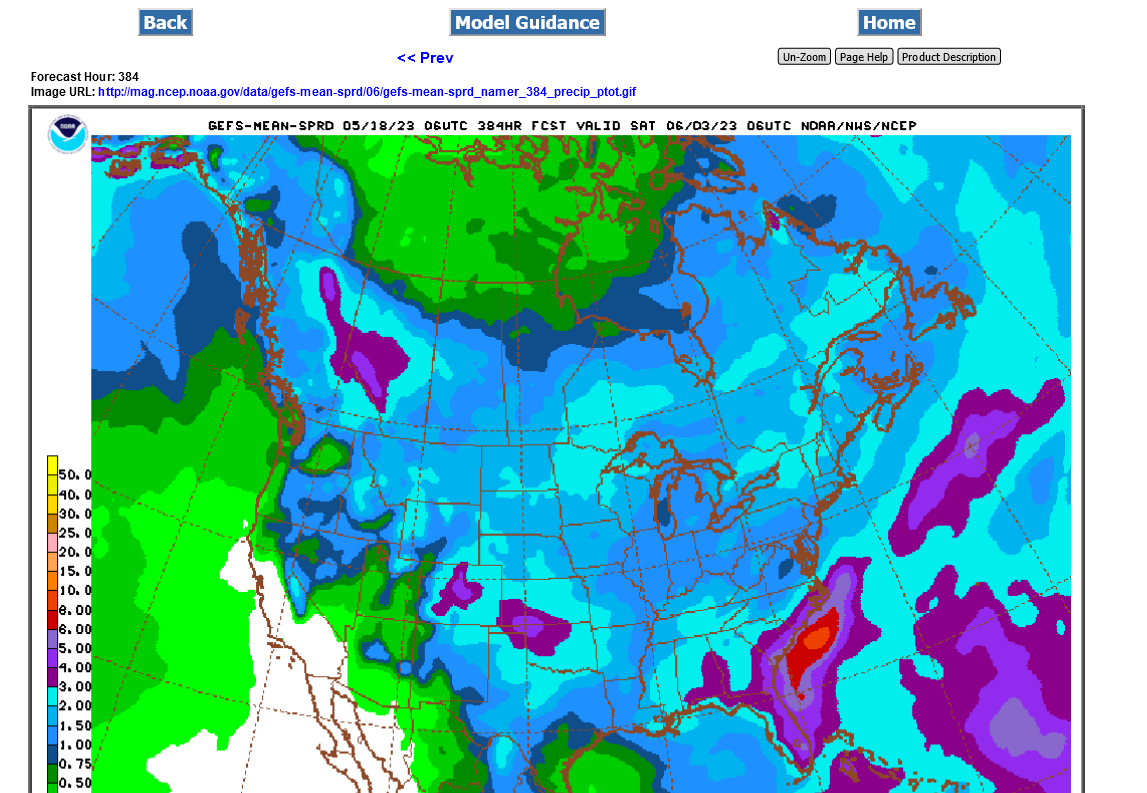
The last 6z GEFS run was DRIER for the central Cornbelt!! Possibly why we've recovered from very steep losses.
1. Last 6z GEFS
2. Previous 0z GEFS
https://www.marketforum.com/forum/topic/95260/#95266
Last 0z GEFS 2 week rains:
Light blue is 2+ inches!