Thanks Mike!
I'm back from Detroit.
Previous threads:
wheat how low can we go
12 responses |
Started by coffeeclotch - April 27, 2023, 4:55 p.m.
https://www.marketforum.com/forum/topic/94803/
April 24, 2023 crop conditions
5 responses |
Started by metmike - April 24, 2023, 11:04 p.m.
https://www.marketforum.com/forum/topic/94753/
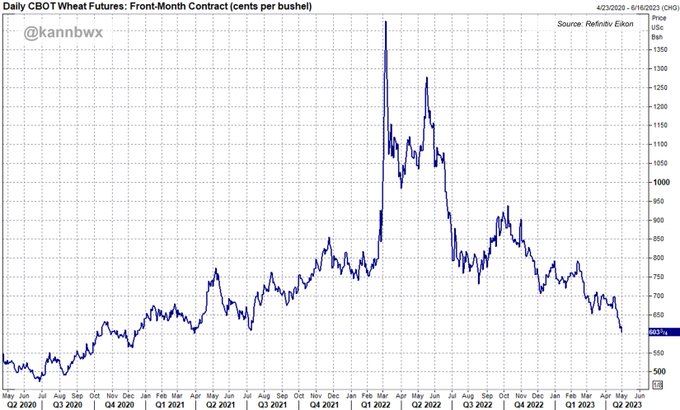
Not sure why you showed the May wheat which almost nobody is trading anymore in May. Maybe you don't have a choice and are just using the front month/continuous chart which is what this source also uses.
That 610 support you mentioned got blown out of the water.
Forget the spike down on the charts below:
1. 1 week
2. 1 year
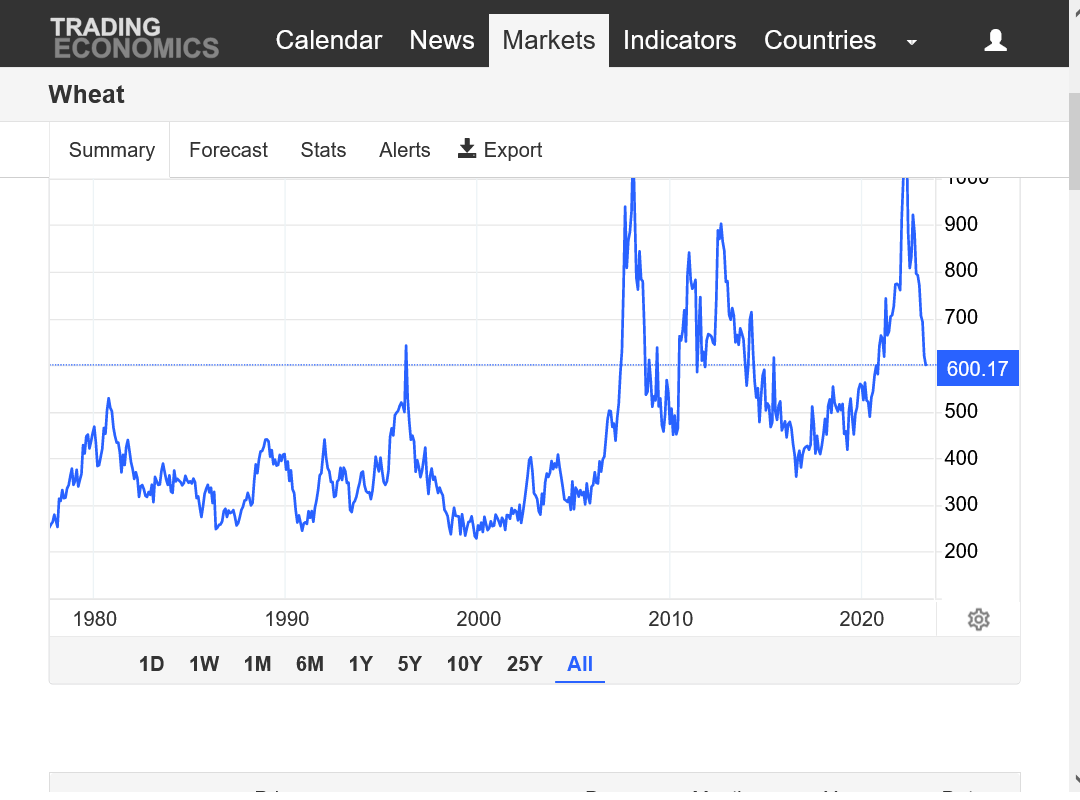
3 . 45 years
https://tradingeconomics.com/commodity/wheat


May 1: CBOT front-month #wheat dipped below $6/bushel for the first time in over two years. The last two sessions where that happened were March 31, 2021 and Dec. 21, 2020. May wheat closed just above $6 on Monday. The last sub $6 close in front-month was on Dec. 16, 2020.
Most-active CBOT #wheat settled at $6.18-1/4 per bushel Monday, it's lowest settle since July 9, 2021. Most-active wheat last traded below $6 on March 31, 2021, but it last settled below $6 on Dec. 16, 2020.
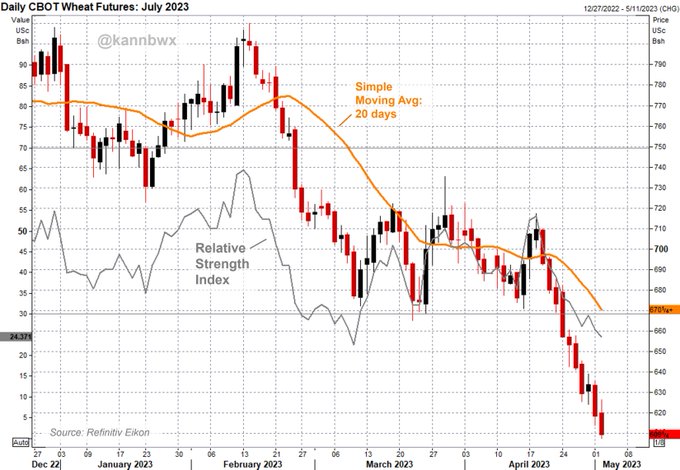
May 2: CBOT July #wheat ends down 9 cents at $6.09-1/4 per bushel after touching $6.07-1/2 earlier in the session, the most-active contract's lowest since April 5, 2021. Tuesday's settle is the lowest since March 30, 2021, and the last sub $6 settle was Dec, 16, 2020.
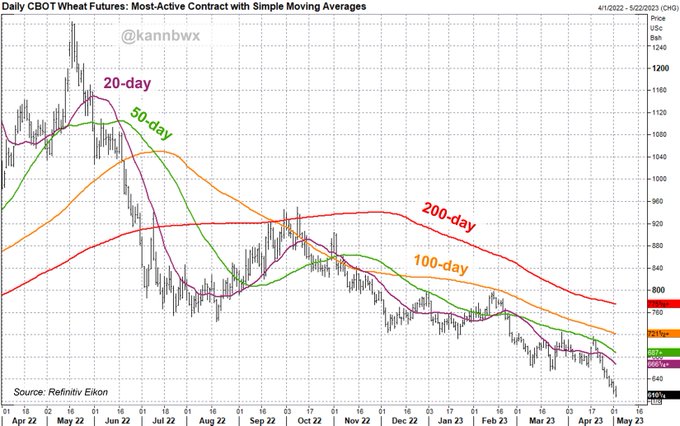
Most-active CBOT #wheat futures have been trading below longer-term averages (100+ days) since last fall. Based on the relative strength index (first chart), wheat is now in oversold territory, though not quite to the extent seen in early March.
I have no clue about any fundamental reason for wheat to be up so much today.......other than funds had acquired a record short and the wheat market is very thin compared to corn and beans that have much more volume(tonight, the front months of C and S have 9 and 8 times the volume of W).
So when they buy with huge orders in W, to get filled, the price has to move up much more than it does with C and S to meet selling orders that fill the bid.
The near record fast huge drop, certainly created the dynamic for a powerful short covering spike higher too.
https://tradingeconomics.com/commodity/wheat