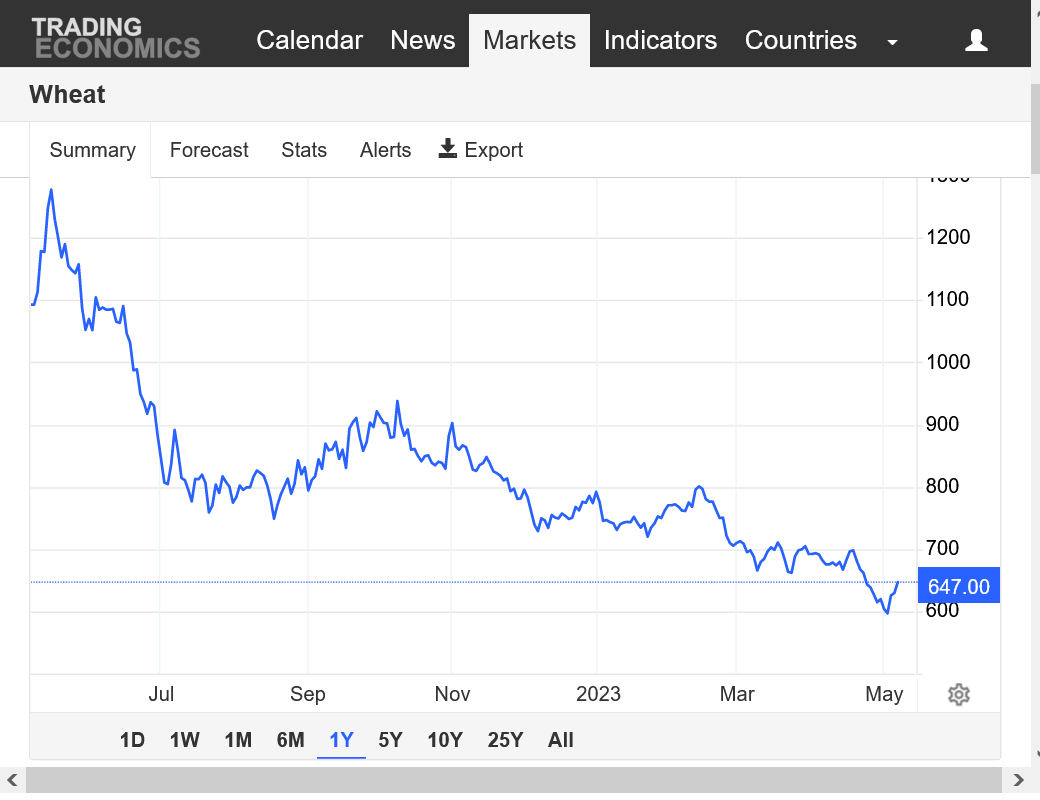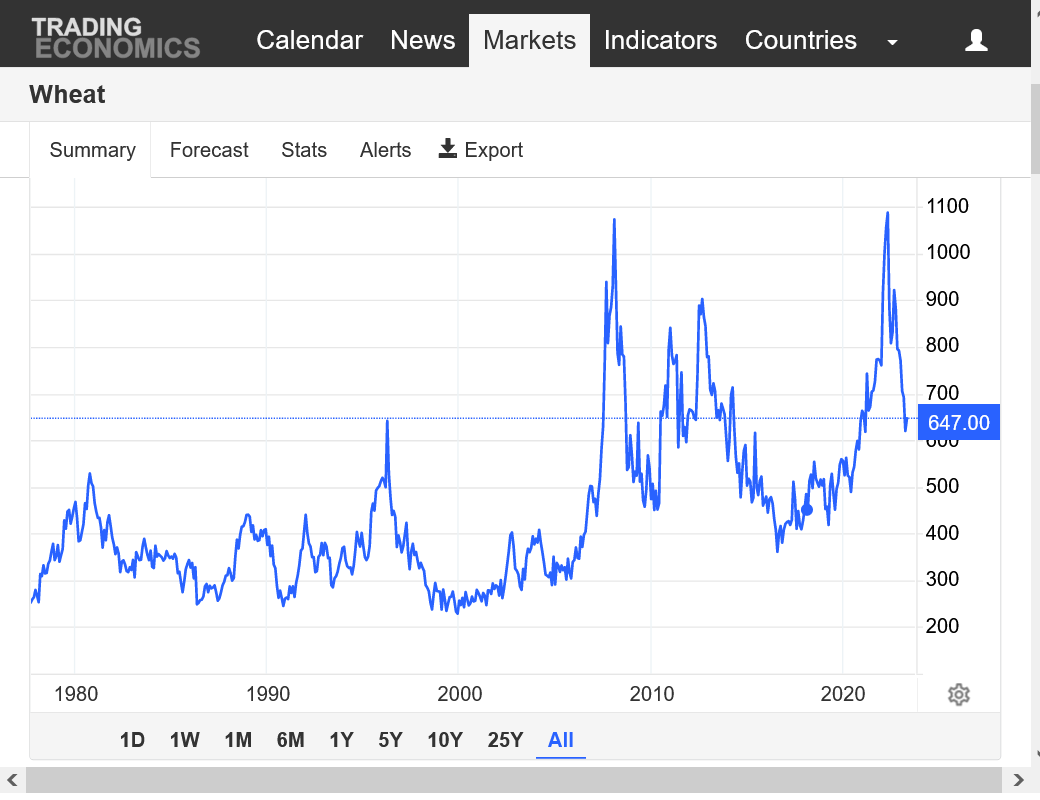
thinking we are very close or at a low ..thoughts?
Great question CC!
KE that I follow closest was over $4 higher less than a year ago from the drought out West caused by the lonlived moderate natural La Niña and the Putin/Biden price hike.
we spiked up,to $9, 2 weeks ago on record bad crop ratings from the drought in the s.plains but have dropped well over $1 since then.
the Natural El Nino is busting the drought and will be improving crop ratings in May. The market has been dialing that into the price, here in Late April.
much above normal temps coming to the n.plains in week 2 is just what the MWE Spring wheat doctor ordered to greatly improve almost non existent planting conditions up there Because of recent snow and cold.
the world, outside of Putin, Biden and zelensky wants this war over ASAP and China trying to negotiate peace May be a big bearish factor.
also, the Fed is intentionally killing our economy which is bearish most markets From demand destruction.
May 2019 on the continuous chart $4.26 low?
edit:
Big crop in srw. demand destruction. losing exports to other countries. Funds?
Corn going much lower
Yes, great points cutworm.
Still in Detroit with my 97 year old Dad but it looks like planting weather will turn almost perfect in week 2.
https://www.marketforum.com/forum/topic/83844/
https://www.marketforum.com/forum/topic/83844/#83852
Extended weather.
https://www.cpc.ncep.noaa.gov/products/predictions/610day/ | ||||||||
| 6 to 10 day outlooks | ||||||||
| Click below for information about how to read 6-10 day outlook maps Temperature Precipitation | ||||||||
| Click below for archives of past outlooks (data & graphics), historical analogs to todays forecast, and other formats of the 6-10 day outlooks ArchivesAnalogsLines-Only FormatGIS Data | ||||||||
Temperature Probability | ||||||||
Precipitation Probability | ||||||||
Crude is having a potentially huge reversal higher which is reversing other markets higher too.
wow you guys are pretty negative even after the large fall
Actually, those were reasons trying to explain why we fell so much!
IN MY NECCO-DA-WOODS, WE'VE HAD BELOW 32 FOR QUITE A FEW NIGHTS & AS LOW AS 25 FOR 7-8 HOURS. THE FIELDS LOOKED NICE BEFORE THOSE FREEZING TEMPS ~ I HAVEN'T GOTTEN A CHANCE TO GO LOOK, SINCE.
Thanks Jean,
it was pretty cold for sure but im not sure what stage the wheat was in.
Ill try to guess later but the USDA doesn’t report the amount of US wheat jointed like it used to, just headed.
the individual Ohio state report stated that 69% of the crop was jointed which suggests 25 degrees could have done some damage.
I didn’t see any areas down that cold, other than maybe an outlying spot briefly. Where are you located in OH, Jean?
Ill see how much of an area got that cold. When that cold was seen by the market and happening, the market was collapsing lower from the items mentioned above.
THE NW CORNER ~ 40 MILES FROM INDIANA & MICHIGAN
I'LL CHECK A LOCAL PERSONAL STATION HISTORY
APRIL 27TH = 28 / 26TH WAS 26 / 25TH WAS 27 / 24TH WAS 30 / 19TH WAS 28 />>>>>>>> 10TH WAS 32 / 9TH WAS 29 / 8TH WAS 30 / MARCH 30TH WAS 16 / 29TH WAS 27 / 28TH WAS 25 / 20TH WAS 24 / 19TH WAS 19 / 18TH WAS 20 / 15TH WAS 20 /
THE NIGHTS IT WAS ABOVE FREEZING, IT WAS BASICALLY IN THE LOW TO MID 40'S.
IN MARCH & THE 1ST 1/2 OF APRIL, I COULD STILL SEE THE GROUND IN THE ROWS.
WE WERE IN THE 60S - 80S, FOR THE HIGHS A LOT OF DAYS
I'LL BE SEEIN' THOSE FIELDS, NEXT WEEK
Thanks much, Jean!
i said 6 bucks for a low...i let all the bearish noise cloud my judgement and ran out with a loss ..and then boom lol
Ouch! That smarts the most of all trades.
Thanks for your candor, coffeecloth!
I was not expecting the big drop in price with the HRW in such horrible shape, though improving a bit.
The big recovery after the plunge also was surprising.
Forgot about how much MORE extreme the move was less than a year ago.
The SRW crop was trading almost $13 in May 2022 and dropped almost $5 in 2 months. In 2008, we saw a similar drop, otherwise that was unprecedented.
This is Chicago wheat below.
https://tradingeconomics.com/commodity/wheat


a reversal today would be a sell IMHO
Thanks cutworm!
That makes sense to me.
I really don't know how much the weather is playing a role because there's enough rain in many places in the Plains to offset it being bullish but not as much in KS which might be a bit bullish?
Unless I'm reading it wrong, which is possible right now.
The latest 7 day precip forecasts are below.
Day 1 below:
http://www.wpc.ncep.noaa.gov/qpf/fill_94qwbg.gif?1526306199054

Day 2 below:
http://www.wpc.ncep.noaa.gov/qpf/fill_98qwbg.gif?1528293750112

Day 3 below:
http://www.wpc.ncep.noaa.gov/qpf/fill_99qwbg.gif?1528293842764

Days 4-5 below:
http://www.wpc.ncep.noaa.gov/qpf/95ep48iwbg_fill.gif?1526306162

Days 6-7 below:
http://www.wpc.ncep.noaa.gov/qpf/97ep48iwbg_fill.gif?1526306162

7 Day Total precipitation below:
http://www.wpc.ncep.noaa.govcdx /qpf/p168i.gif?1530796126
