First one of the year!
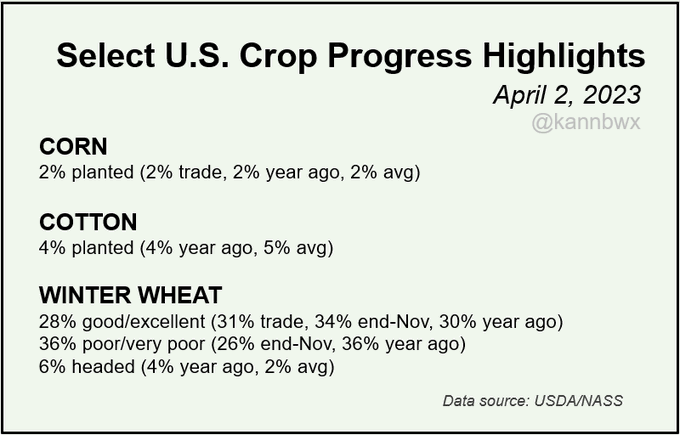
Karen Braun@kannbwxU.S. #corn and #cotton are in the early stages of planting while 28% good/excellent is winter #wheat's second worst initial spring rating after 1996. 36% of winter wheat is poor/very poor, tied with the same week last year. Wheat is currently in worse shape than in late fall.
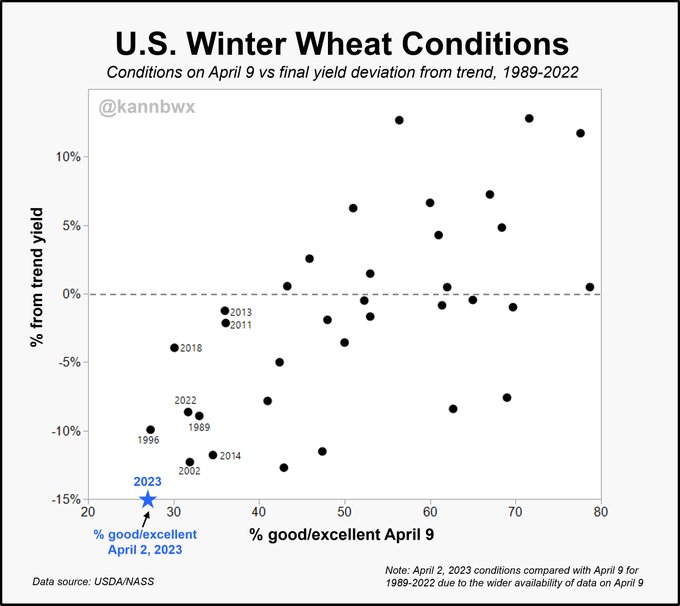
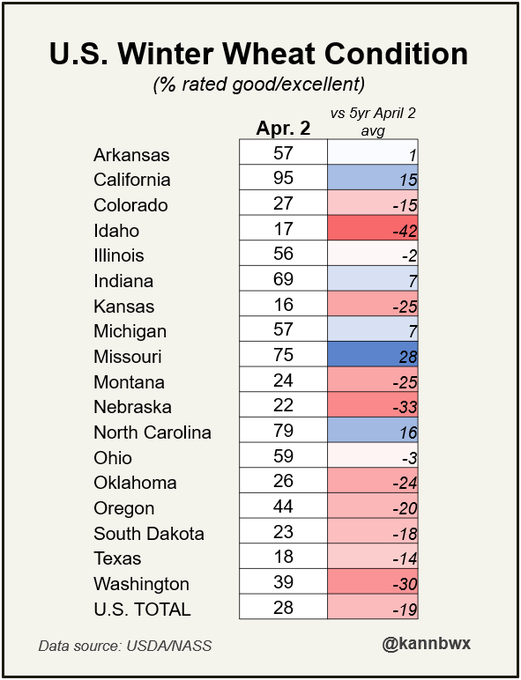
U.S. winter #wheat conditions come in at 28% good/excellent, below both the trade guess of 31% and the end of November's 34%. That is just about the worst early April conditions on record (near 1996) and does not bode well for yield possibilities.
metmike: The very cold Winter in the Northwest caused more than expected(by the market) Winter kill damage to the wheat out there.
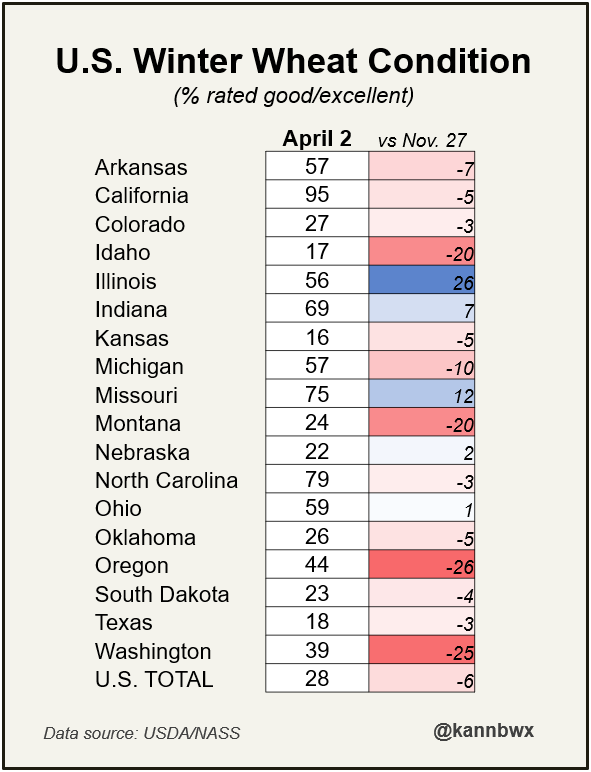
U.S. winter #wheat conditions, April 2 vs November 27. Conditions were bad in the fall for the southern Plains, including top producer Kansas, but things have drastically worsened in the Northwest. Wash, Montana, Idaho & Oregon produce 24% of the country's winter wheat.
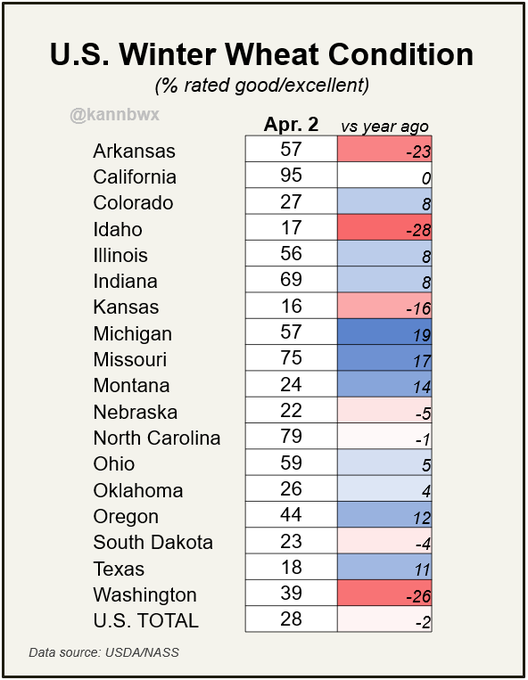
versus the same week last year. Winter #wheat overall is slightly worse than last year at 28% vs 30% good/excellent, but there is some variation by state. Kansas and Washington, the top two U.S. winter wheat growers (34% total), are notably worse off. TX/OK better.
Here's looking at the April 2 winter #wheat conditions vs the five-year averages for the date. National G/E at 28% is 19 points below average. Decent crops in SRW country, but tough conditions in the Plains and Northwest.
Some amazing positive temperature anomalies for such a long period, 3 months in the Eastern and Southern US where the most people live. Dec-Jan-Feb!
However, it was very cold in the northwestern 40% of the country, where much of the Winter Wheat is grown. This increased Winterkill.
In between, in the S.Plains temps gyrated between the warm and cold, also not good.
https://www.cpc.ncep.noaa.gov/products/tanal/temp_analyses.php
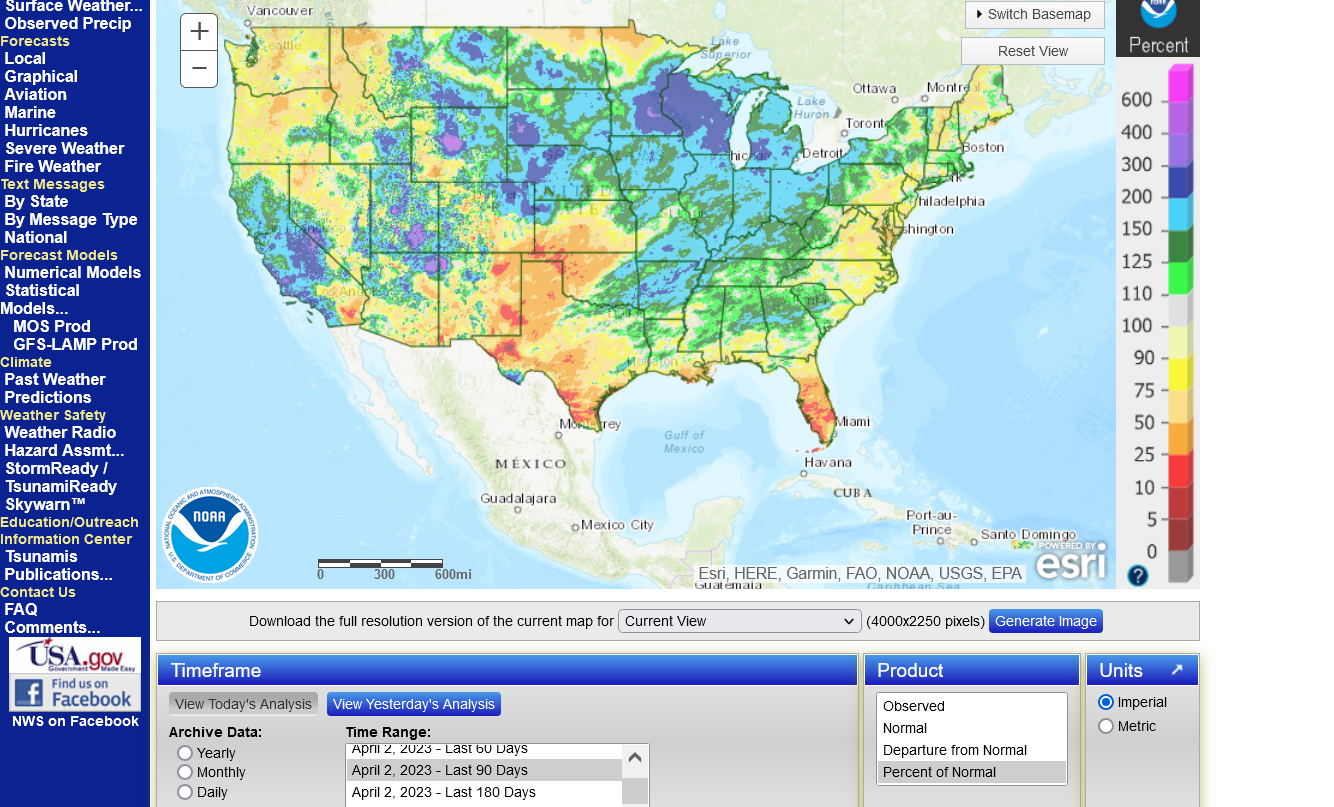
30 day precip below
https://water.weather.gov/precip/
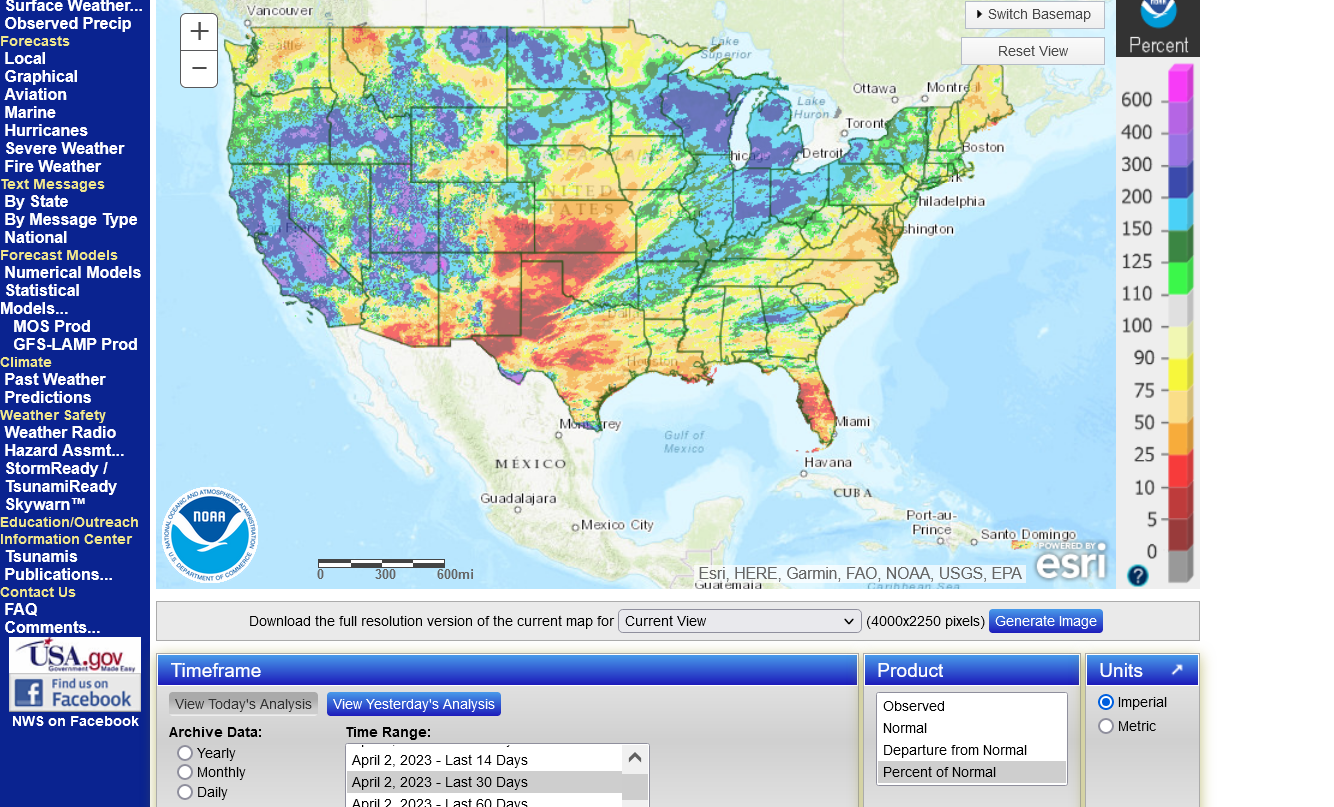
90 day precip below-S.Plains and Northwest still left out
![]()
https://droughtmonitor.unl.edu/
Drought Monitor:
March 28, 2023

Drought monitor previous years: You can see the natural La Niña, (cold water-in the tropical Pacific)causing the drought! Starting in 2020, then worsening for 2+ years!
The ending of La Niña in 2023-heading towards El Nino, is causing the opposite weather-bombarding us with moisture.…..too much in some cases. This is a natural cycle NOT climate change!
+++++++++++
https://www.marketforum.com/forum/topic/83844/#83880
Corn seed likes temperatures above 50 degrees for germination.
This map is updated daily(with previous days data). This upcoming shot of heat will warm temps but producers won't be doing widespread planting in the Midwest, except south for awhile.
https://mesonet.agron.iastate.edu/agclimate/soilt.php

The USDA report on Friday was pretty bearish for HRW wheat because of the surprise with increased acreage. Stocks were slightly higher too.
Scroll down at this link to get the entire USDA report:
https://www.marketforum.com/forum/topic/94162/#94236
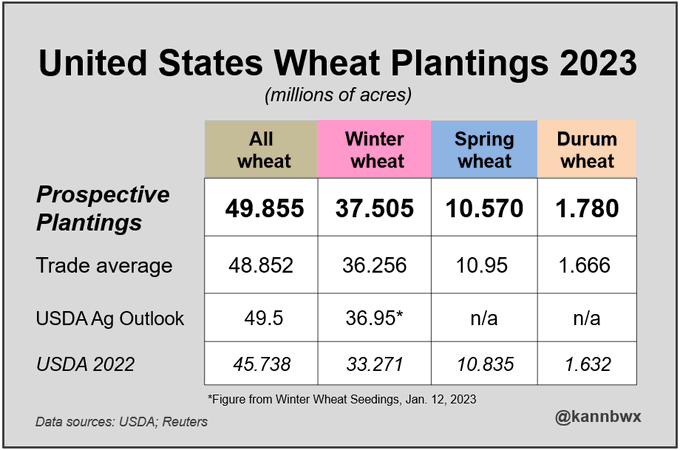
U.S. #wheat plantings come in heavier than expected due to higher winter and durum acreages, but spring wheat acres come in below both expectations and last year.
Comprehensive weather here:
https://www.marketforum.com/forum/topic/83844/
Extended is really heating up and drying out(rains might increase late in week 2).
Bad for HRW that needs rain in the S.Plains, good HRS weather in the N.Plains that needs lots of warm/dry weather to plant the crop.
Good for early corn planting too and to melt the snow in the N.Plains and finally warm soils so the HRS can be planted in May.
https://www.marketforum.com/forum/topic/83844/#83852


Missed buying the KE wheat by 2 ticks on the open at 875.25!
Precip picking up in week 2. Possibly why KE wheat has been extremely weaker than expected.
Also, increase in acreage from USDA.
All the weather here:
https://www.marketforum.com/forum/topic/83844/
Deep snow cover in the N.Plains ensures a late planting season for the Spring Wheat crop this year.
++++++++++++++
When is the normal halfway mark on U.S. spring #wheat planting? Recent 5yr avg is May 12, but 20yr avg says May 2. Three different avgs are shown on the chart - planting is trending slower. Since 1981: Fastest to halfway: 2012 (April 20) Slowest to halfway: 2022 (May 23)
https://www.nohrsc.noaa.gov/nsa/
SNOW DEPTH

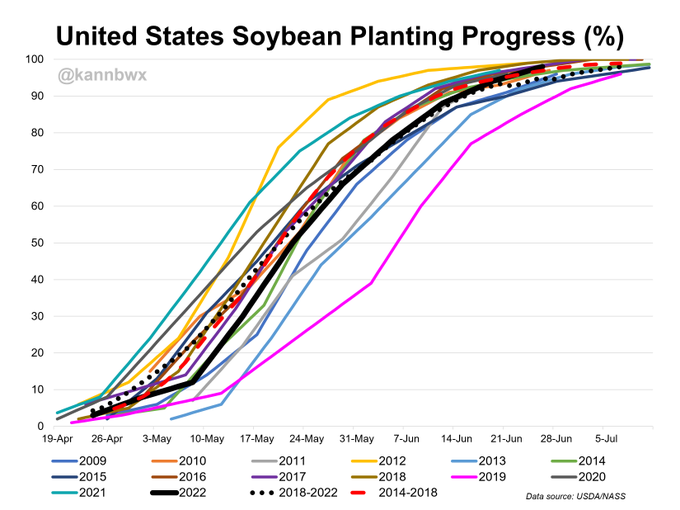
Planting for U.S. #soybeans typically reaches the halfway mark by May 22 and 70% complete by the end of May (using 10yr average). Since 1980: Fastest to halfway: 2000 & 2021 (May 12) Slowest to halfway: 1995 (June 8) Second slowest: 2019 (June 6) 2022 halfway: May 22
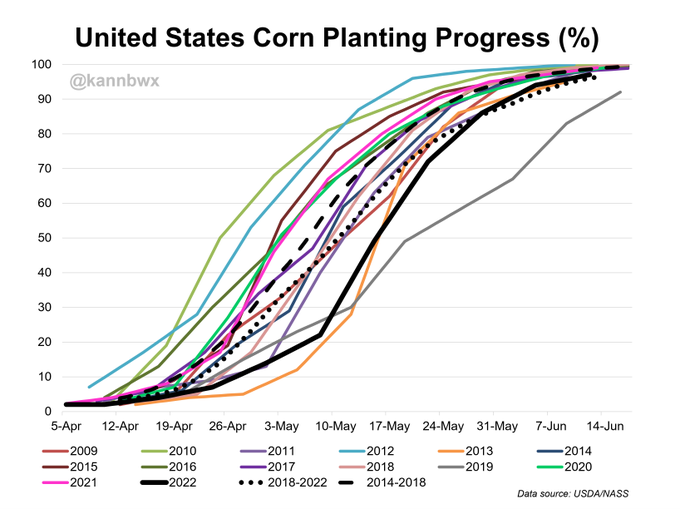
U.S. #corn was 2% planted by Sunday, normal pace so far but still very early. The 10-year average for reaching halfway planted is May 9. Since 1980: Fastest to halfway: 2010 (April 25) Slowest to halfway: 2019 (May 20) 2022 halfway: May 16
https://www.marketforum.com/forum/topic/83844/#83880
Corn seed likes temperatures above 50 degrees for germination.
This map is updated daily(with previous days data).
https://mesonet.agron.iastate.edu/agclimate/soilt.php
metmike: This has a great deal to do with the record poor condition of the HRW crop and decent condition of the SRW crop.
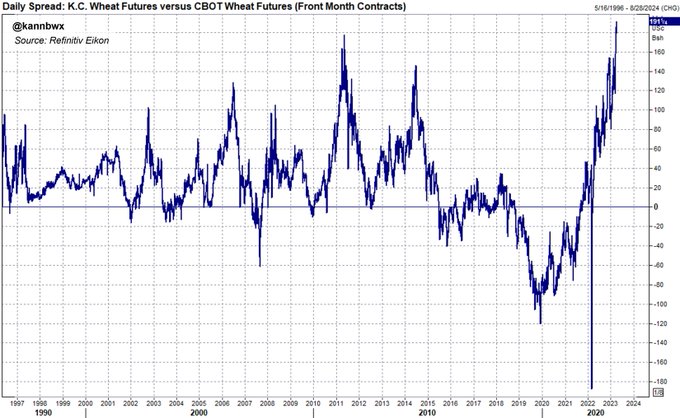
Front-month Kansas City #wheat futures notched an all-time record premium of $1.91 per bushel over Chicago as of mid-session Thursday. In fact, every day since last Thursday was higher than the old record set in 2011.
M,
Which contract reflects the HRW price the most, KC or Chicago?
Hi Becker,
Great question. Here's everything to know about wheat with regards to that.
The Chicago wheat is the SRW contract. Soft Red Winter wheat. ZW symbol. It has much more volume than the other 2.
The Kansas City wheat is the HRW contract. Hard Red Winter wheat. KE symbol. Less than half the volume traded as ZW.
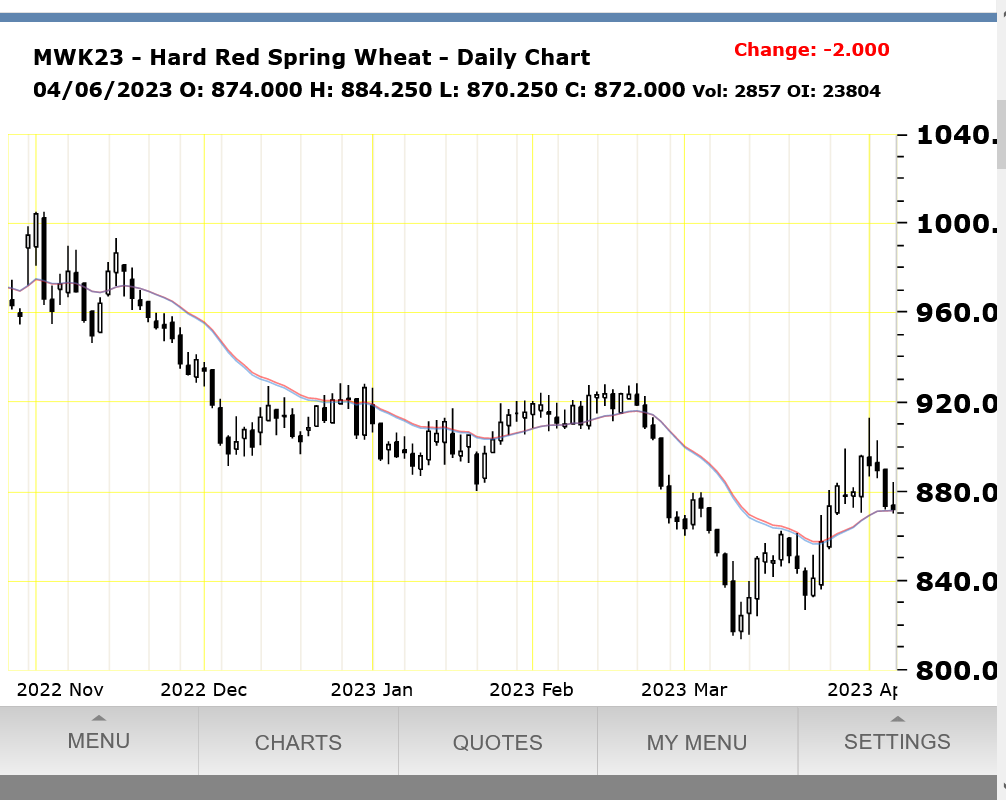
The Minneapolis is the HRS wheat. Hard Red Spring wheat. MWE symbol. Even more thinly traded than the HRW.
Both the HRW and HRS are hard red wheat. SRW is SOFT red wheat.
+++++++++++++++++++++++++
SRW below is everything East of the Mississippi River + Missouri.
HRW is everything West of the Mississippi -Missouri. That's where the drought has been, see maps above. #1 producing state KS is the most important.
https://www.nass.usda.gov/Charts_and_Maps/Crops_County/ww-pl.php

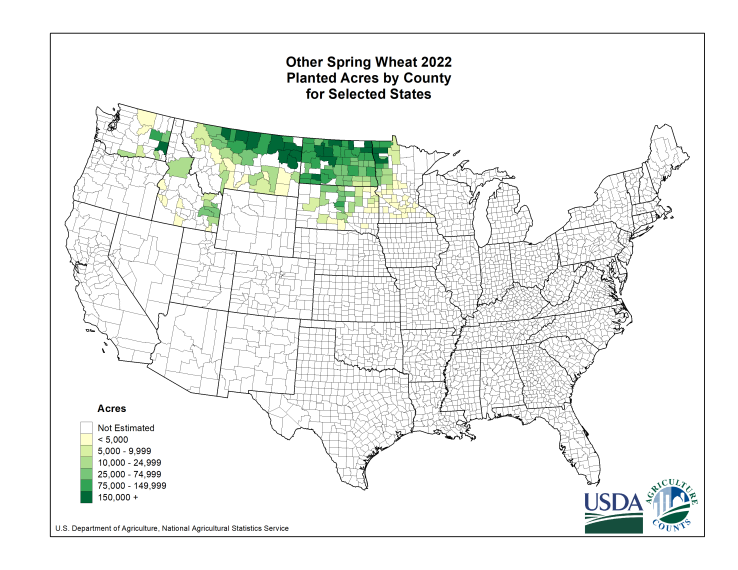
This is all HRS wheat below. MWE symbol. All covered in snow right now.
https://www.nass.usda.gov/Charts_and_Maps/Crops_County/sw-pl.php
Wheat made a major low I actually have not been following the MWE wheat.
+++++++++++++++++
Price charts below:
1. ZW made a low on March 10, then slightly lower 2 weeks later but only up less than 20c since then. Volume 53,000 today.
2. HRW made a low on March 10. Then, 2 weeks later a brief, much higher spike low. Up almost $1 from the March 10 low. Volume 21,000 today
3. MWE, like the others made a major low on March 10. Like the HRW made a brief, higher spike low 2 weeks later but is up on .60c since then. Volume only 3,000 contracts today. Extremely thinly traded.
I note that the volume for the first 2 is around 30% of the open interest.
With #3, MWE, the volume is only 12% of the OI.
The 3 times higher volume % wise of the first 2 compared to positions at the end of the day for the 3rd one, suggests much more day trading going on with the first 2. That makes sense. Big day traders, usually speculators, need alot of liquidity to get in and out with big bids/offers close to the market to fill their order. Minn wheat is very thinly traded/does not have that so you have mostly position traders that hold their position for numerous days.
%20Daily%20Commodity%20Futures%20Price%20Chart%20CBOT.png)
%20(Electronic)%20Daily%20Commodity%20Futures%20Price%20Chart%20KCBT.png)
the horrible crop rating right now is all HRW. That why it’s gained almost $1 on the SRW price!
Modestly higher open for wheat. The KE is leading the way, up around +15c with MWE +13c and W up 9.5c.
Rains taken out of the S.Plains forecast since late last week, where we have the major drought causing near record low crop ratings for the KE wheat.
MWE needs warm and dry.
C and S are both down a tad. Weather is not a great force impacting their price right now.
Wheat backed off to around the opening price, even lower than that for Chicago wheat but still clinging to some decent gains.
KE leading at +9c.
After a brief spike higher after the open. Wheat saw selling pressure reverse the price to lower. Traders during the day have consistently been much more bearish wheat than those overnight.
KE has bounced back to +4c. We should continue to note the huge increase in planted acres that hit the market with a bearish USDA surprise at the end of March which continues to be a black cloud looming over the bulls.
It's still just April and we have a developing El Nino which is much more favorable for rains in the S.Plains this Spring than the last few drought causing La Nina years.