Previous threads, the last one is still focusing on the forecast.
12-19-22: Bitter Cold Coming!
Started by metmike - Dec. 19, 2022, 12:08 p.m.
https://www.marketforum.com/forum/topic/91552/
12-12-22 ALERT: Bitter cold coming!!
https://www.marketforum.com/forum/topic/91423/
++++++++++++++++
For the next 3+ days we will track the storm on this thread. Most of the maps below are constantly updated every few minutes, especially for surface observations.
Current Hazards at the link below.
Go to the link below, hit hazards box in the top right hand corner(it will also define all the color codes), if its not already in the hazards mode when you load the link.
Then you can hit any spot on the map, including where you live and it will go to that NWS with all the comprehensive local weather information for that/your county.

Latest National radar images
https://www.wunderground.com/maps/radar/current
This link below provides some great data. After going to the link, hit "Mesoanalysis" then, the center of any box for the area that you want, then go to observation on the far left, then surface observations to get constantly updated surface observations or hit another of the dozens of choices.
 |
Current Conditions below updated every few minutes.
N.Rockies-extreme high barometer reading!

UPPER MIDWEST
https://www.spc.noaa.gov/exper/mesoanalysis/new/viewsector.php?sector=13#


https://www.spc.noaa.gov/exper/mesoanalysis/new/viewsector.php?sector=13#
LOWER MIDWEST
https://www.spc.noaa.gov/exper/mesoanalysis/new/viewsector.php?sector=20

https://www.spc.noaa.gov/exper/mesoanalysis/new/viewsector.php?sector=20#

https://www.spc.noaa.gov/exper/mesoanalysis/new/viewsector.php?sector=20# 
Great Lakes


12z guidance is starting to come out and I'm sticking with 3"+ of snow for Southwest, IN/Evansville(more than the NWS which is 1-2") after seeing some of it.
Will use 3"+ to leave room for some potential upside which seems very possible.
thanks much Mike
You're welcome cutworm! Additional guidance likes the lower amounts here but I'll stay with 3+ inches because of the atmospheric dynamics. This one will be tough to measure outside because we'll be living in a giant snow blowing wind tunnel for 24 hours (-:
One thing to be grateful for.
Because this one isn't tapping Gulf moisture, it won't be anything close to rivaling the blizzard of 1978 which had a system coming up from the south, chock full of moisture absorbed into it.
Press your cursor on the maps/links below to see them.
You'll especially appreciate these links at the bottom from IN/OH cutworm(who lives in SE Indiana)
https://www.weather.gov/iln/19780126
Daily Weather Maps from January 24-27, 1978
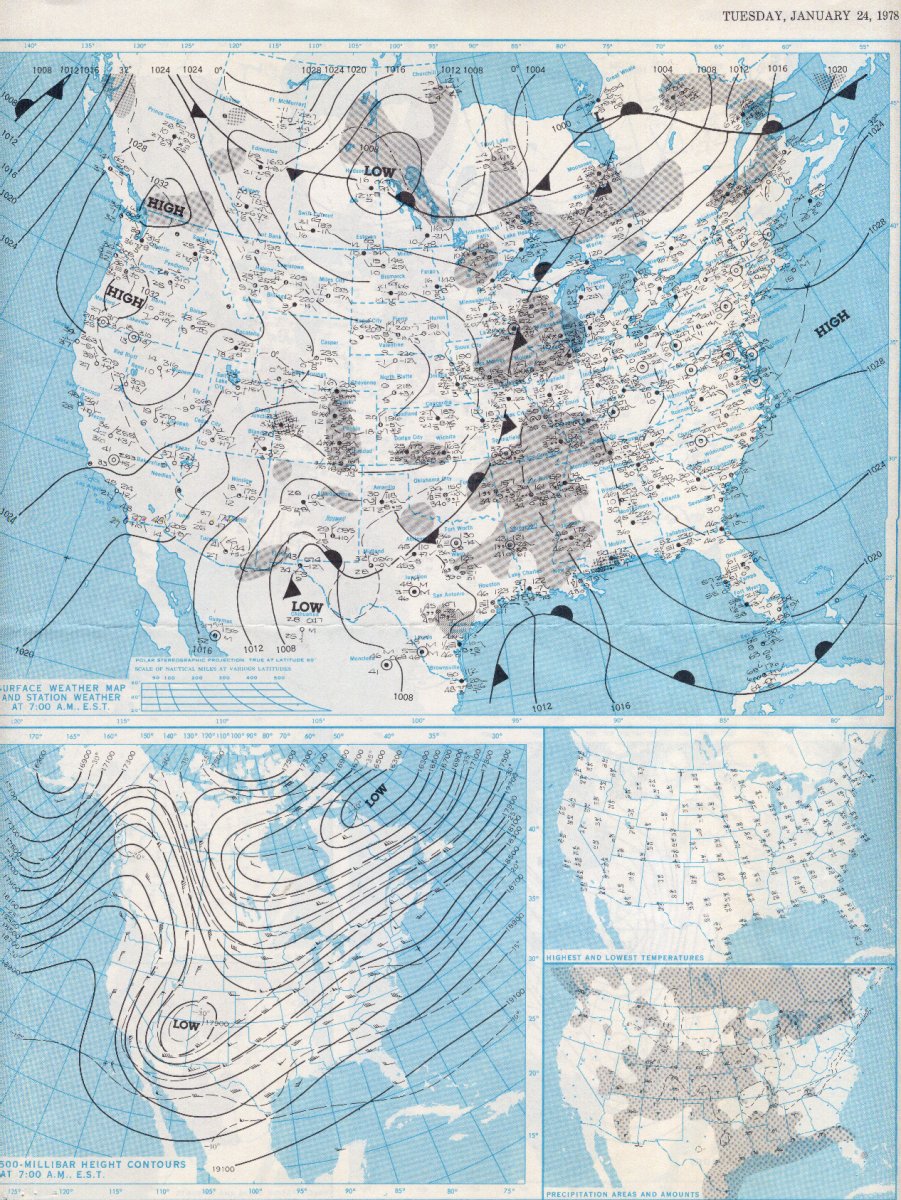 January 24, 1978 | 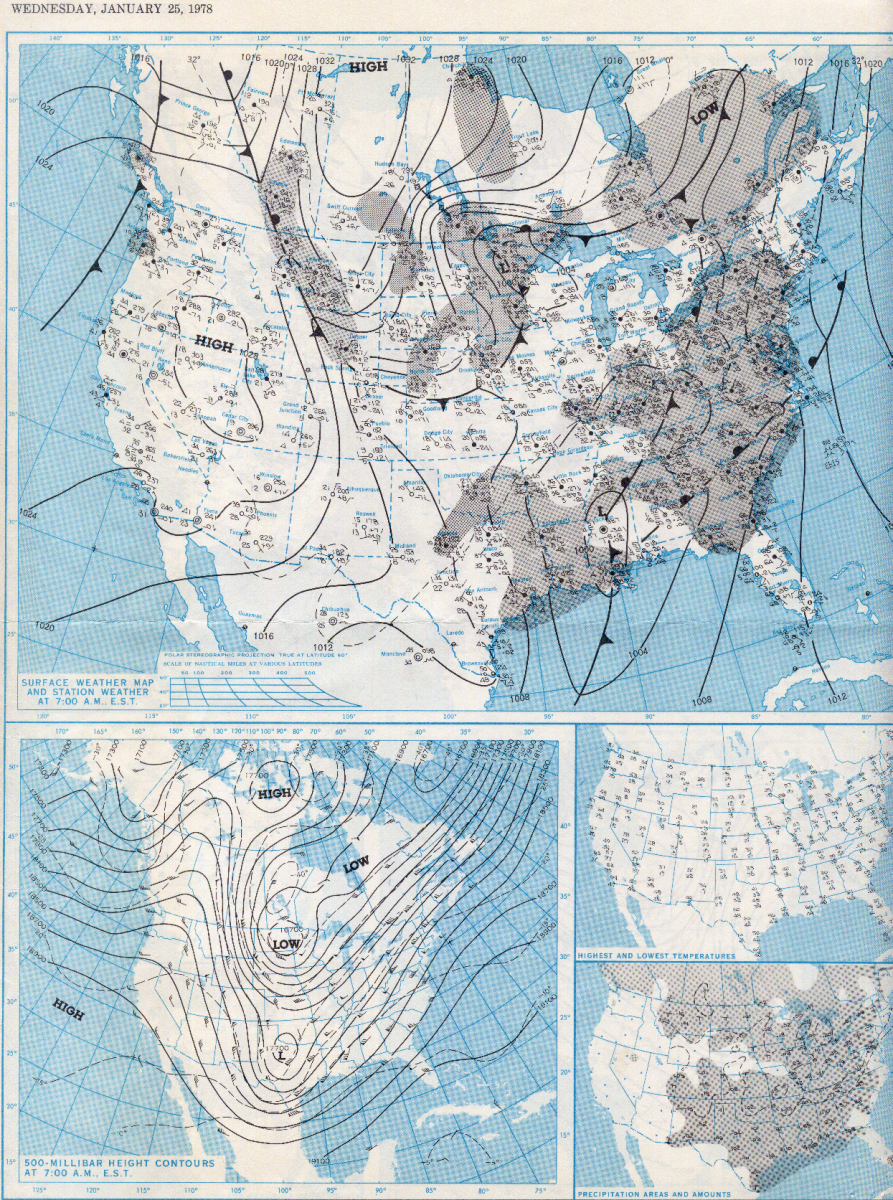 January 25, 1978 |  January 26, 1978 | 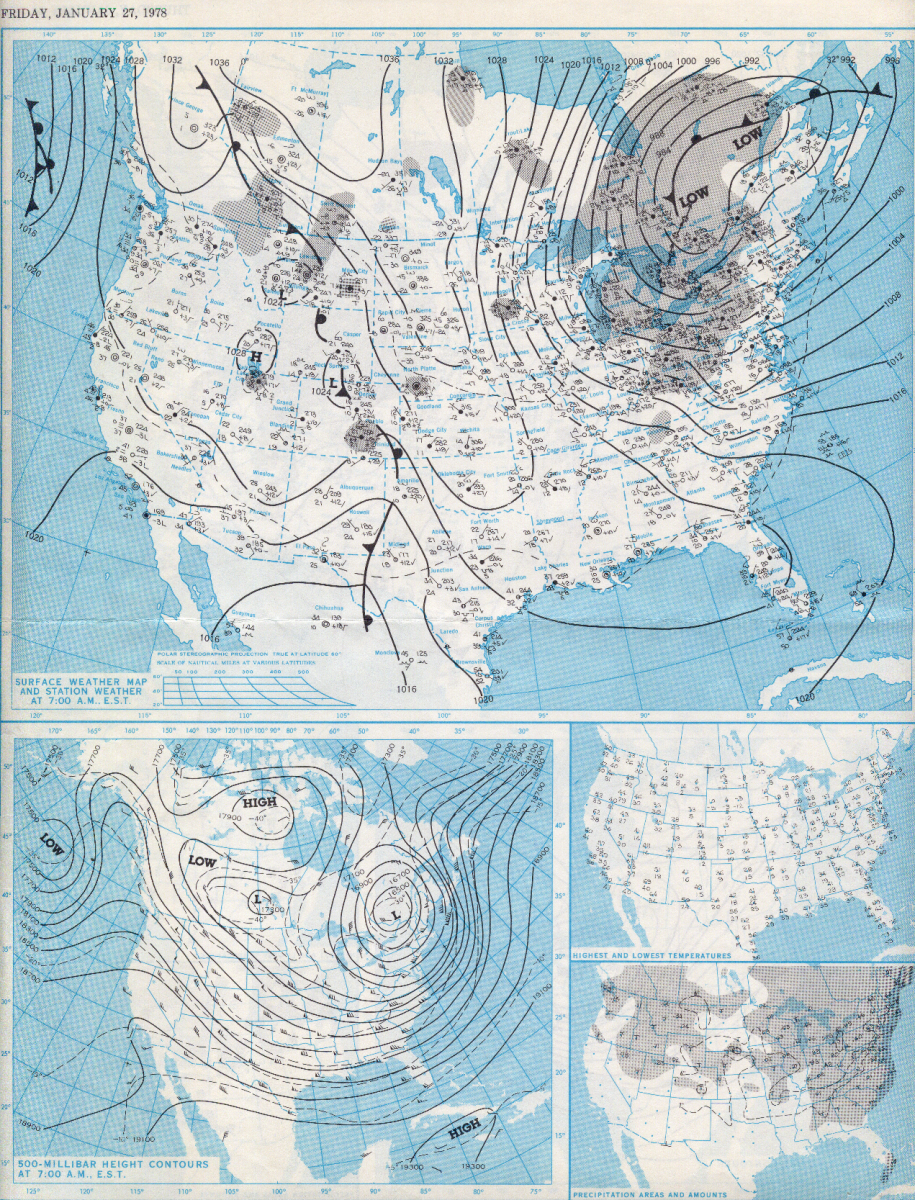 January 27, 1978 |
Additional Details for CVG, CMH, and DAY.
Summary from NWS Akron, OH (Special Weather Statement from Feb 1, 1978)
Well, we're now only one day away from what has a good chance to be the strongest Arctic high to enter the lower 48 states since December of 1983! Here's the 12Z run update for today for the highest SLP in mb in the lower 48 on 12/22 (in Montana) vs runs from 24 hours ago (1064 is all-time lower 48 record back to late 1800s):
GFS 1067 (0)
JMA 1065 (+1)
ICON 1063 (-1)
Euro 1059 (-1)
CMC 1059 (0)
UKMET 1052 (+1)
AVG ~1061 (no change)
I suspect that the GFS will verify a few mb too high, but we'll see as the various resolutions of the 12Z NAM have 1067-8! The UKMET is either going to shine or fail with their continued much lower SLP vs other models. If I throw out the highest and lowest (excluding NAM), the average is 1061.5 mb.
Thanks Larry,
So sorry for overlooking something and I was out most of the day today.
I was using some of the same Midwest maps for tracking the storm that I've used on the main weather page for grains/natural gas and totally forgot to use the Rockies to track the surface high pressure.
So that one is leading off at the top now!
Just out 0z GFS products are adding snow which is why I didn't limit my upside with the previous 3+ inches.
Thinking 4-5 inches might be better but will wait to see the other models.
https://mag.ncep.noaa.gov/Image.php
Hey Mike,
Thanks so much for doing that! I'll be looking at these maps through tomorrow. Based on what your SLP maps showed, the UKMET is going to fail badly. This makes me wonder if the UKMET SLPs are really nonconverted measured pressures. The model says they're SLPs but I wonder!
This brings me to a question. The map showed Great Falls (for example at the time I saw it) at 1053 mb SLP, which is what records are based on, of course, to make everything even keel. Now when I went to the link below, I saw a "pressure" (obviously not SLP) of only 30.61", which is only ~1037 mb since it is nonconverted pressure measured up at 1,005 meter elevation.
Do you know the formula to convert that takes us from the 1037 mb measured pressure to the 1053 SLP? I can't find it and wanted to see that the 1037 mb jibed with 1053 SLP. I did read that temperature is a factor. The temperature was then at -35 C or -29 F. Thanks in advance.
Link to hourly readings including Great Falls:
The front is moving faster also.
So the temps will start to crash late afternoon, dropping 40 degrees from then to midnight.
The feels like temperature, during wind gusts will be 60 degrees colder during that 8 hour period.
No kidding. By midnight, the temp will have crashed to ZERO with winds gusting to 40 mph and the wind chill at -25 deg. F and feeling 10 degrees colder during gusts.
Right after the front hits, snow will be falling furiously for a couple of hours and with extreme blowing and reduced visibility to near 0.
There will be flash freezing of any moisture on the roads with the potential for black ice in areas that were wet and suddenly turn to ice.
I don't know the answer, Larry.
Sorry for not answering right away as I made the last post then left the forum for a couple of hours.
I enlarged the N.Rockies surface map so we can see the surface pressure reading on the top right side of the station better without having to go to another link or to enlarge it.
++++++++++++++
Other models had less snow, basically agreeing pretty close with 2 inches..........so I'll stick with 3" for total snow in Evansville, IN and mention the chance it could be more a bit more, with only the GFS thinking more.
The front is really moving, possibly getting here just before 3pm now vs what looked like 6-7pm a few days ago.
It's that arrival of the cold front when the distinct change hits. Temps down 30 degrees in around 4 hours. Winds shift to the NW and pick up rapidly, gusting to 40+ mph and only diminishing slightly on Friday.
Weather like the 24 hour period after the front passes thru has only happen a handful of times in Evansville the last century.
It looks like to me that the highest SLP will most likely be in the upper 1050s meaning the Euro and CMC's 1059 will likely be the closest.
Thanks Larry!
I’m sure they have a bunch of additional stations in MT in between these official stations and I’ve been so swamped that I didn’t look for the list.
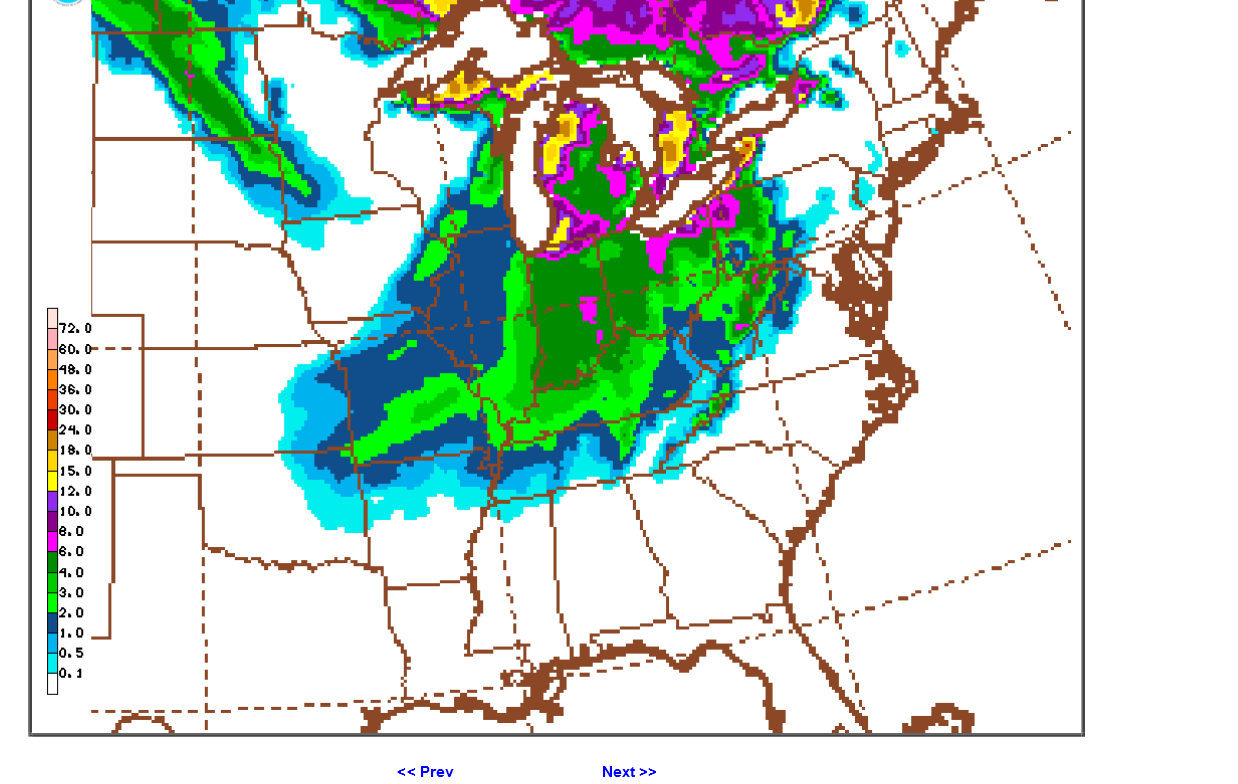
Last 6z GFS operational model......still 3+" despite other models having lower amounts.
The pink is 6 inches. The dark green surrounding the pink is 4 inches, which is most of Indiana. You can see from the radar image above, this is going to fall really fast in several hours.........then be over.
https://www.wunderground.com/maps/radar/current
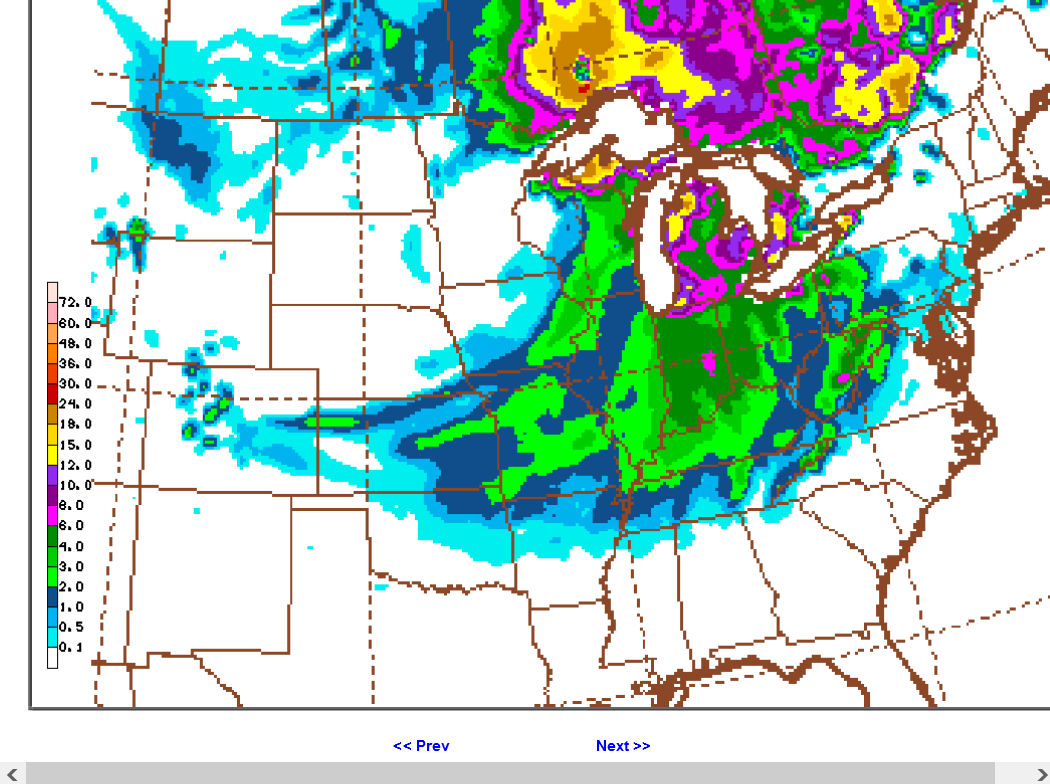
Last run of the GFS model(12z run) we'll get before it hits. 4+" across the entire state of IN! Pink is 6 inches. I'm good with this!
I JUST CHECKED ON MACON, MO,
AT 3 THIS MORNING, IT WAS 29... AT 4, IT WAS DOWN TO 17!!! WHOA, BABY!!!
HERE'S A CHAT COMMENT "11:47 AMBrayten R Evansville Indiana will receive 6 inches of snow" AS THEY AWAIT THE LIVE FEED @ 3:00 THIS AFTERNOON ON>>>>>>>>
The NWS just expanded the Winter Storm Warning for the snow part to include Evansville for the first time. They still say 1-3 inches for their worded forecast but 2-4 inches in the updated warned area in IN, including northeast of here. I think that 6 inches is possible in those favored areas to the northeast.
The front went thru St. Louis around an hour ago and temps have dropped 15 degrees and the wind chill is about to drop below 0.
What was the highest surface pressure reading that you saw, Larry?
Last look at models and that 12z GFS solution has the most by far with 4 inches of snow. The 12z European model is a tad under 3 inches. Regardless, the way the snow is going to be blowing around it's going to be hard to measure and tell the difference between an inch or even 2.
A map like this only happens once every few decades.
These are snapshots of just after 6:30pm on 12-22-22.
The temperature in southeast Indiana is in the low 40's. Just over 200 miles to the northwest, in the next state over, central Illinois, the temperature is below 0! With a wind chill of -27 Deg. F......so it feels 67 degrees colder!!!
Over the tightest part of the temperature gradient, just behind the front the temperature drops 25 degrees over around 50 miles(with the wind chill dropping even more like 35 deg. F).
![]() https://www.weathercentral.com/weather/us/maps/wind-chill
https://www.weathercentral.com/weather/us/maps/wind-chill
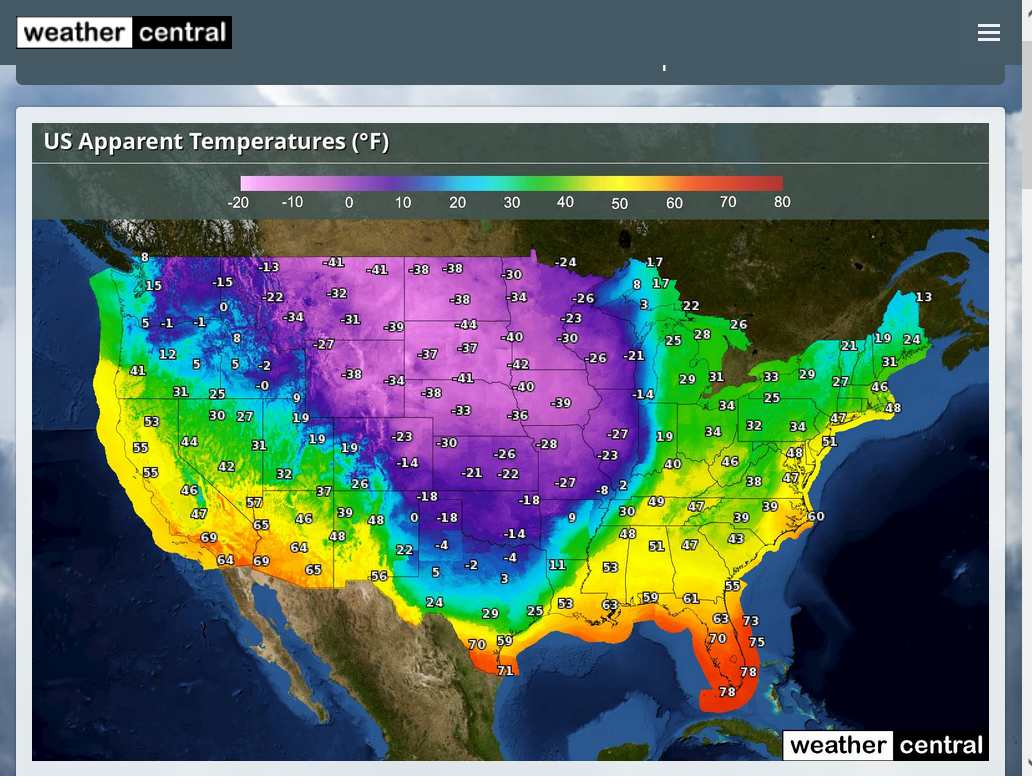
It feels almost 130 degrees colder right now in North Dakota than it does in S.Florida!
We'll see if this one updates automatically like those at the top of this thread.
https://www.mesonet.org/index.php/weather/map/wind_chill_heat_index1/air_temperature

3am:.........yes it does!
As we mentioned previously, this air mass, a couple of weeks ago was in Siberia. The Siberian express, with a cross polar flow, tracking across Canada the diving into the US brought it here.
The bitter cold in Siberia (which happens every Winter because of the absence of warming daylight/sunshine that causes a massive pool of cold to get deeper and colder) was transported bodily to the US.
As that air vacated, air from somewhere has to replace it......and it that air came from the milder mid -latitudes.
Sort of a flip-flop or trading of air masses. When steering currents transport an air mass 1,000+ mile wide from north to south in one place on the planet, there has to be an equal amount of air moving from south to north in other places to balance the atmosphere.
https://www.psl.noaa.gov/map/images/ens/t850anom_f024_nh.html
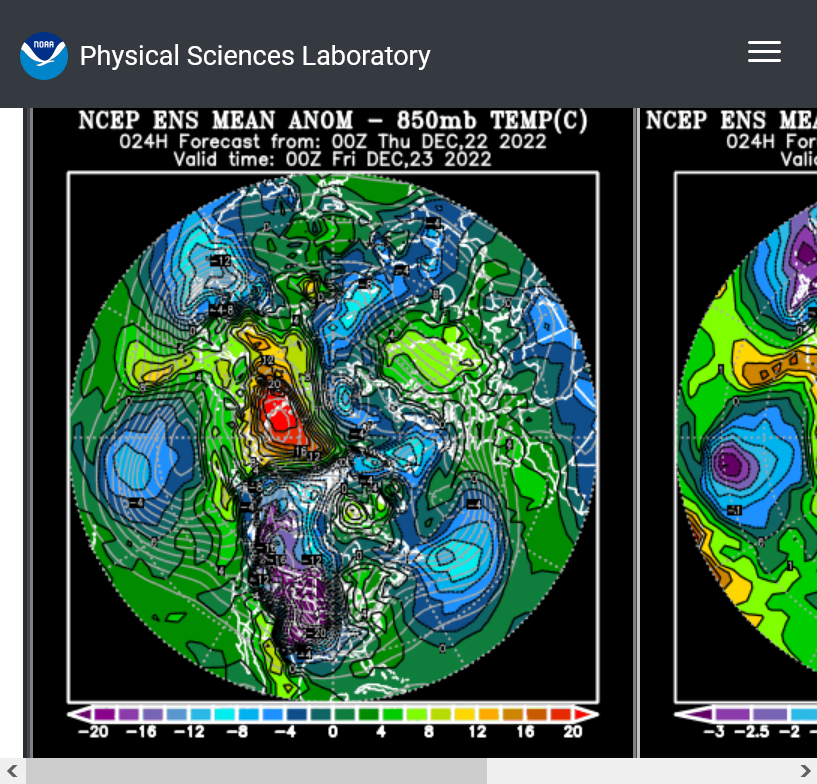
The set up was originally explained here:
Evansville should come in with snow totals of just less than 3".
Hopefully we can get a slew of them for the area from the NWS later this week.
2.5 inches at the airport?
At our house and other places, it's impossible to accurately measure the snow because the powerful winds have wreaked havoc with snow blowing off of the usual favored places to measure.
After numerous attempts to guesstimate, very early this morning, it was just under 3 inches here, consistent with the NWS accurate measurement that uses instruments unaffected by the wind.
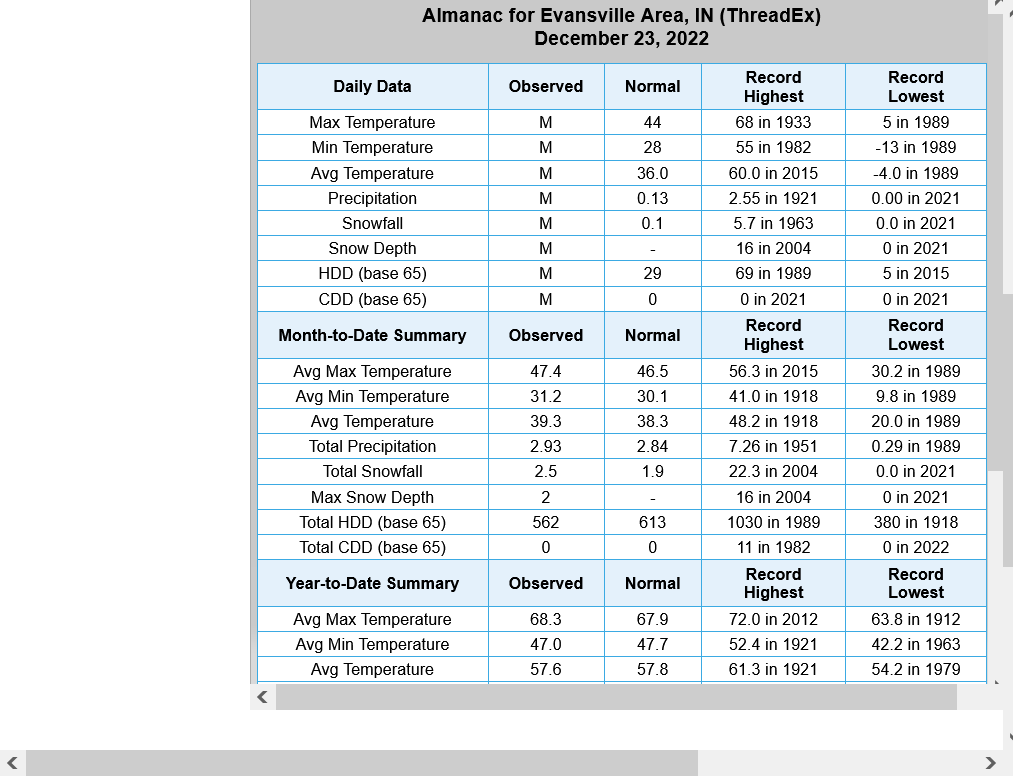
There are several interesting items to note on the Evansville In climate almanac above.
1. The record LOW for this date was -13 set in 1989. That was our coldest December in history and one of the 2 extreme weather patterns that caused me to change my career from tv meteorologist to commodity trading meteorologist. The other event was the growing season drought of 1988.
2. The record coldest Max for this date was also set in 1989 at +5 Deg. F. We WILL break that record today.
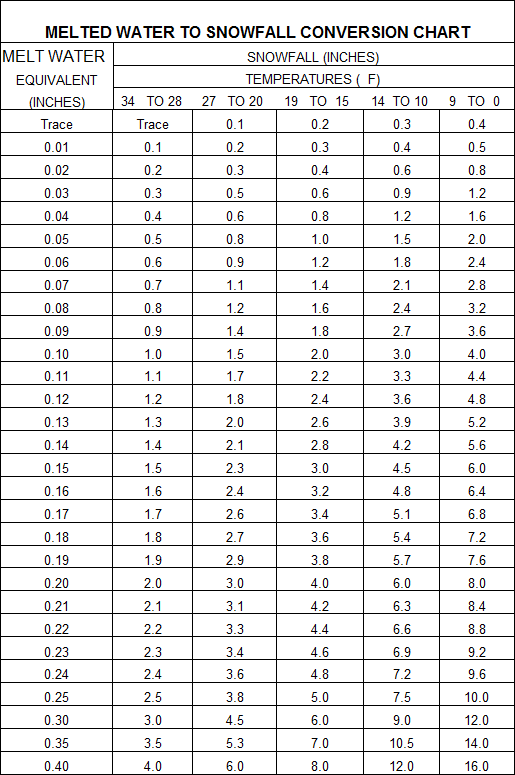
3. When it snows in the single digits, like we had yesterday evening(much of the snow accumulated when the temp was below +10 Deg. F) miniscule amounts/differences in the atmospheric H2O profile make a huge difference in how much snow falls because the snow/water ratio is enormous. See the chart below.
4. It looks like the NWS reported .12 of liquid from the snow that fell Thursday pm. It fell as the temp dropped from 18 Deg to -1 Deg. F, just over half (.06) when the temp was less than 10. Using that on the chart below, we would get 2.4" during the coldest part of the event(9 to 0) and between 1.8 to 1.2 during the early stages. This would add up to 4" of snow but I don't think quite that much actually fell at our location.
https://w1.weather.gov/data/obhistory/KEVV.html
More snow accumulation reports should be available.
The biggest point is that miniscule amounts of moisture at these bitter cold temps make alot of snow in inches.......which makes it impossible to fine tune amounts to the exact inch or so.
Turns out that 1/40th of an inch of water can make an inch of snow with temperatures in the single digits!
https://www.eldoradoweather.com/current/misc/snow-to-water.html
5. Some of our wettest snows have had such a low ratio that .12 would have barely made .5 inches of snow! Yesterdays extremely dry snow ratio was almost 6 times that.
Not sure how accurate this site is but there was LESS snow than expected, especially to our north, where all the models had MORE snow in that direction.
https://weatherstreet.com/weather-forecast/indiana-snow-cover.htm
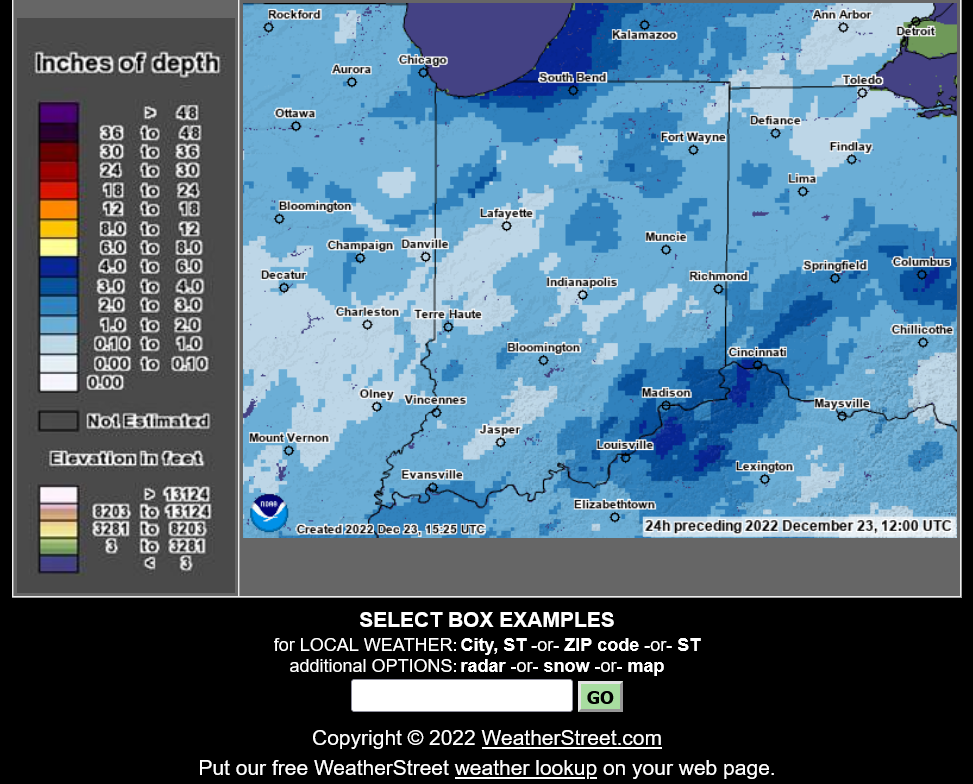
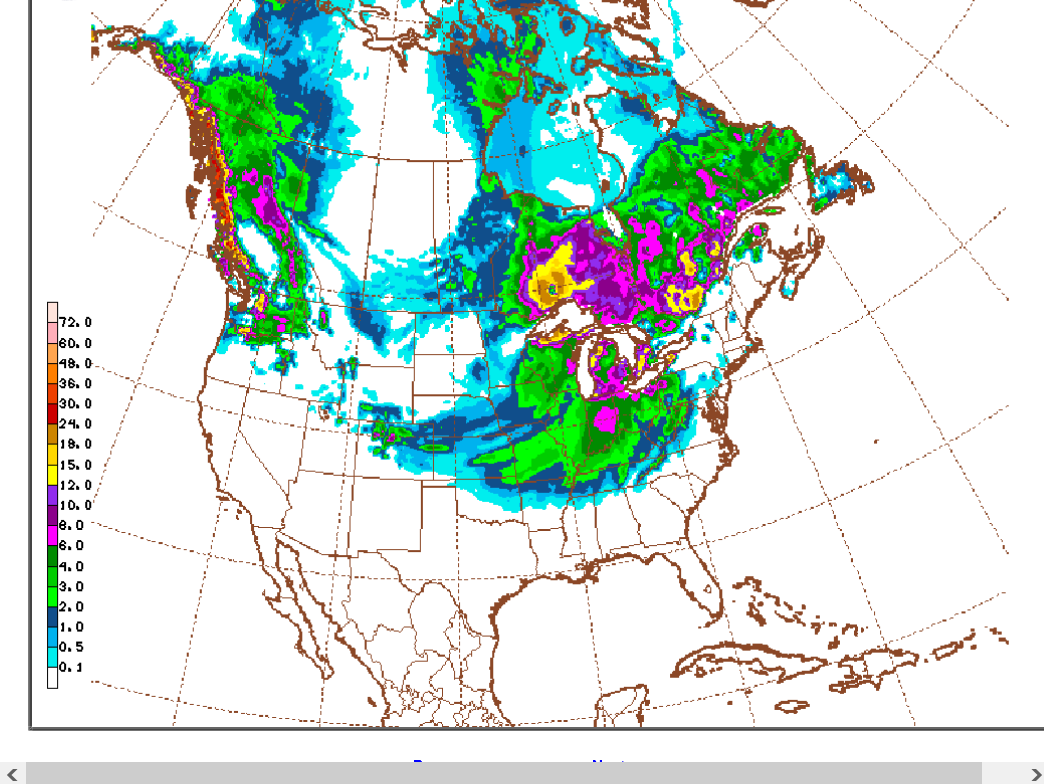
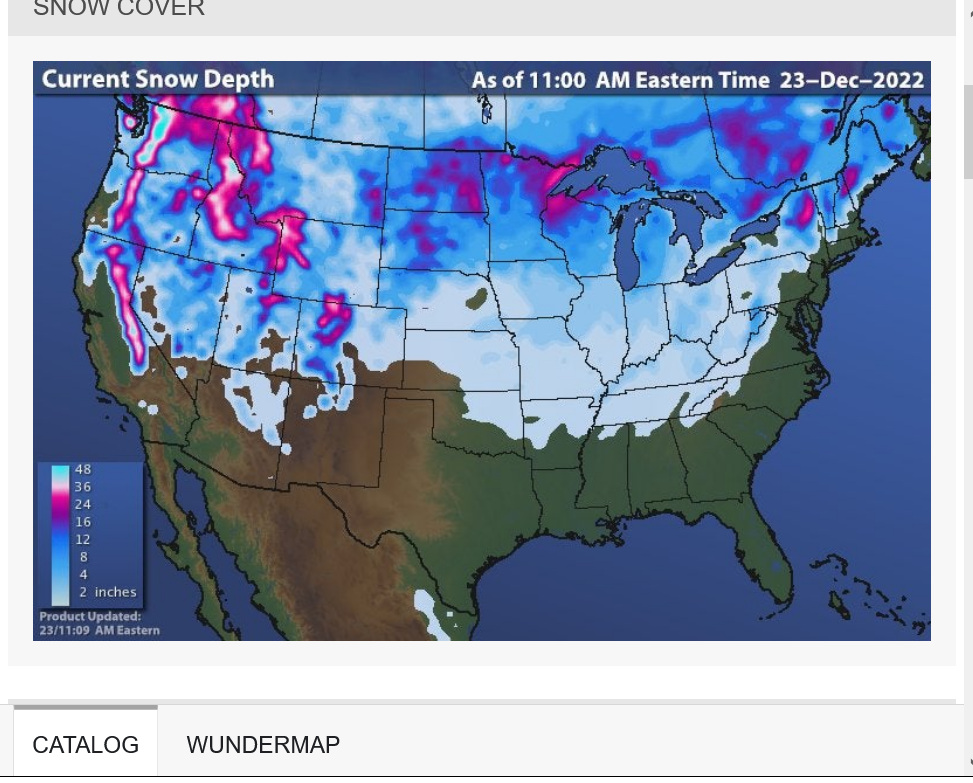
Still snowing in the Great Lakes but here's the current snow depth for the country and S.Canada.
https://www.wunderground.com/maps/snow/snow-cover
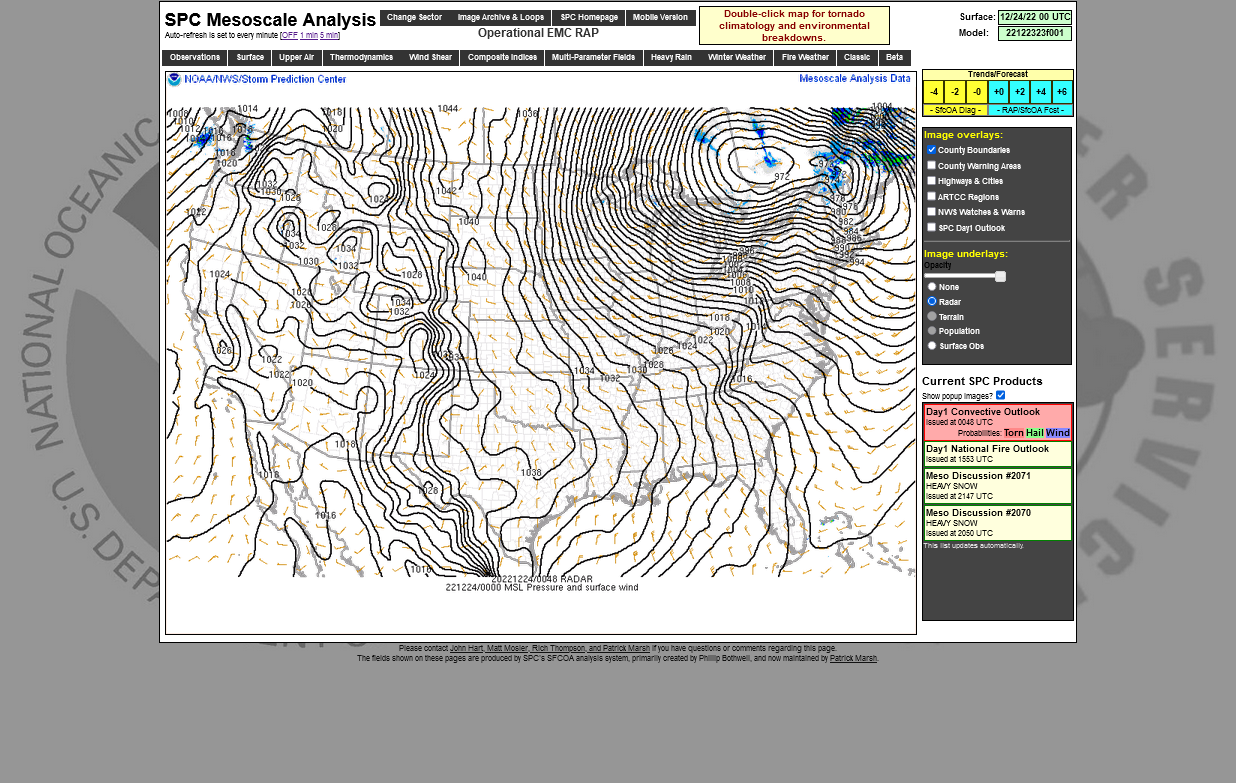
Another freeze frame image of something you won't see that often on our weather maps. The tremendous pressure gradient from high to low is what creates wind. This was just before noon on 12-23-22.
![]()
This storm is NOT as intense/deep as some intense storms in the past. January 1978 for instance, which had a MUCH lower barometer reading. Winds were STRONGER and snow amounts were 5 to 10 times greater in many locations.
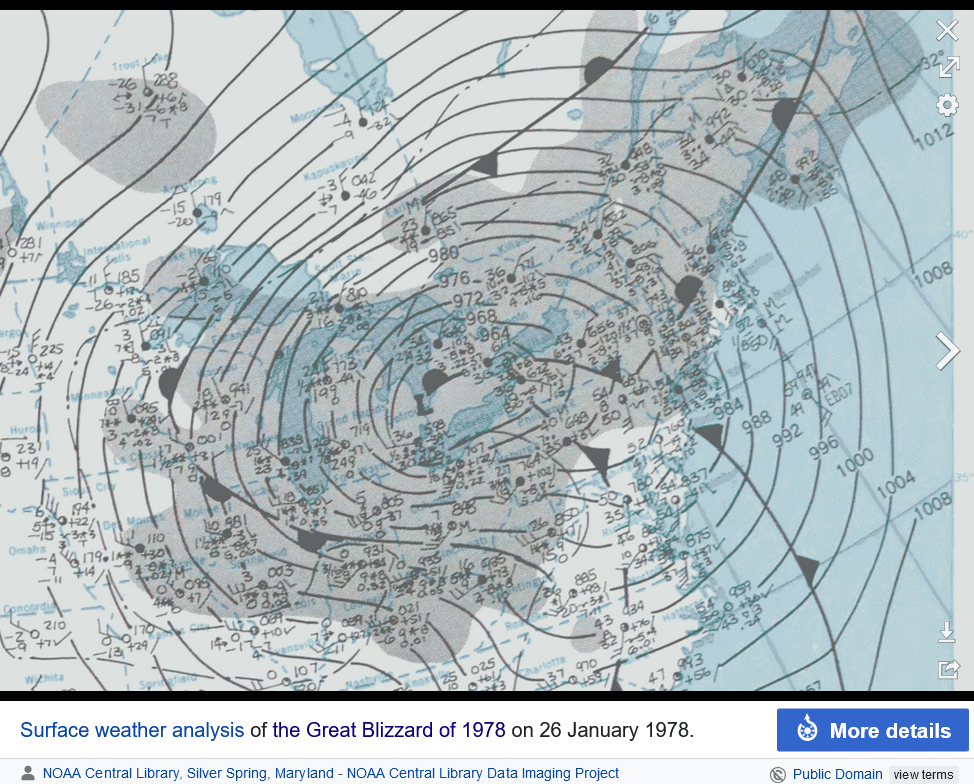
The following table displays selected U.S. snowfall totals during January 25–29, 1978:[3]
| State | City/location | Amount (inches) | Amount (mm) |
|---|---|---|---|
| OH | Dayton | *12.2 | *310 |
| MI | Detroit | 8.2 | 208 |
| MI | Flint | 9.9 | 251 |
| MI | Grand Rapids | 19.2 | 488 |
| MI | Houghton Lake | *15.4 | *391 |
| IN | Indianapolis | *15.5 | *394 |
| IN | South Bend | 36.0 | 914 |
| MI | Lansing | 19.3 | 490 |
| MI | Muskegon | 52 | 1321 |
| MI | Traverse City | 22-28 | 559-711 |
| IL | Chicago | 12-13 | 305-330 |
Note: * = Total data for a 24-hour period.
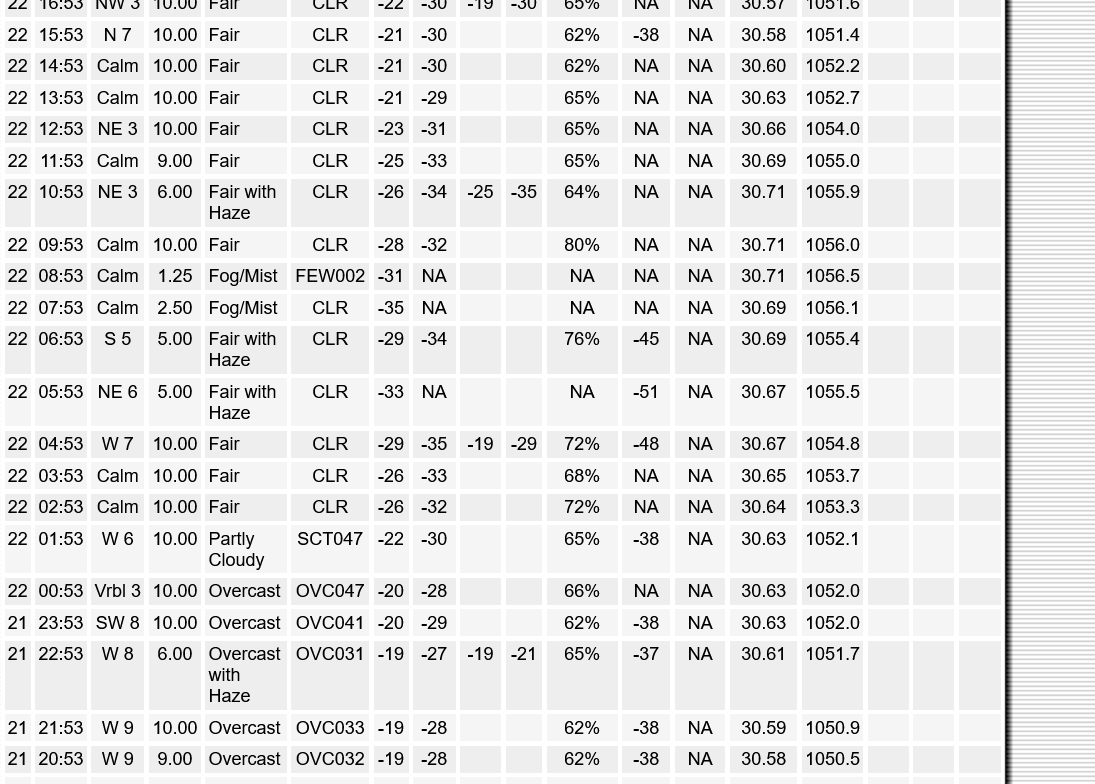
From best I can tell, I'm guessing no record high SLP but still high 1050s, which would still quite possibly be the strongest high since 12/1983. I can say that the highest for MT, IF this link to hourlies (which is always updating) at Helena has accurate SLP data, is at least 1056.5 mb (this says that occurred at 8:53. AM MST on 12/22):
https://w1.weather.gov/data/obhistory/KHLN.html
2208:53Calm1.25Fog/MistFEW002-31NANANANA30.711056.5
Thanks very much Larry,
I did a freeze frame of that source so that we wouldn't lose it as its updated constantly but after 3 days, the old info at the bottom is replaced with new info at the top.
We can see the 1056.5 on the far right at 8:53 am in the middle of the screen.
This is the value of sea level pressure in mb(millibars). The temp was -31 deg. F with calm winds and mostly clear skies, ideal radiational cooling to maximize heat loss at the ground.
https://w1.weather.gov/data/obhistory/KHLN.html
Helena Regional Airport
This is the snow cover condition in MT.
https://www.nohrsc.noaa.gov/nsa/index.html?year=2022&month=12&day=23&units=e®ion=Upper_Midwest

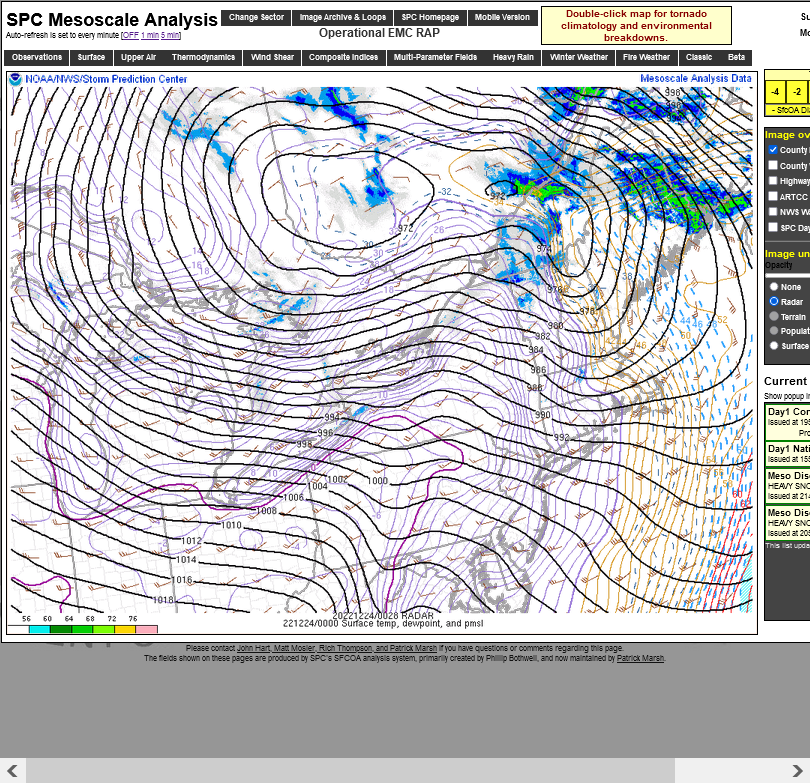
Snap shot of departing but deepening storm just before 7pm, 12-23-22 with the lines of constant temperature in purple.
Note how the isotherm profile is greatly affected by the unfrozen Great Lakes.
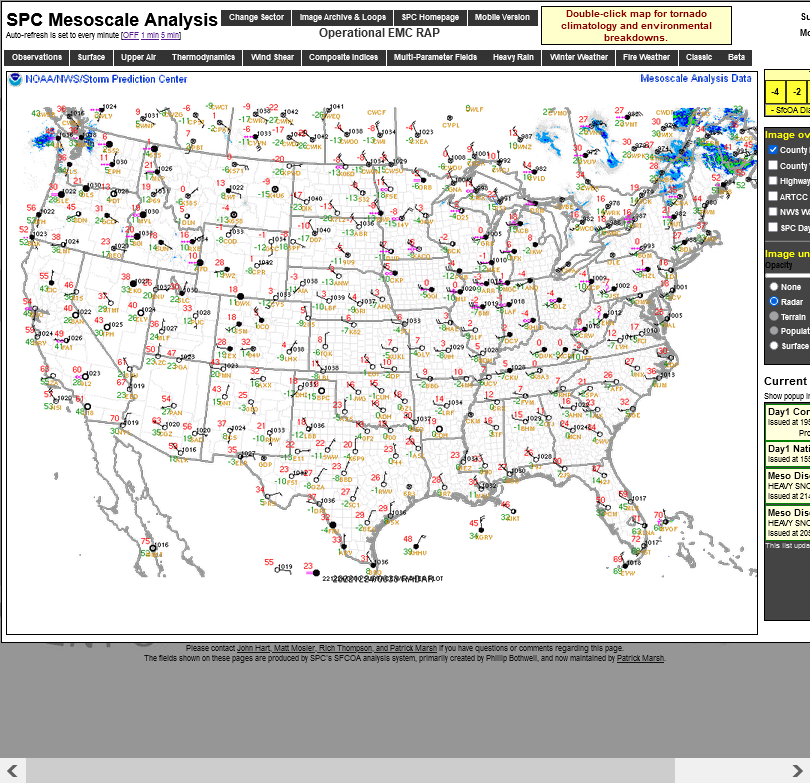
National Scale view with just 2 mb pressure differential in isobars.
https://www.spc.noaa.gov/exper/mesoanalysis/new/viewsector.php?sector=19&parm=ttd
https://www.spc.noaa.gov/exper/mesoanalysis/new/viewsector.php?sector=19&parm=ttd#
Mike,
I found three more but don't know that any can be trusted or even recognized, especially since they're all well up in elevation (over 3,600 feet): links to last 7 days:
1) Ruby Valley Field (KRVF) : 1066.62 on 12/22 at 7:35 AM MST
https://www.weather.gov/wrh/timeseries?site=Krvf&hours=168
| Dec 22, 7:35 am | -31 | -38 | 67 | N | 0 | SCT026 SCT031 | 1066.62 | 25.65 | 30.59 |
2) Ennis Big Sky Airport (KEKS): 1065.65 on 12/22 at 9:55 AM MST:
https://www.weather.gov/wrh/timeseries?site=Keks&hours=168
| Dec 22, 9:55 am | -29 | -38 | 60 | N | 0 | 10.00 | CLR | 1065.65 | 25.02 | 30.51 |
3) Ravalli County Airport (KHRF}: 1059.57 on 12/22 at 8 AM MST:
https://www.weather.gov/wrh/timeseries?site=Khrf&hours=168
| Dec 22, 8:00 am | -24 | -29 | 75 | SE | 5 | 10.00 | BKN031 BKN039 | 1059.57 | 26.81 | 30.64 |
I don't know either, Larry.
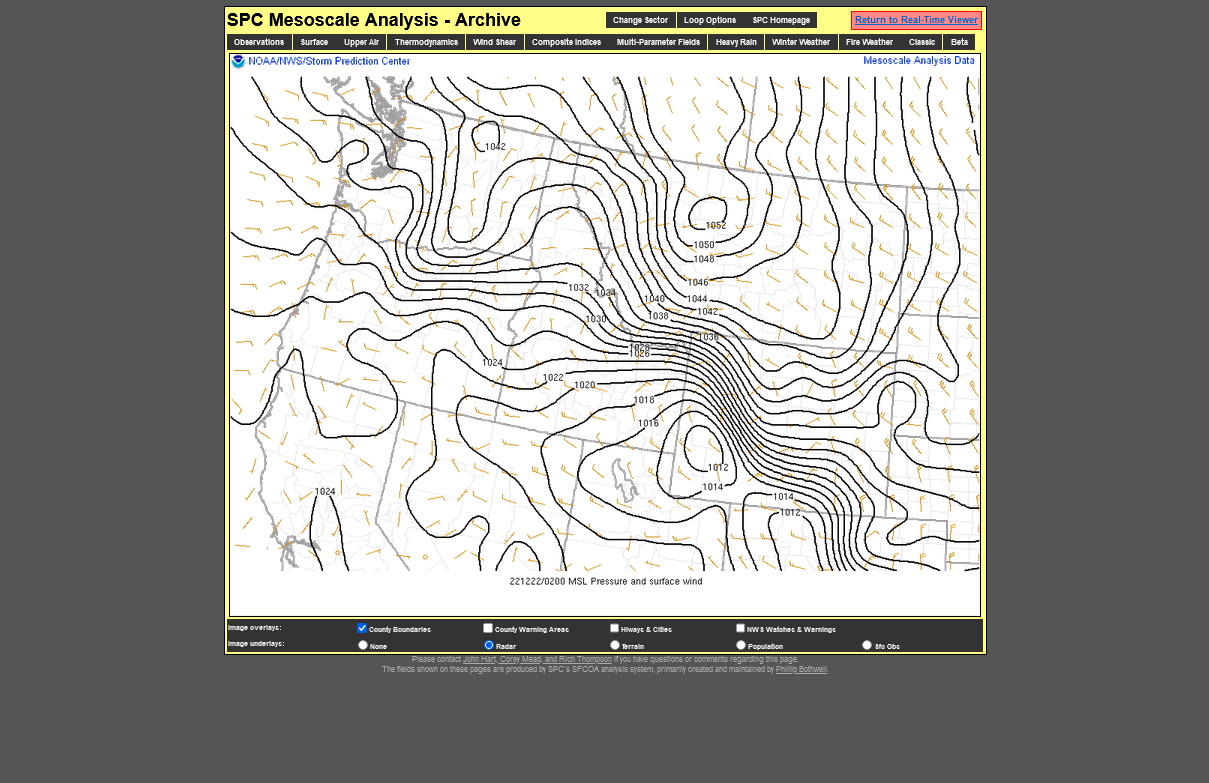
I went back to that SPC source to run a 12 frame loop of the pressure pattern for that morning out of interest.
You can do that going back several days with 24 hourly data images available for every day to put in your loop.
Except for 1 day. On 12-22-22 between 3z and 18z there's no data^&**()). This is the only time of interest for that location! Check it out by going to the link below and loop options, then see the dates/times.
https://www.spc.noaa.gov/exper/mesoanalysis/new/archiveviewer.php?sector=11&parm=pmsl&underlay=1#
We're in Detroit this week for our annual post Christmas visit, which didn't get that much snow. However the lake effect snows from the brutally cold Siberian air tracking over the unfrozen Great Lakes caused enormous snow totals.
The snowstorm is over. Here’s a look at the snowfall totals as measured to the best of weather spotters’ abilities.
For about half of Michigan, the storm truly was a blizzard. The other half of Michigan had a tolerable snow with nasty 50 mph gusts, blowing snow and cold wind chills.
Here is the total snowfall map for three days worth of snow, ending December 25, 2022.

Same lake effect farther east, just a bit later:
++++++++++++++++++++++++++
For sure an extremely impressive snowstorm but once again, they continue to exaggerate the historical significance of every extreme weather event, like this past Summer, when the new terminology for extreme rain events, including one that was a 1 in 25 year event(Dallas) was "1 in 1,000 year flooding events".
So now they carry it into the cold season.
Reality check:
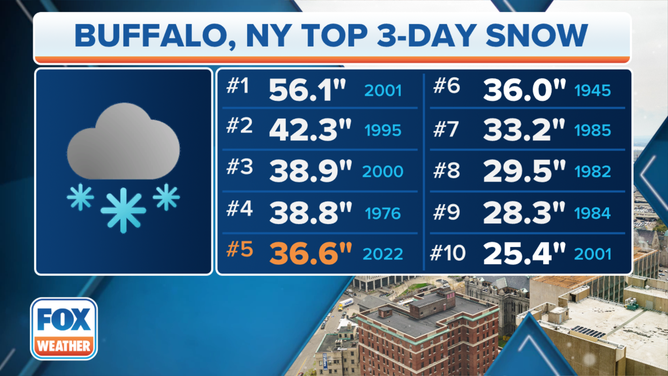
Buffalo's heaviest three-day snowstorm on record dumped a whopping 56.1 inches of snow in 2001.
While that all-time record remains safe, the 36.6 inches of snow that piled up during this event ranks as Buffalo's fifth-highest three-day snowfall on record.
THESE ARE THE SNOWIEST DAYS IN U.S. HISTORY
Everything caused by the climate crisis
https://www.marketforum.com/forum/topic/91691/
4th time this Summer for a 1 in 1,000 year rain event
Started by metmike - Aug. 22, 2022, 7:17 p.m.
https://www.marketforum.com/forum/topic/88256/
According to the media today:
https://matzav.com/wild-1-in-1000-year-flood-sweeps-through-dallas-area/
“The severity of the storm qualifies it as a “1-in-1,000-year flood,” according to The Washington Post, adding that over the last week, three 1-in-1,000 year rain events have hit the U.S., in St. Louis, eastern Kentucky and southeastern Illinois.”
They meant the last month.
ABC Nightly News this evening carried the caption " a one-in-a-thousand-year flood" during the entire time of this top story coverage a short while ago.
metmike: They made that up.
https://pbs.twimg.com/media/FayGosRWAAE5fw6?format=jpg&name=large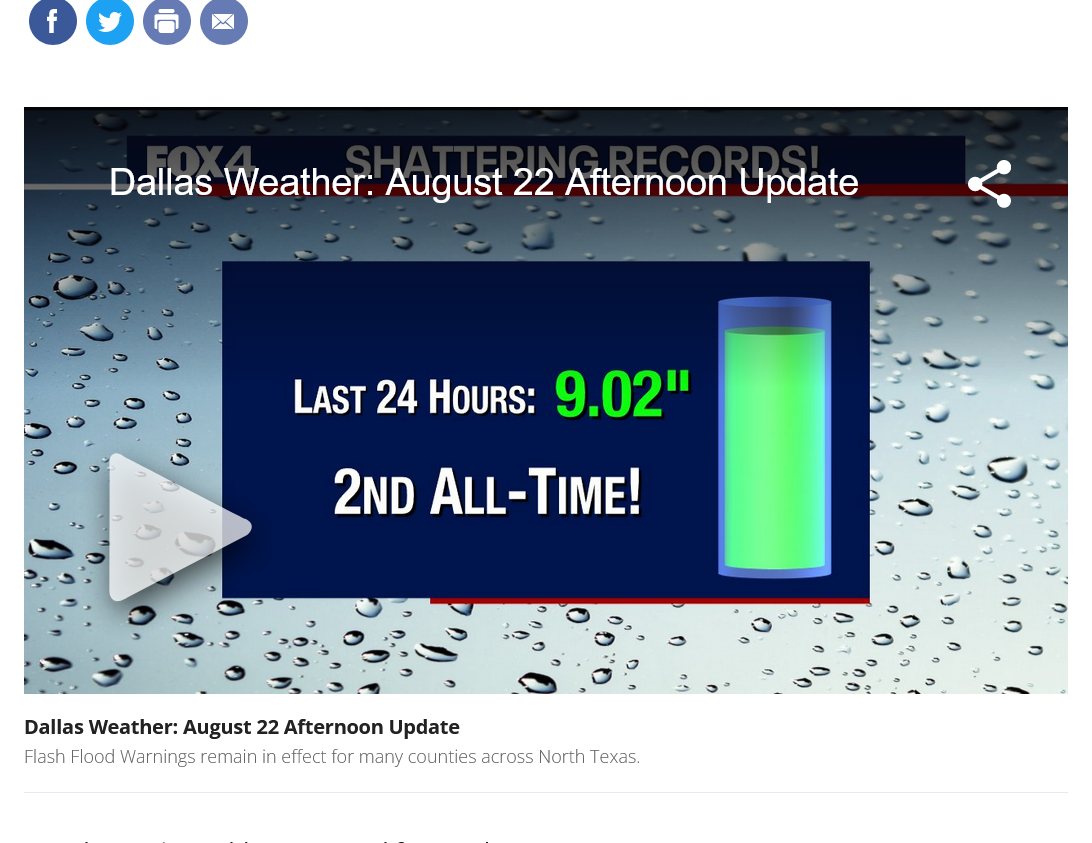
We're supposed to believe that the extreme rain events from 2022 and 2018 were from climate change but similar events in 1932 and 1922 were from natural variability of the weather.
++++++++++++++++++++++++++++++++++++++==
Latest 1 in 1,000 year rain event(not)
Started by metmike - Sept. 30, 2022, 2:03 a.m.
https://www.marketforum.com/forum/topic/89333/
++++++++++++++++++++++++++++++++=
The atmosphere at +1 Deg. can hold +7% more moisture, so there has been a slight increase in flooding, especially at higher latitudes but we should continue to understand the scientific principle behind these extreme WEATHER events.
We should keep in mind, the goldenrule of climate extremes:
https://www.marketforum.com/forum/topic/88256/
From brilliant/honest meteorologist and professor Cliff Mass: (https://environment.uw.edu/faculty/clifford-mass/)
https://cliffmass.blogspot.com/2016/03/the-golden-rule-of-climate-extremes.html
The GoldenRule
Considering the substantial confusion in the media about this critical issue, let me provide the GOLDENRULE OF CLIMATE EXTREMES. Here it is:
The more extreme a climate or weather record is, the greater the contribution of natural variability.
Or to put it a different way, the larger or more unusual an extreme, the higher proportion of the extreme is due to natural variability.
++++++++++++++++++++
https://www.usatoday.com/story/weather/2015/05/20/cold-weather-deaths/27657269/
Here's an extremely laughable version of them launching last year's 2021 snow/ice event in TX into the worst snowstorm in recorded history for the planet. Even worst than snowstorms with 10 times more snow and snow drifts of 40 feet.
https://science.howstuffworks.com/nature/climate-weather/storms/10-biggest-snowstorms.htm
Contents
The Great Texas Snowstorm was not even in the top 100, no less the biggest snowstorm of all time. The biggest part of the disaster was related to the failure to Winterize their energy delivery system and over reliance on diffuse, intermittent fake green renewables, especially wind (a grid scale battery system that can store the energy efficiently has not even been invented yet) .
Manufacturing a fake intensity level like this to blame the failure on instead of the real reason for damage control is sad.
Everything caused by the climate crisis
