Weather page here: https://www.marketforum.com/forum/topic/83844/
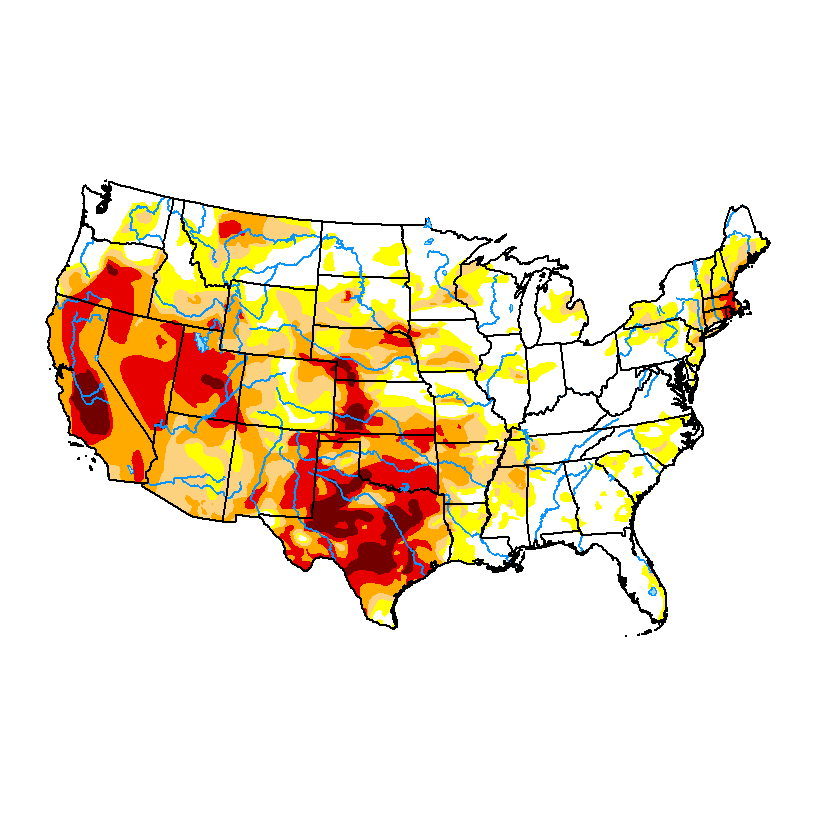
The severe drought has continued to get worse in the midsection of the country:
Soilmoisture anomaly:
These maps sometimes take a day to catch up to incorporate the latest data(the bottom map is only updated once a week).
https://www.cpc.ncep.noaa.gov/products/Soilmst_Monitoring/US/Soilmst/Soilmst.shtml#
![]()


++++++++++++++++++++++++++++
https://mrcc.purdue.edu/cliwatch/watch.htm#curMonths

October 11, 2022 Below
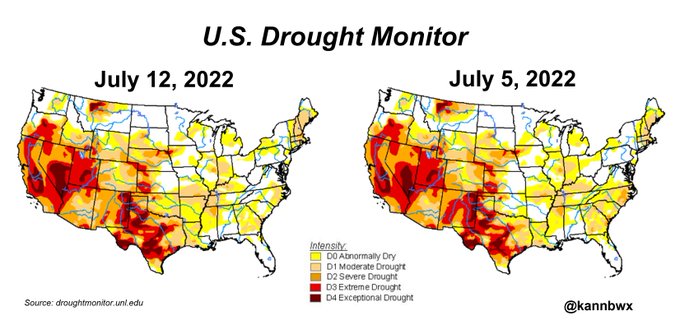
Drought worsening!!
https://droughtmonitor.unl.edu/Maps/CompareTwoWeeks.aspx

AUGUST 16, 2022 BELOW
Drought is worse in the WCB compared to 3 weeks earlier
July 26, 2022-update
U.S. Drought Monitor
https://droughtmonitor.unl.edu/Maps/CompareTwoWeeks.aspx

Drought monitor previous years:
The drought was not caused by climate change/global warming…..just the opposite.
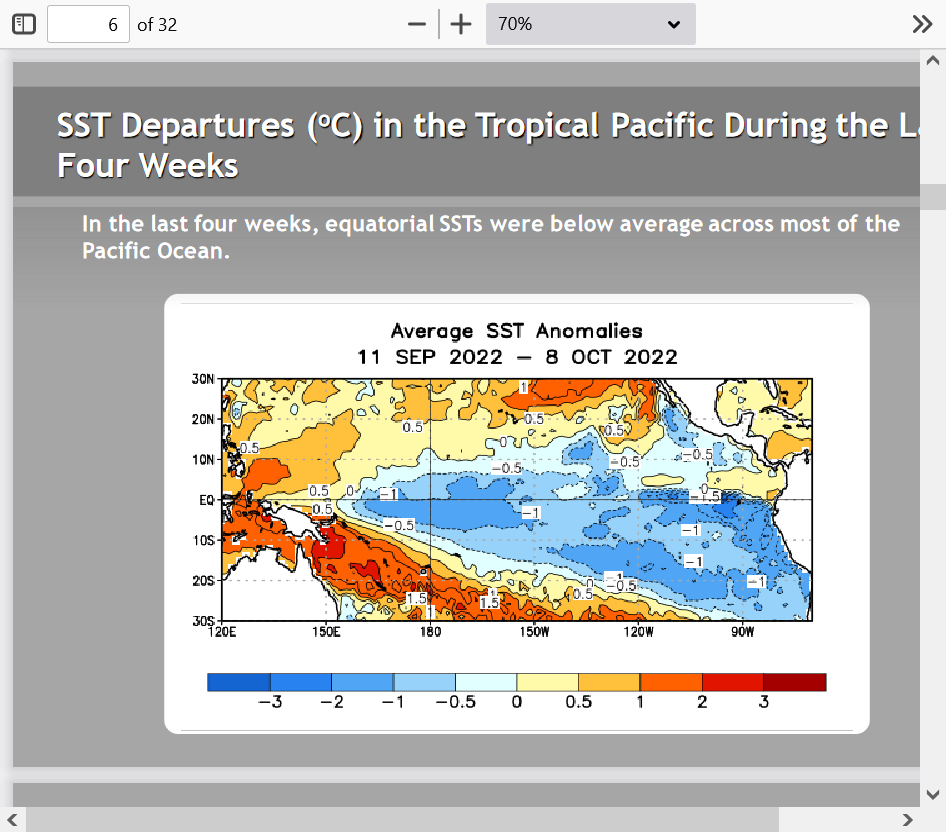
its the result of the current, extremely long lived La Niña which is cold water anomalies in the tropical pacific. The opposite of a global warming pattern.
this is part of why global warming has paused the past 6 years
the best opportunity to end the drought will come from the slight, mostly beneficial warming resuming(with an El Nino, ideally) which caused the previous 3 decades of growing weather to be the best in the last 1,000 years.
add the beneficial CO2 during that time and growing conditions on the planet were the best since well before humans existed.
that’s why we’ve had massive global greening!
https://www.marketforum.com/forum/topic/69258/
La Nina conditions:
https://www.ospo.noaa.gov/Products/ocean/sst/anomaly/index.html

++++++++++++++++++++++++++++++++++++++
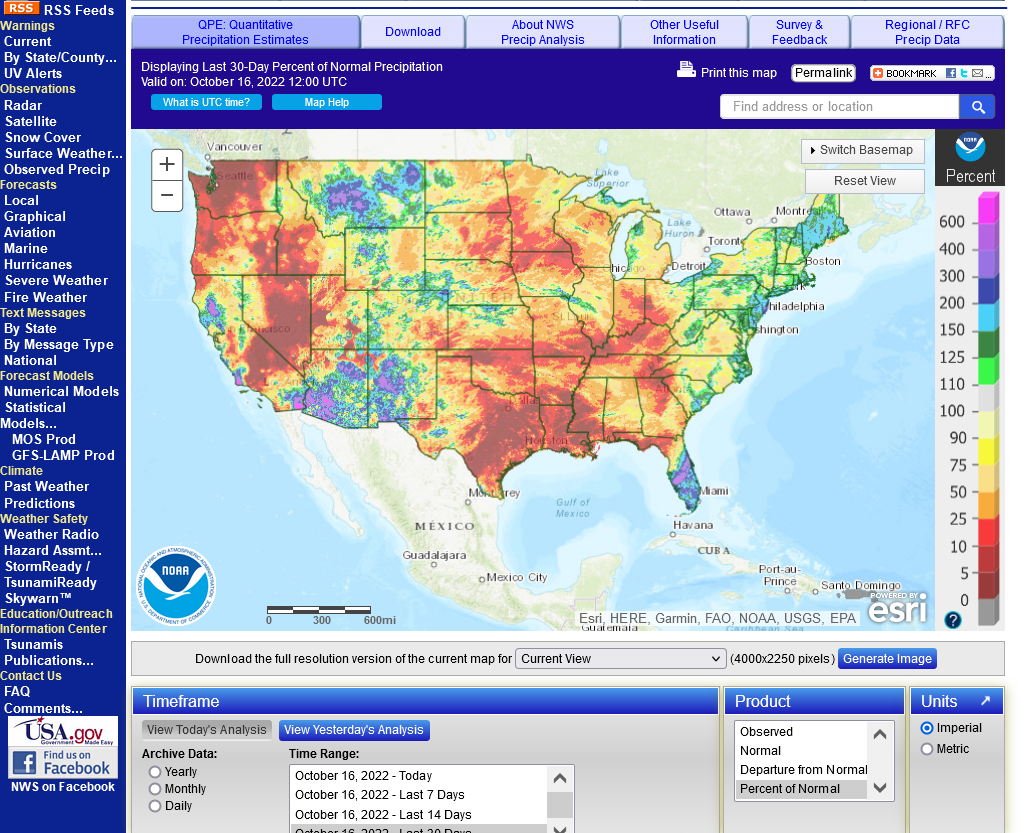
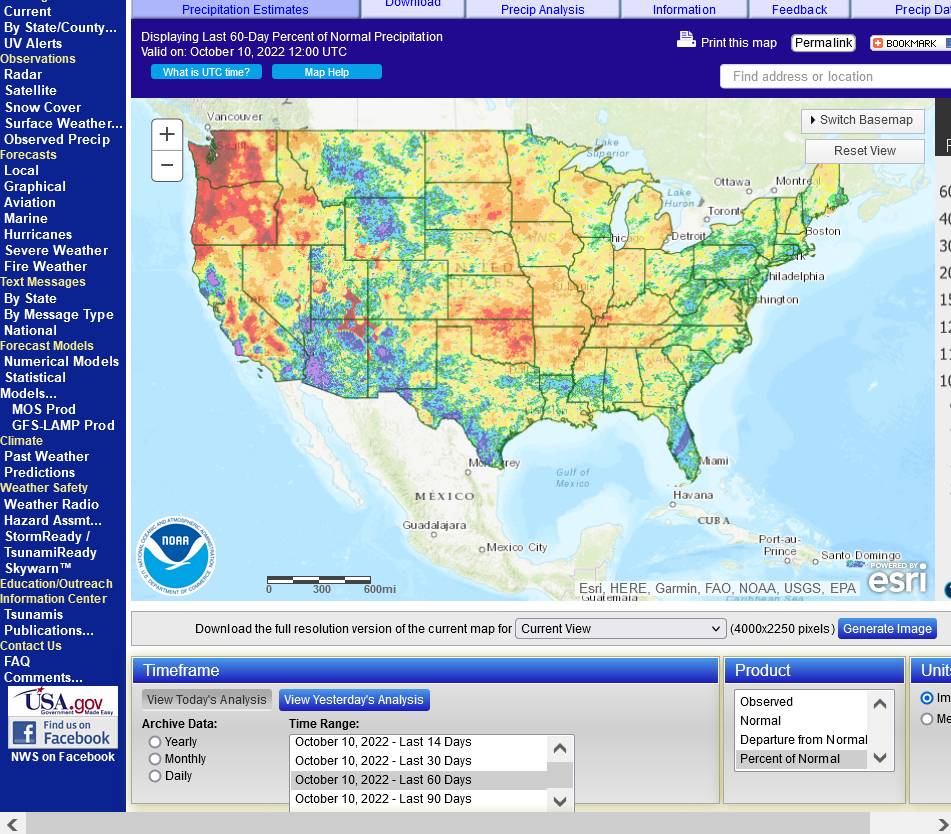
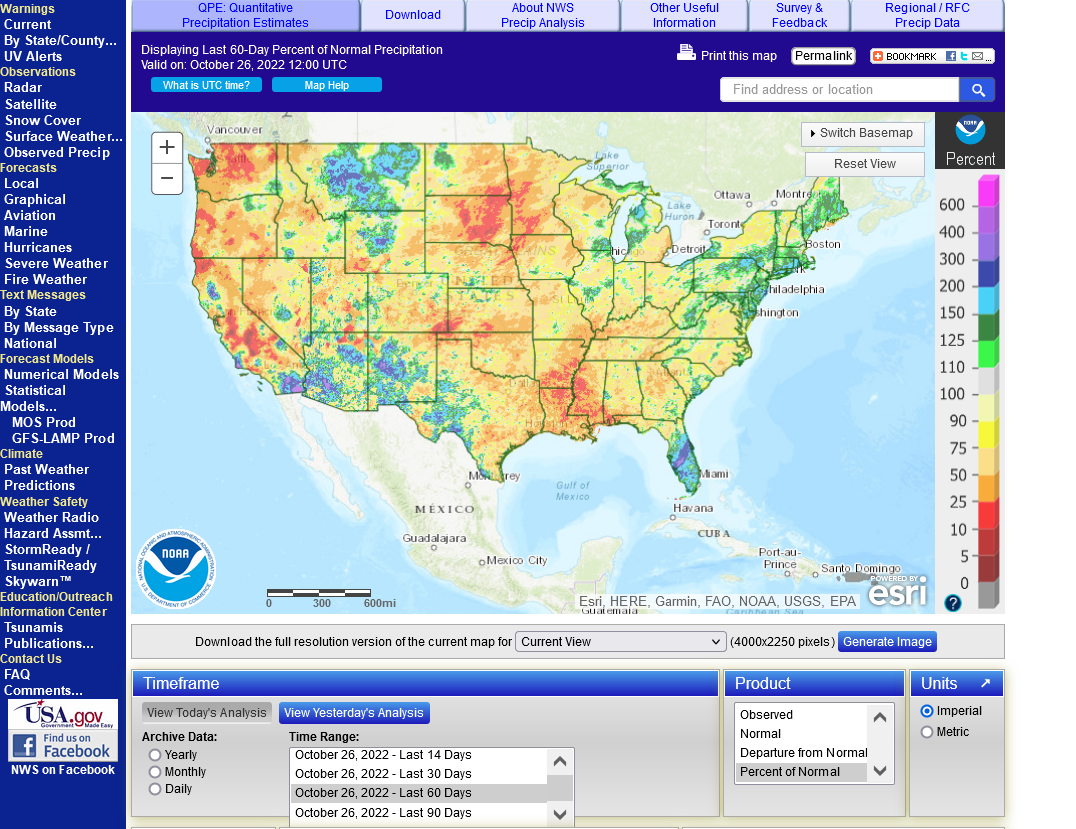
https://water.weather.gov/precip/
% Average of Rainfall the past 30 days
% Rain the past 60 days
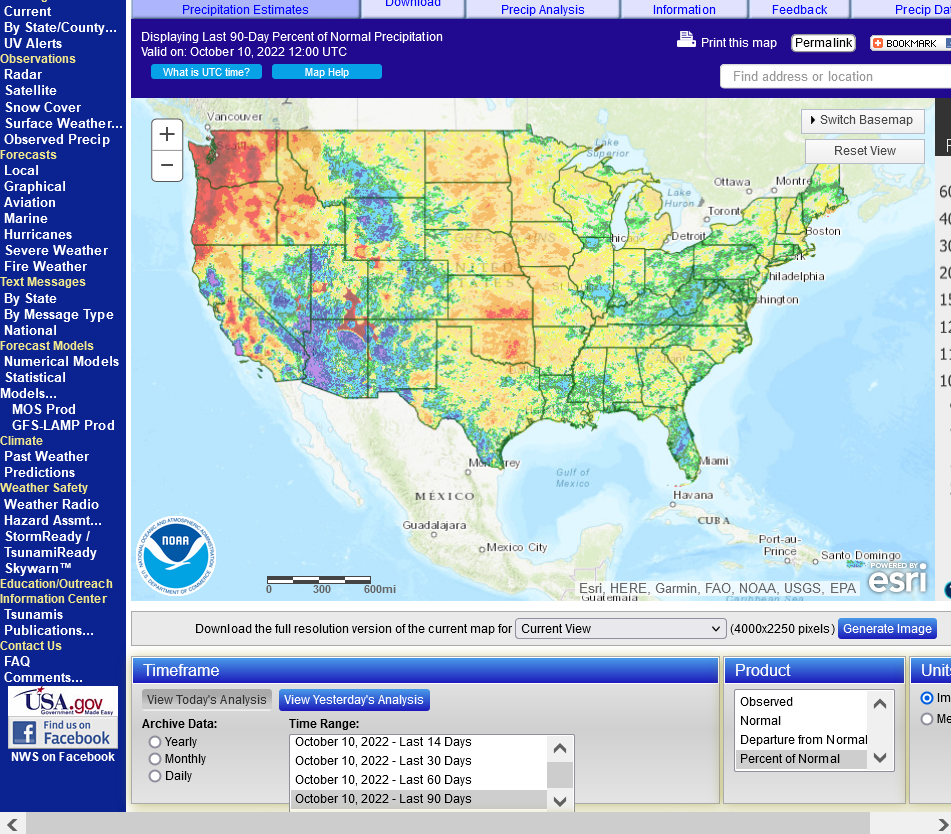
% Rain of Average the past 90 days
%Average of Rain the past 180 days
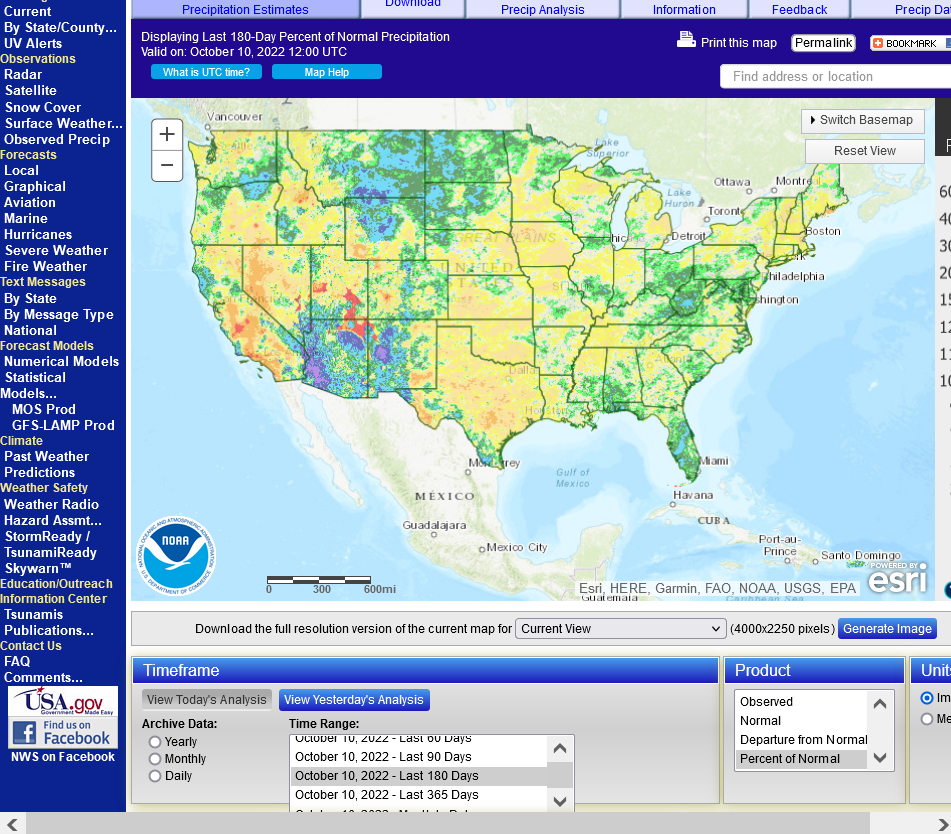
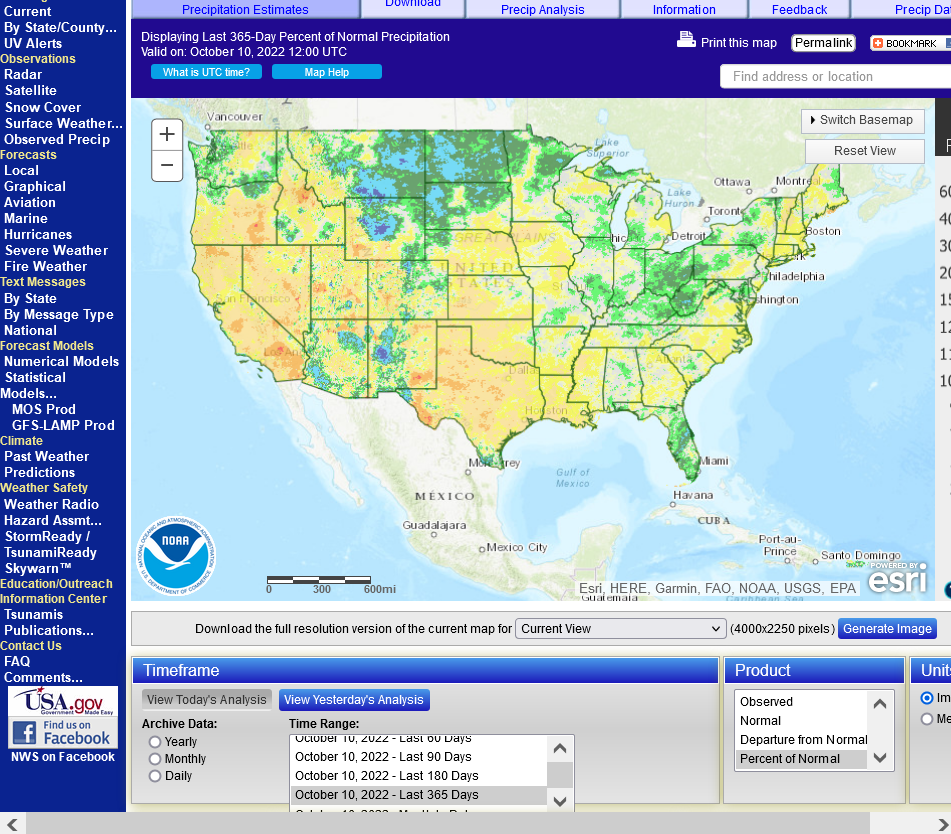
%Average Rain the past 365 days
Will there be some help on the way with the current week 2 uptick in precip???
Complete weather thread:
https://www.marketforum.com/forum/topic/83844/
Monday update: I'm also increasing the rains in my forecast accordingly and rains are happening late in week 1 now.
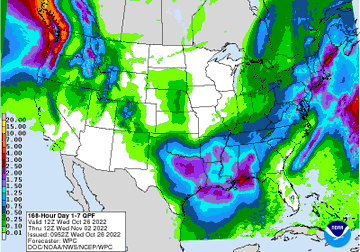
7 Day Total precipitation below:
http://www.wpc.ncep.noaa.govcdx /qpf/p168i.gif?1530796126

Extended weather.
https://www.cpc.ncep.noaa.gov/products/predictions/610day/ | |||||||||
| 6 to 10 day outlooks | |||||||||
| Click below for information about how to read 6-10 day outlook maps Temperature Precipitation | |||||||||
| Click below for archives of past outlooks (data & graphics), historical analogs to todays forecast, and other formats of the 6-10 day outlooks ArchivesAnalogsLines-Only FormatGIS Data | |||||||||
Temperature Probability | |||||||||
Precipitation Probability | |||||||||
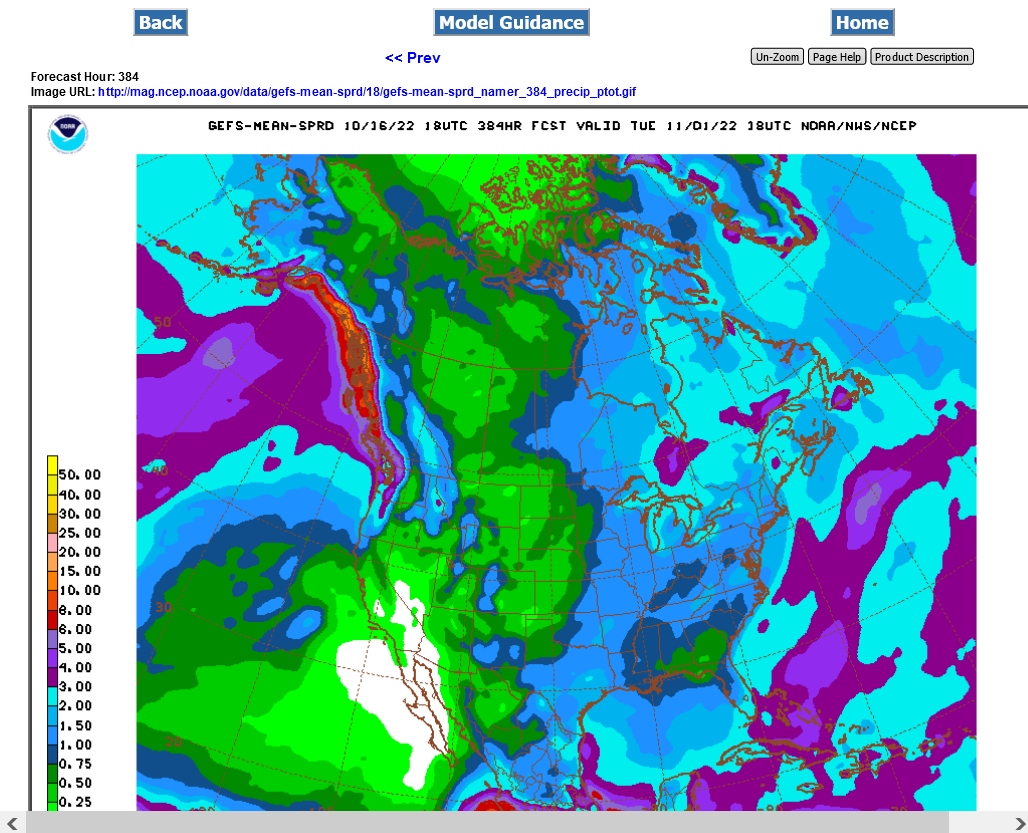
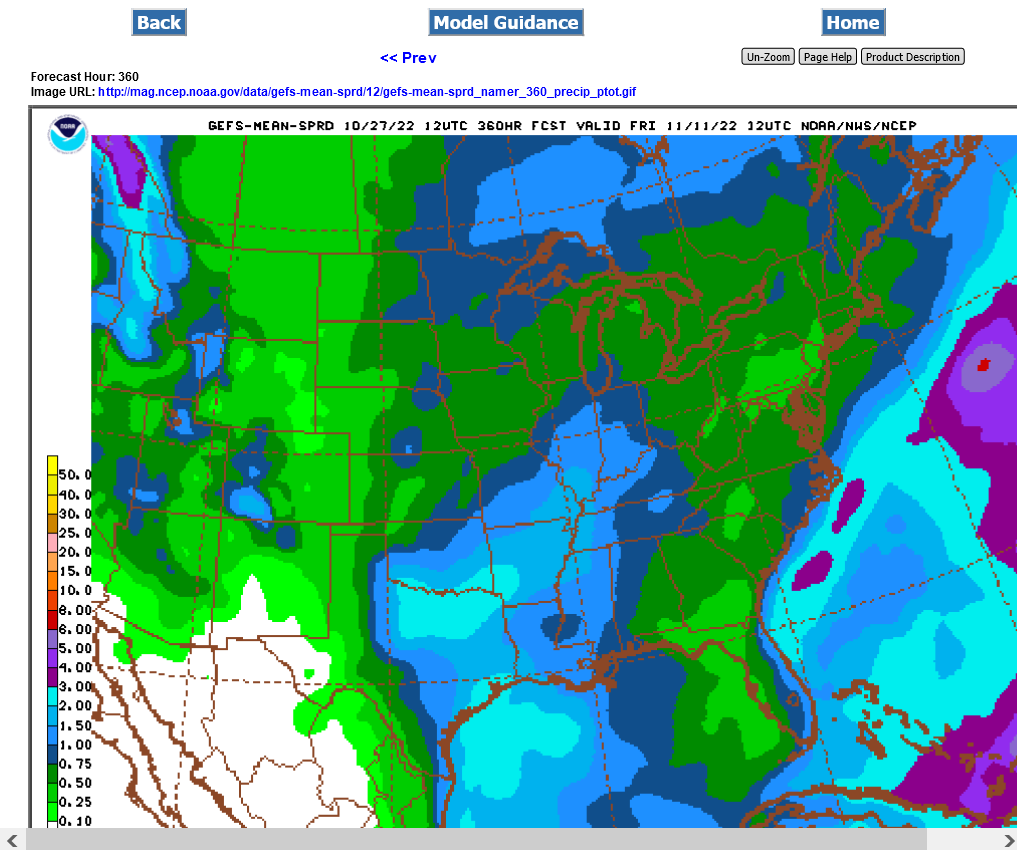
GFS ensemble precip for the next 15 days:
https://mag.ncep.noaa.gov/Image.php
https://finance.yahoo.com/news/america-going-shut-down-shut-204307435.html
Traffic jams and stuck barges are clogging up a critical artery of the U.S. economy, as a prolonged drought pushes the Mississippi River’s water levels to near-record lows.
Around 500 million tons of supplies are ferried along the Mississippi River every year with trade value worth $130 billion, according to the Port of New Orleans, mainly agricultural products, like corn and soybeans, along with fuel products. The Mississippi River Basin produces more than 90% of U.S. agricultural exports, according to the National Park Service, and nearly 80% of the world’s grain exports.
But all that is coming to a standstill amid historic drought conditions that are making the river untraversable for most shipping barges. River levels are now at their lowest level in a decade after historically low rainfall in recent months, becoming the latest supply-chain snag to hit the U.S.
“America is going to shut down if we shut down,” Mike Ellis, CEO of American Commercial Barge Line in Indiana, told the Wall Street Journal this week.
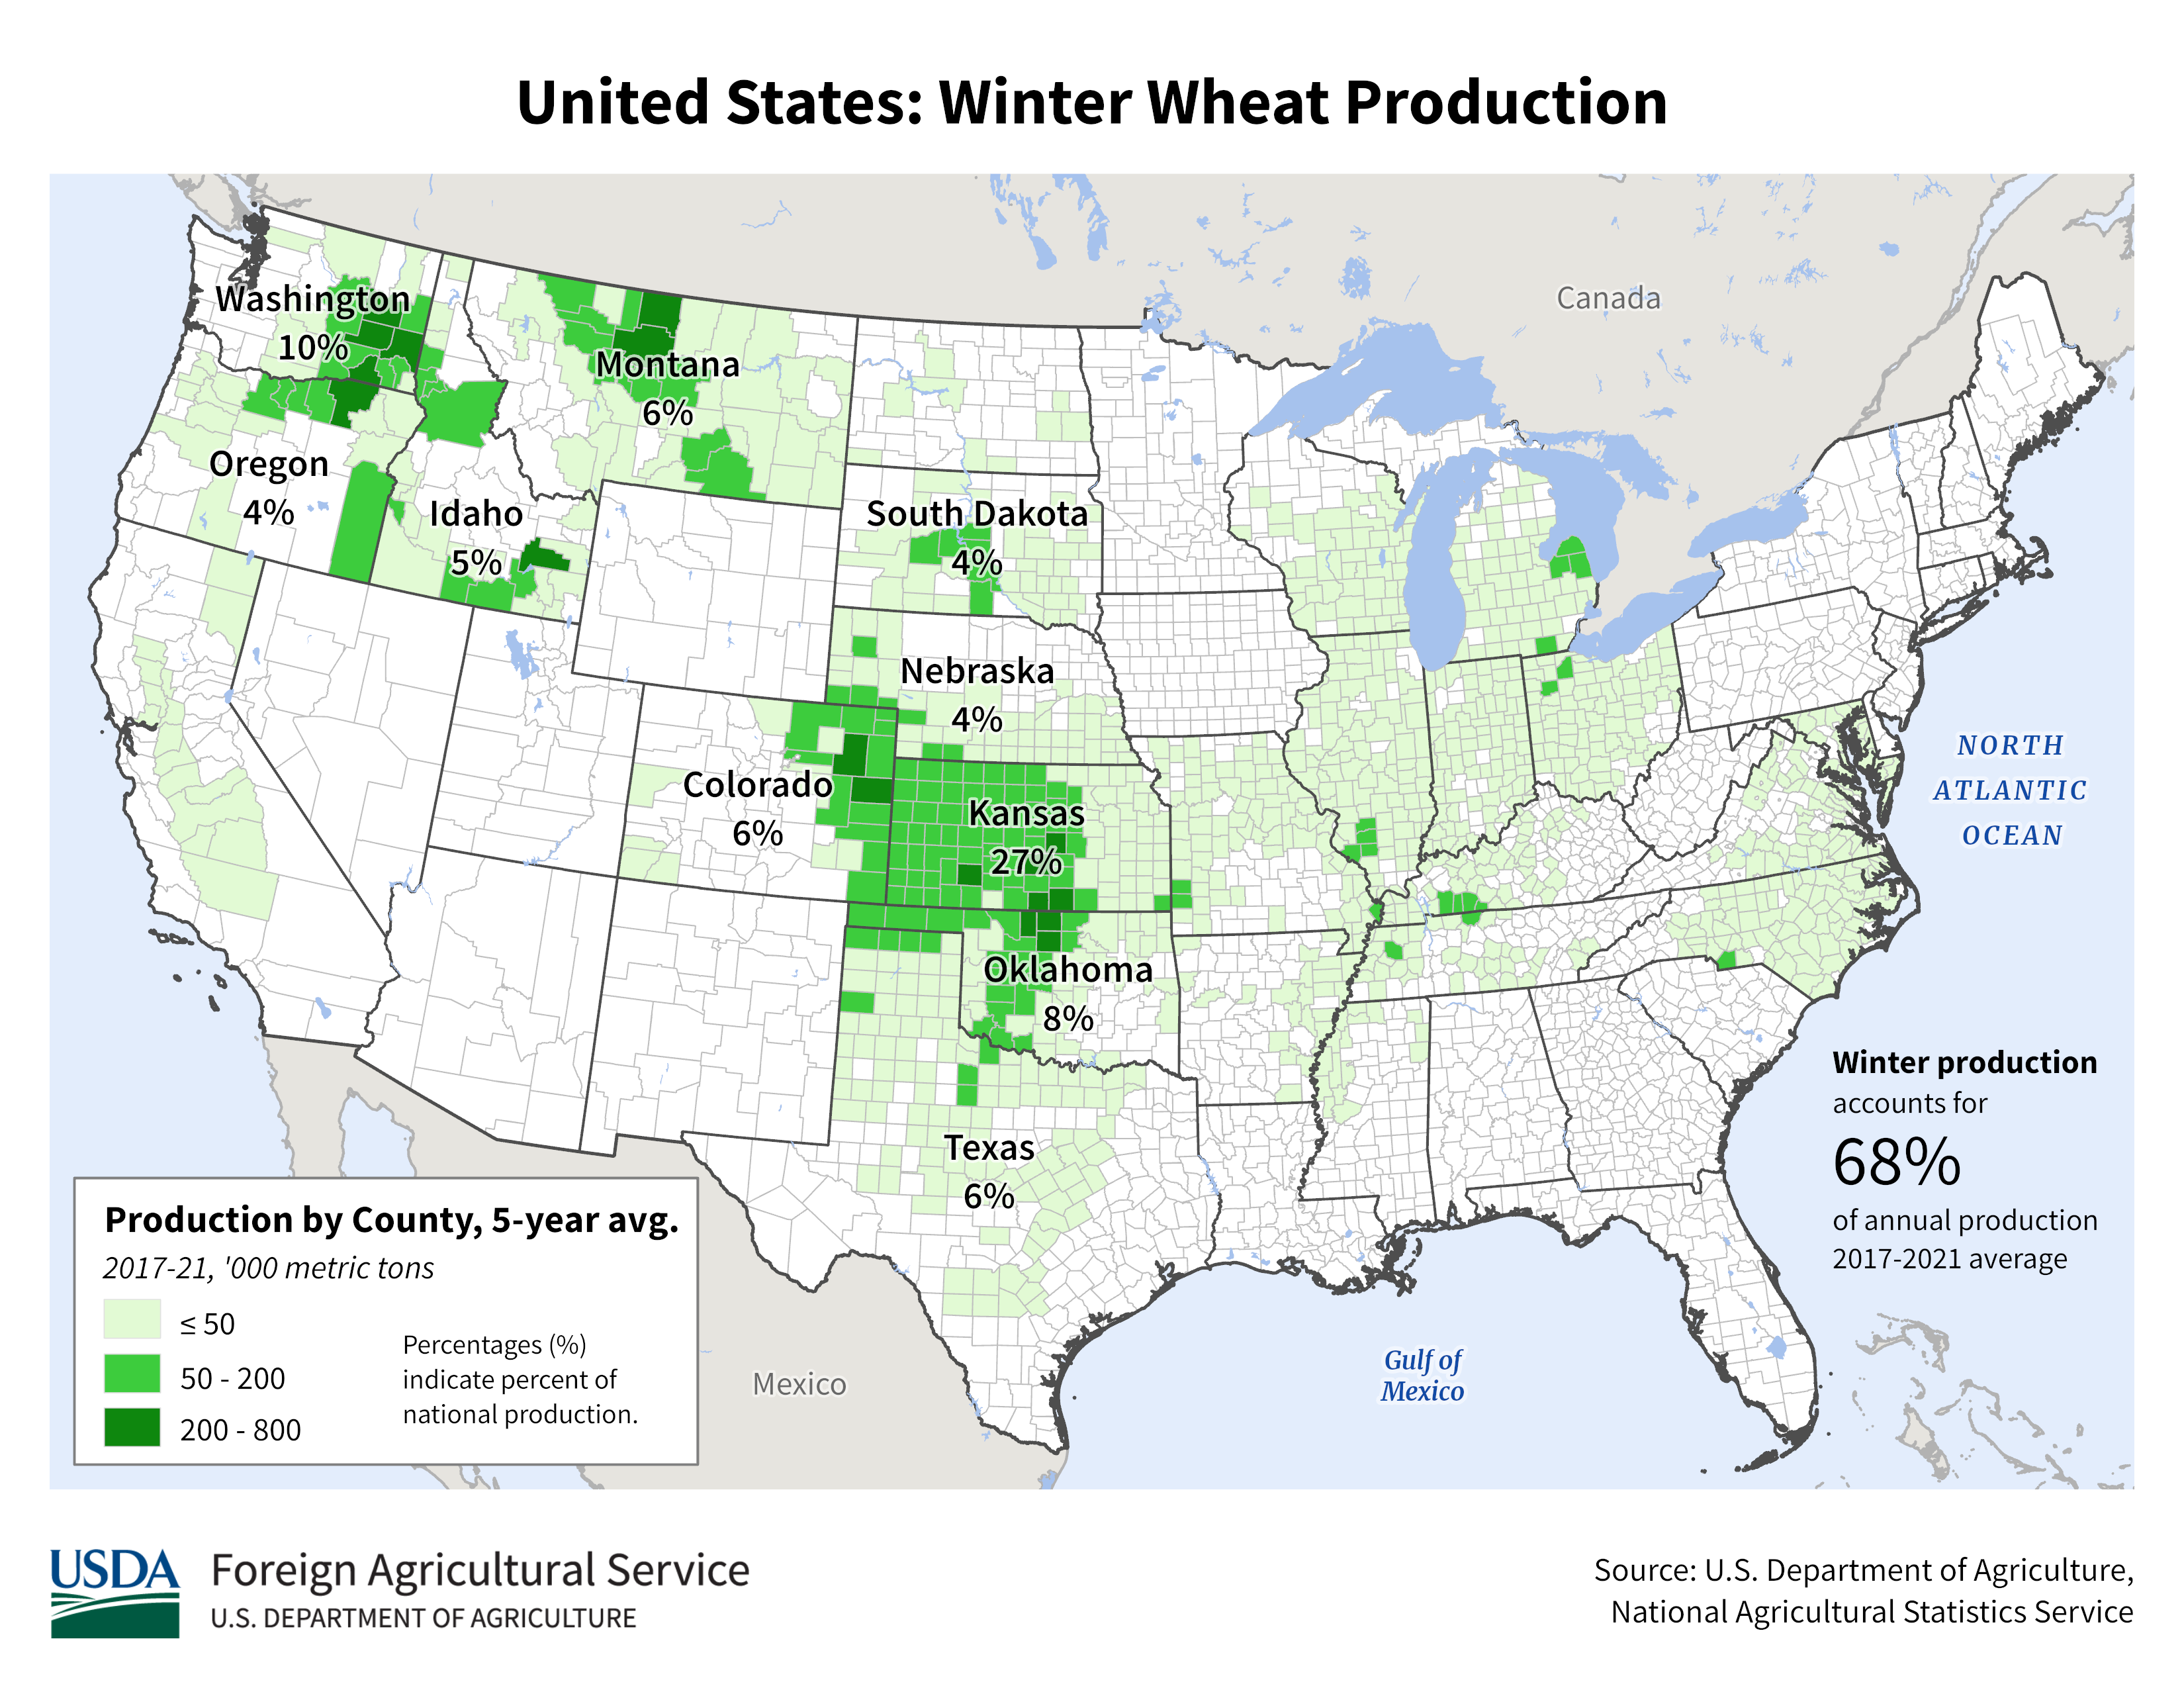
https://www.sunflower.k-state.edu/agronomy/wheat/winter_damage.html
Good top growth of wheat doesn't necessarily indicate good root development. Poor root development is a concern where conditions have been dry. Where wheat plants have a good crown root system and two or more tillers, they will tolerate the cold better. If plants are poorly developed going into winter, with very few secondary roots and no tillers, they will be more susceptible to winterkill or desiccation, especially when soils remain dry. Poor development of secondary roots may not be readily apparent unless the plants are pulled up and examined. If plants are poorly developed, it may be due to dry soils, poor seed-to-soil contact, very low pH, insect damage, or other causes.
+++++++++++++++++++++
https://ipad.fas.usda.gov/rssiws/al/us_cropprod.aspx
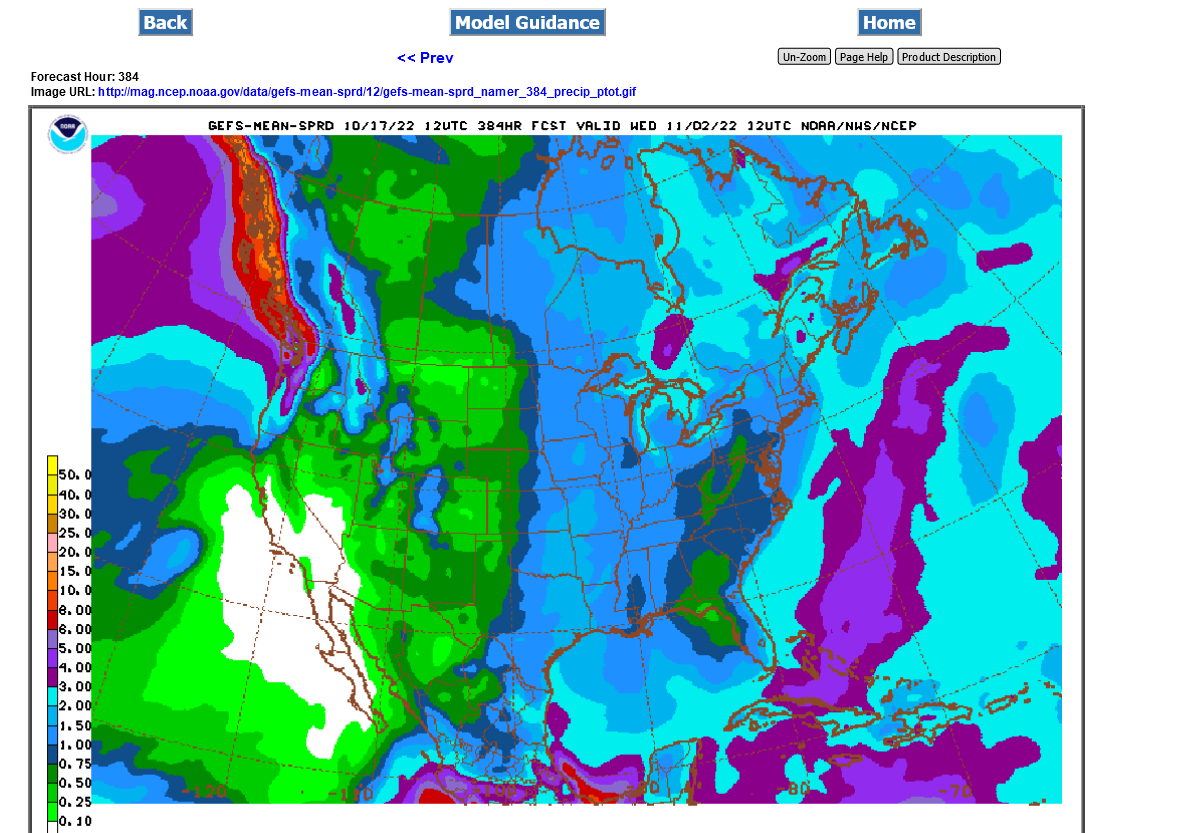
just out 0z GFS ensemble precip the next 15 days. Slight uptick in amounts everywhere vs previous guidance. Still not much in the W. Plains............yet.
USDA crop condition:
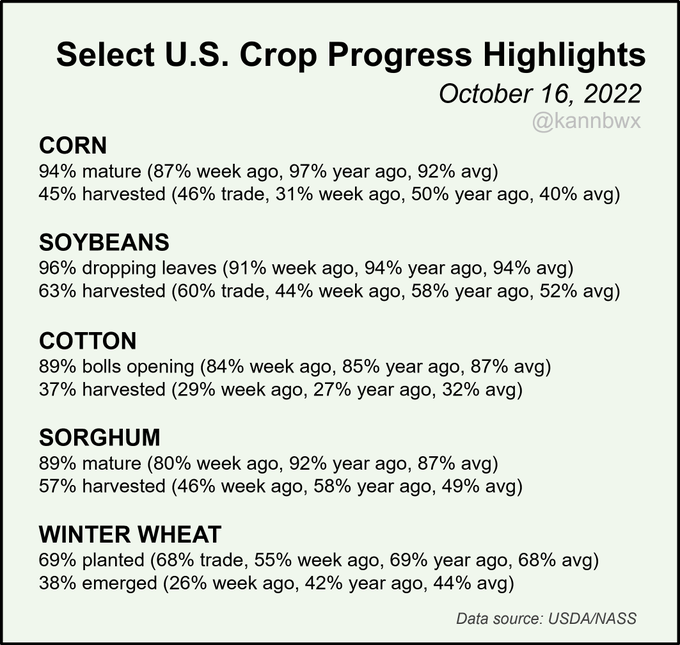
Wheat is +1% compared to the 5 year average but emergence is -6% compared to average.
Producers remember the saying "Plant in the dust and the bins will bust"?
Well, that only applies to crops planted early in the Spring that get timely rains to germinate in order to maximize capturing the stronger, early season sunshine that increases photosynthesis, amongst other things.
When rains don't materialize, instead of the bins busting "the crop is a bust"
That being said, the increasing chances of rain in week 2 mentioned yesterday have worked into late week 1 now.
The maps here are constantly updated:
https://www.marketforum.com/forum/topic/89733/#89734
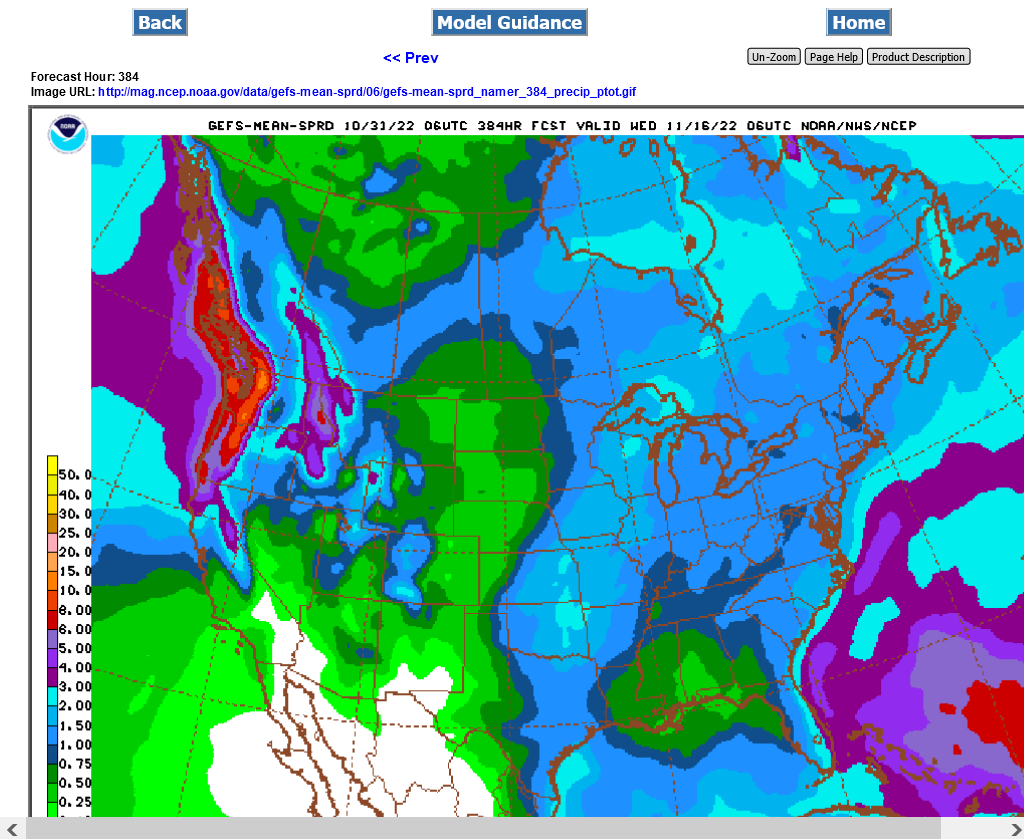
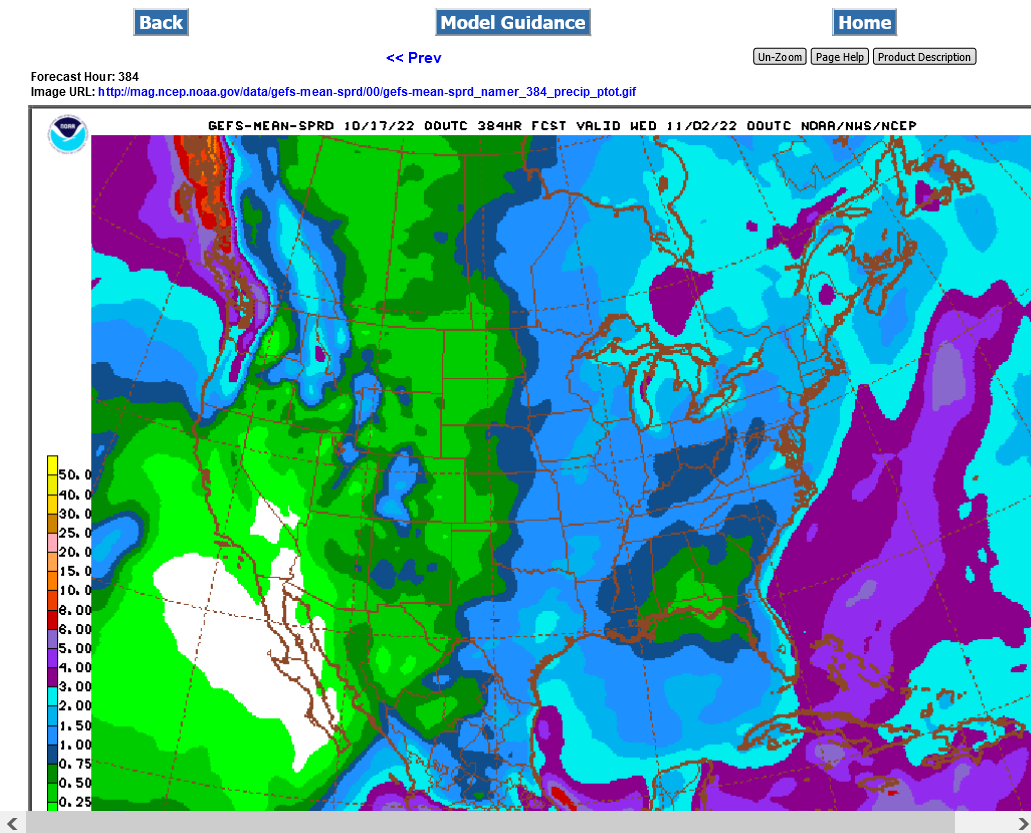
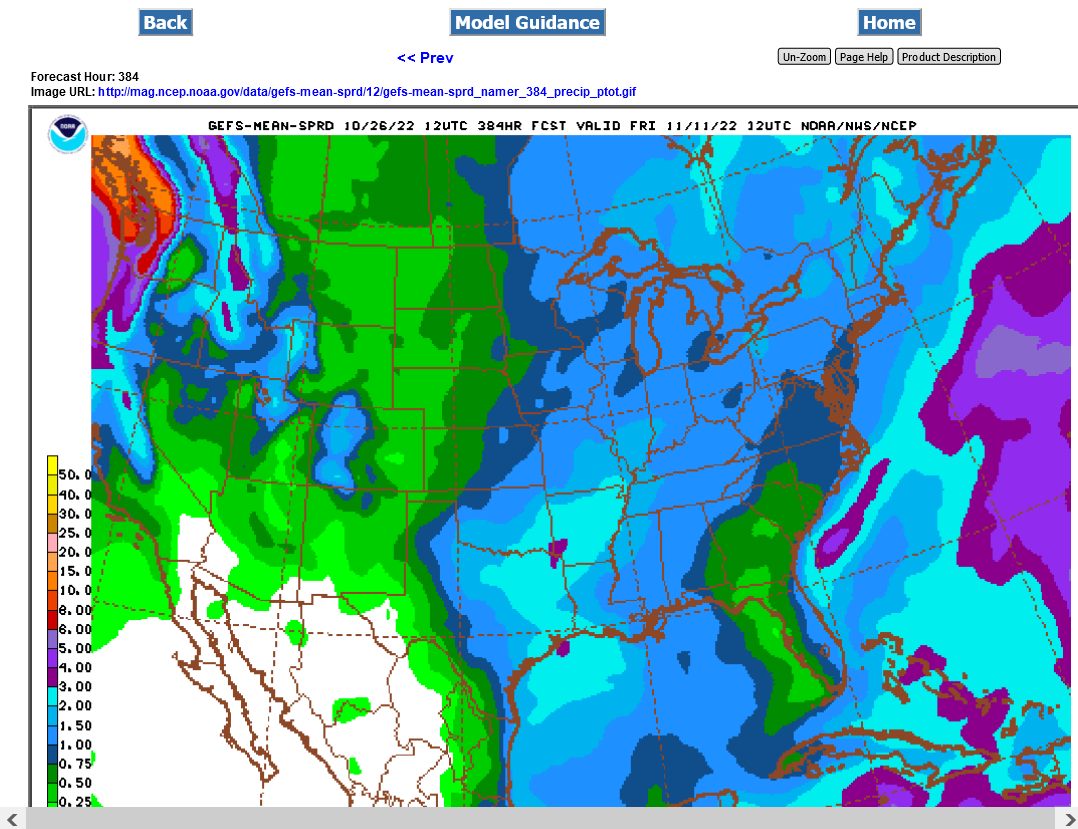
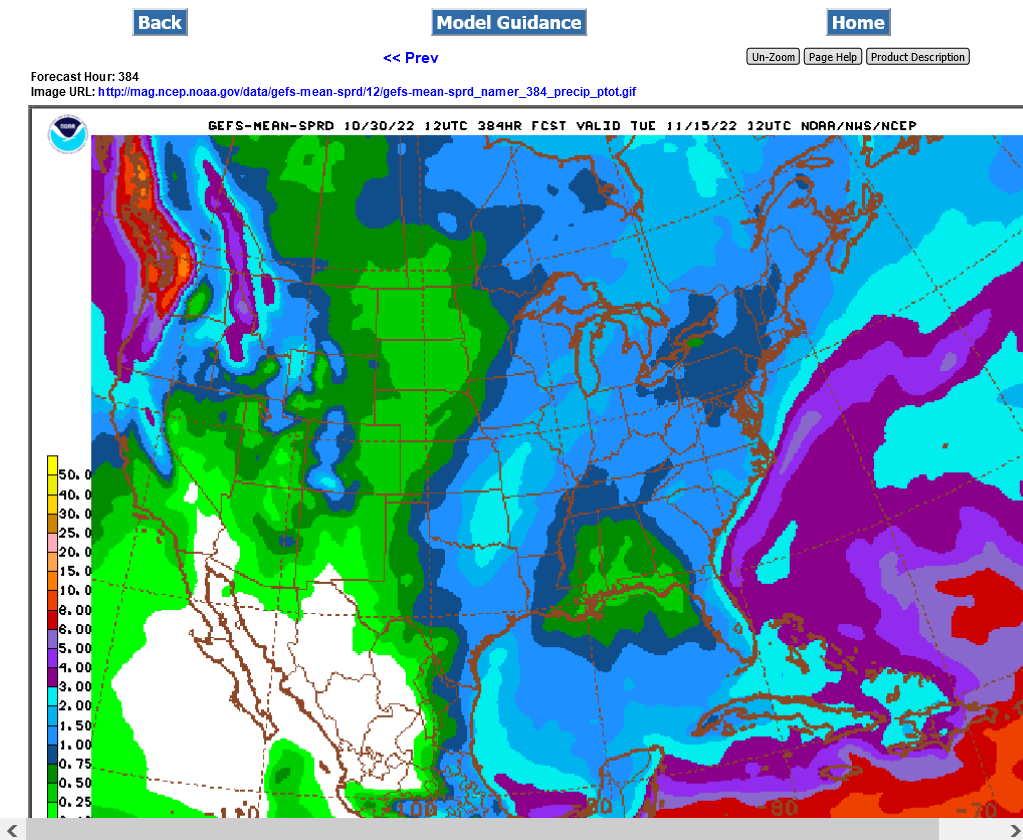
Below is the last 12z GFS ensemble mean out to 384 hours.
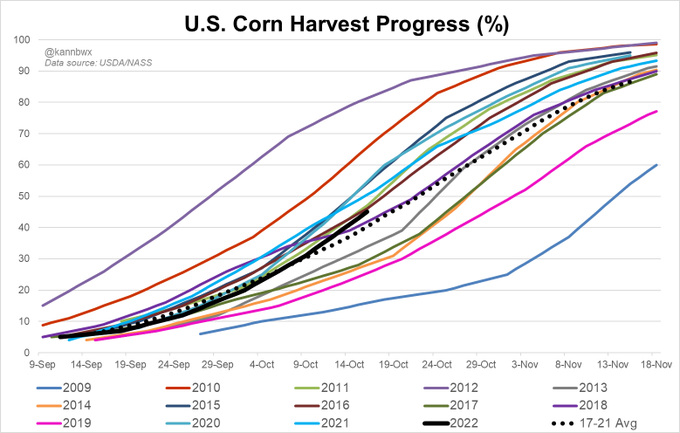
Harvest of U.S. #corn, #soybeans, #cotton & #sorghum are all ahead of average pace. Soy harvest was busier last week than analysts expected, corn slightly slower. Winter #wheat planting is one point ahead of average, but emergence is six points behind.
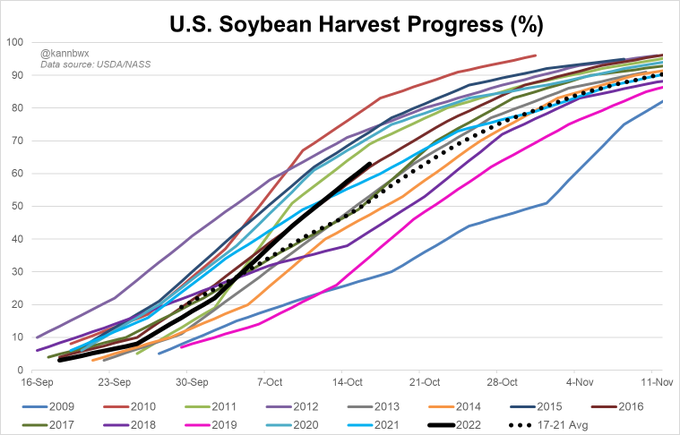
Harvest pace of U.S. #soybeans in October has been strong - 63% was complete as of Sunday, 3rd fastest for the date in the latest 10 years. Average is 52%. Western states (ND, SD, MN, NE, IA) are significantly ahead of normal as a dry fall has made for speedy progress.
++++++++++++
45% of U.S. #corn is harvested, up from 31% a week ago and ahead of the 40% average. Harvest is ahead of average pace in western states like Nebraska, Kansas, South Dakota, Iowa & Minnesota, though it is behind in both Illinois & Indiana.
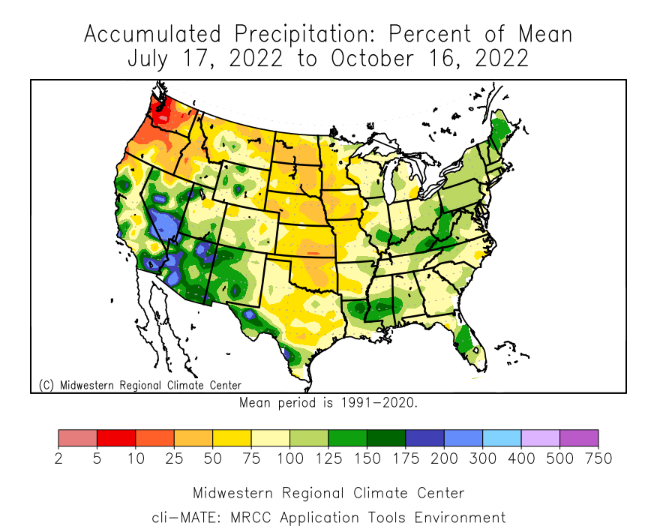
These U.S. states have endured very dry weather so far in 2022 (listed with states' Jan-Sep dryness rank of 128 yrs & pct of normal precipitation Jan-Sep):
California #1 37%
Nebraska #6 65%
Texas #8 68%
Nevada #10 67%
Utah #16 73%
Iowa #18 76%
Kansas #20 75%
Oklahoma #21 77%
+++++++++++++++++++++
This means 2022 is so far California's driest Jan-Sep period since at least 1895, it is Nebraska's 6th driest Jan-Sep, and so on. The western states have been a bit luckier with the precipitation in recent months, but that is not the case for the central/Plains states.
PERSONALLY, I HAVE NEVER SEEN THIS, UNTIL LAST WEEK. IT'S BEEN POSTED DAILY
ISSUED: 4:12 PM OCT. 17, 2022 – NATIONAL WEATHER SERVICE
...SMALL CRAFT ADVISORY REMAINS IN EFFECT UNTIL 8 AM EDT WEDNESDAY... ...LOW WATER ADVISORY REMAINS IN EFFECT UNTIL 10 PM EDT THIS EVENING...
* WHAT...For the Small Craft Advisory, west winds 20 to 30 knots with gusts up to 40 knots and waves 2 to 5 feet. For the Low Water Advisory, abnormally low water levels expected.
* WHERE...The nearshore waters of Lake Erie from Maumee Bay to The Islands OH.
* WHEN...For the Small Craft Advisory, until 8 AM EDT Wednesday. For the Low Water Advisory, until 10 PM EDT this evening.
* IMPACTS...Conditions will be hazardous to small craft. Below normal water levels will result in hazardous navigating conditions.
* ADDITIONAL DETAILS...As of 400 PM, the water level at Toledo was about 10 inches above low water datum. Water levels will continue to drop and bottom out at 3 to 6 inches above low water datum. This is 1 to 4 inches below the level for safe navigation. The critical mark for safe navigation is 7 inches above low water datum.
PRECAUTIONARY/PREPAREDNESS ACTIONS...
Inexperienced mariners, especially those operating smaller vessels, should avoid navigating in hazardous conditions.
Mariners should navigate shallow waters with extreme caution due to below normal water levels.
&&
LOW WATER ADVISORY IN EFFECT UNTIL 4 AM EDT TUESDAY... ...SMALL CRAFT ADVISORY REMAINS IN EFFECT UNTIL 8 AM EDT WEDNESDAY...
https://forecast.weather.gov/wwamap/wwatxtget.php?cwa=usa&wwa=Low%20Water%20Advisory
Great Lakes Basin Hydrology
September 2022
Preliminary estimates show below average precipitation for Great Lakes basin at 75% of average in September. All
Great Lakes received below average precipitation with Lakes Michigan-Huron and Erie receiving 71% and 68% of
average, respectively. Over the last 12 months, precipitation estimates are near to below average for all lake basins.
Provisional estimates show September water supplies were above average in Lake Superior basin and below
average in remaining Great Lakes basins. Outflows from all Great Lakes were above average in September.
From August to September, water levels declined on Lakes Michigan-Huron, St. Clair, Erie, and Ontario by 3, 4, 4,
and 7 inches, respectively. Lake Superior water levels remained steady from August to September. Great Lakes
water levels 6-month forecast projects Lake Superior to begin its seasonal decline while Lakes Michigan-Huron, St.
Clair, Erie, and Ontario will continue to decline.
PRECIPITATIO
Jean,
Since water levels on Lake Erie are not abnormally low, I believe this is entirely the result of the very strong west to east winds that are blowing the water away from the shore and dropping the level of the water close to the shoreline, where the water is already naturally shallow.
It's the opposite effect that winds have in a hurricane to create the storm surge(rising water).
THANKS, MIKE.
I FINALLY CAME TO THAT CONCLUSION, 'LONG ABOUT DAY 3 OF THAT ALERT. I WAS EVEN LOOKING FOR MOON PHASES, ETC. LOL
MAYBE, IT'S A NEW ALERT THE WEATHER SERVICE PUT INTO THE SYSTEM, THIS YEAR? :-/
YW, Jean!
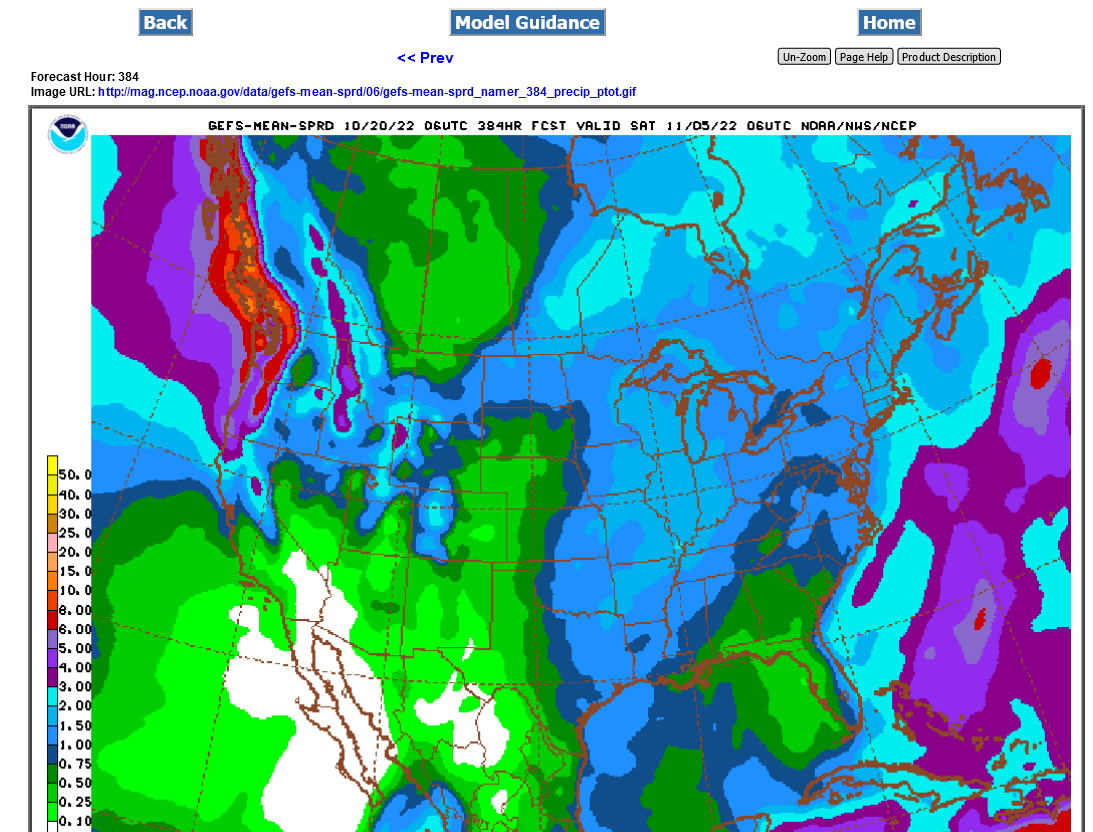
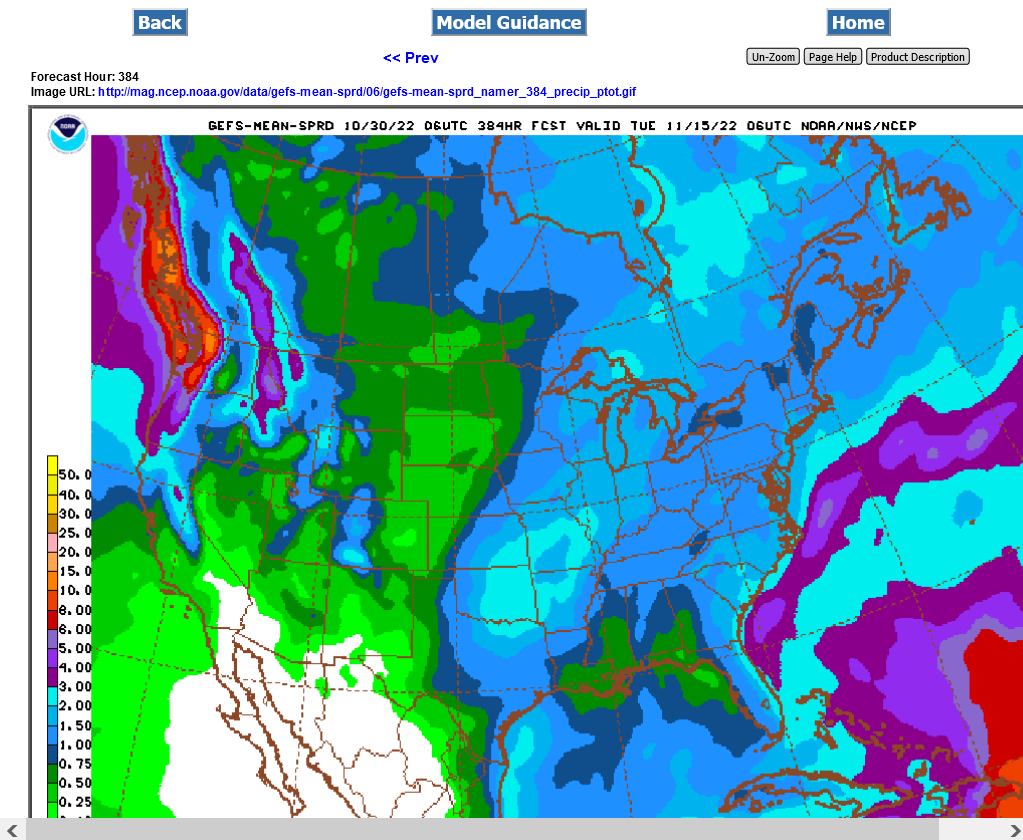
Latest precip from the 6z GFS ensemble mean. Total for 384 hours, most in week 2.
Far western Plains would like to see more blue here but the farther east on the map we go, the more precip in the Midwest.
If grans can’t be shipped, is that bearish? I would think that would affect our ES if we can’t get grains offshore.
I'm not sure how to read that one Jim. Seems like a case can be made for either way bullish or bearish.
With regards to my previous post, I take back that the precip is mostly week 2. I mis-stated that. How much will this help? It doesn't look wet enough in the right places but the pattern could amplify and become wetter and the European model turns much wetter late in week 2 vs the GFS.
7 Day Total precipitation below:
http://www.wpc.ncep.noaa.govcdx /qpf/p168i.gif?1530796126
Precip amounts are higher early this morning:
Here's the last 6z GFS ensemble precip for 2+ weeks.
The growing season is over for C and S but not HRW(this will help the S.Plains) and the Miss River needs this rain to elevate record low river levels. This is an increase over last week as you can see by comparing to the map on the previous page above. 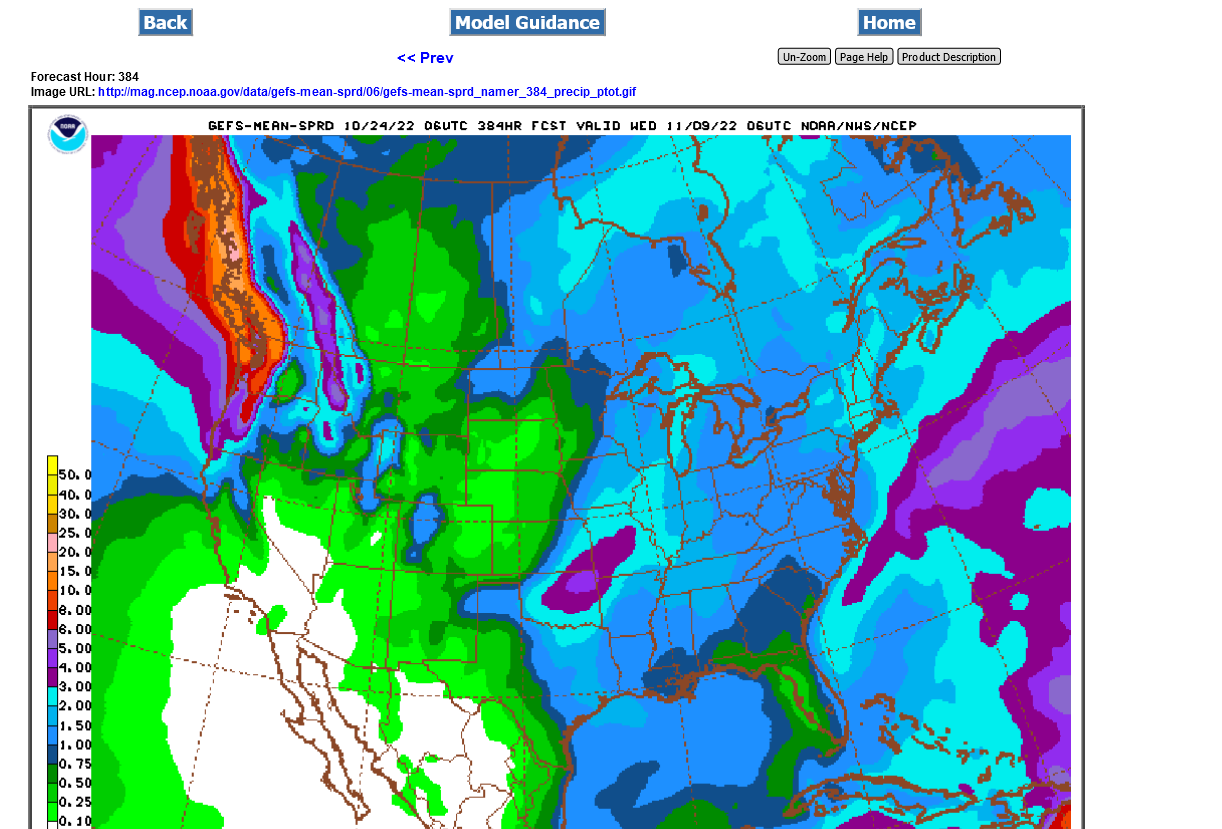
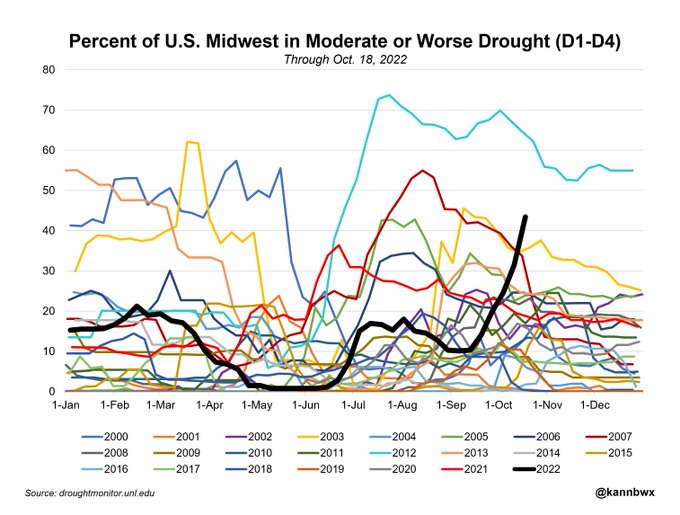
Drought conditions in the U.S. Midwest have rapidly increased in recent weeks. 43% of the area is now in a drought vs 10% in mid-Sept. Only 2012 was drier at this time (data back to 2000). Replenishment may have to wait until spring if the pattern doesn't change soon.
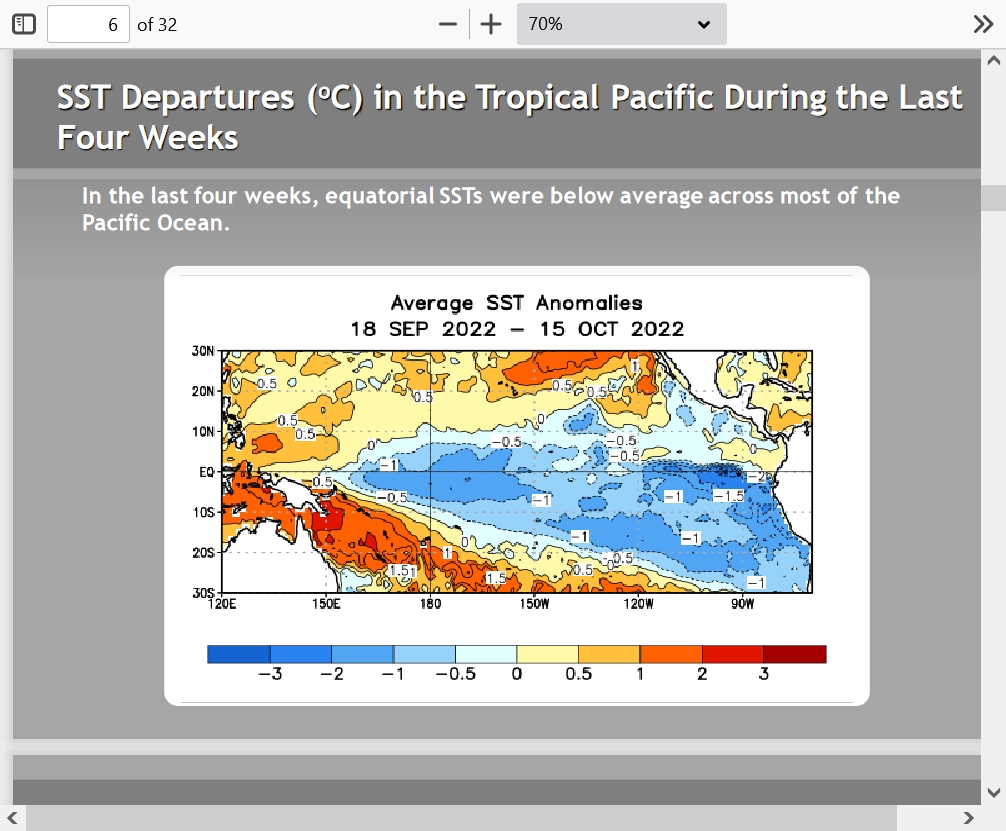
This drought is from the extremely long lived (3rd consecutive year) La Nina/cold water anomalies in the tropical Pacific:
https://www.marketforum.com/forum/topic/89890/
Huge pool of below average temperatures in the tropical Pacific
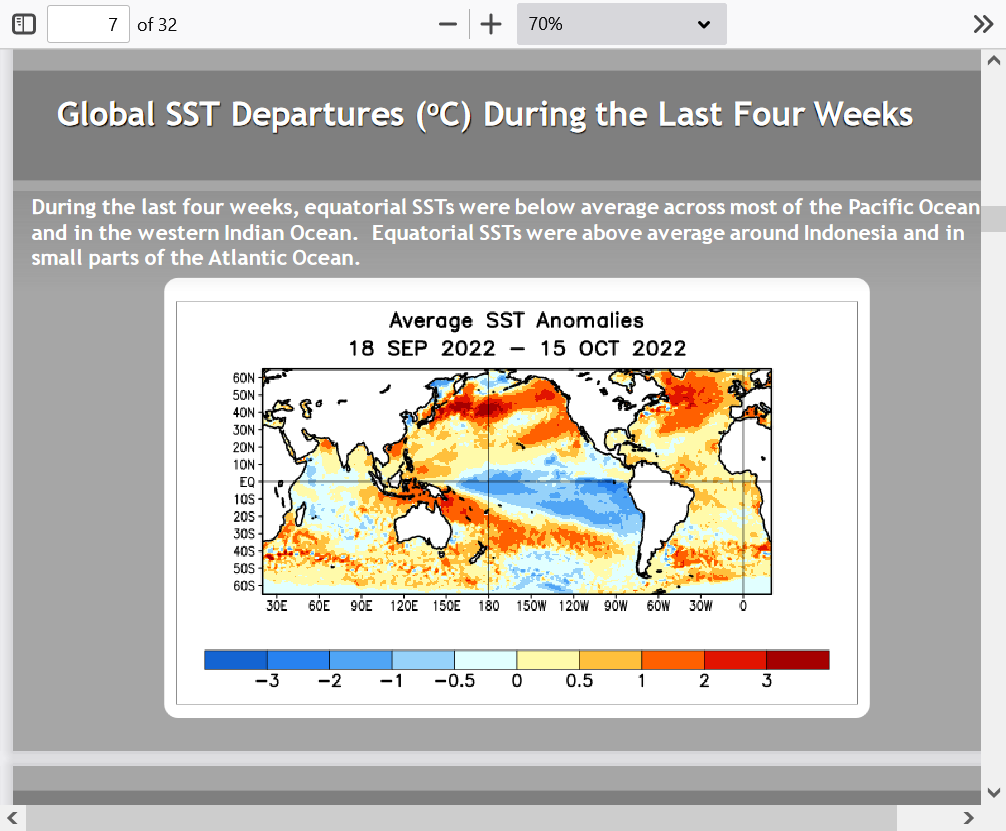
Here it is on a global scale
Rains this week:
https://www.iweathernet.com/total-rainfall-map-24-hours-to-72-hours
https://water.weather.gov/precip/
Precip this week
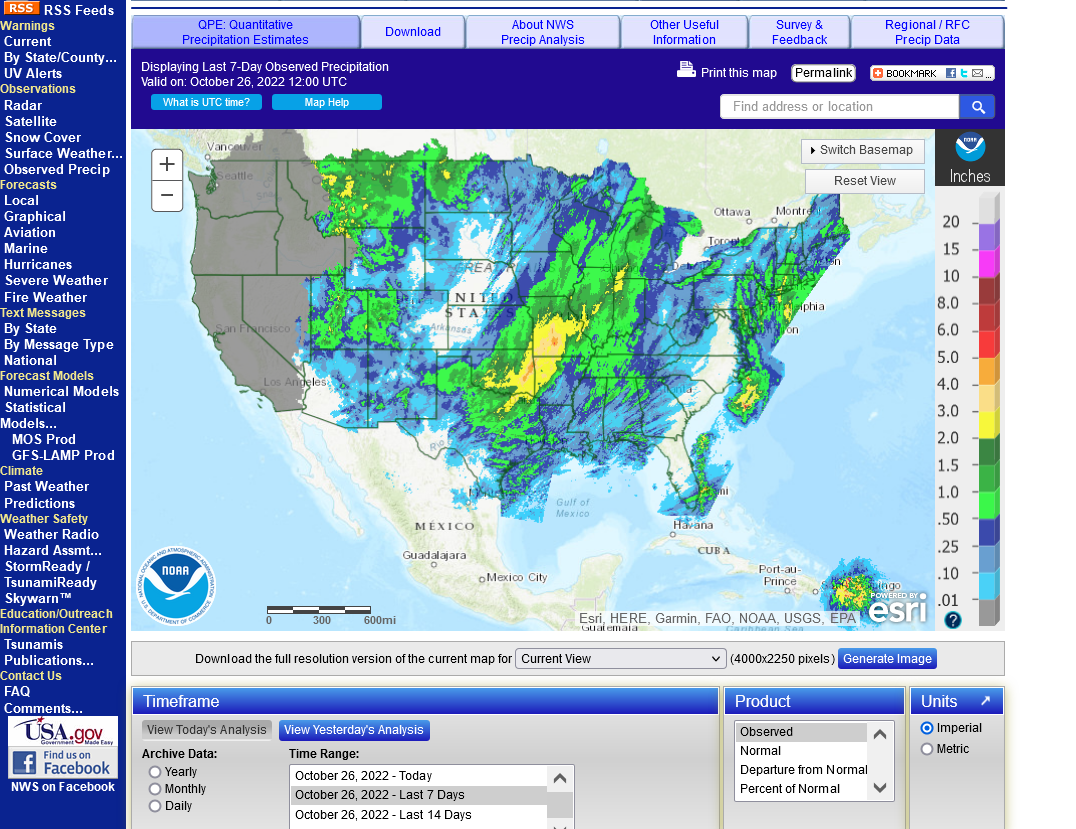
90 day % average precip
The building of the upper level ridge in the east and amplification of the pattern has led to a huge increase in week 2 precip across the country with moisture gushing in from the south: Precip for 2 weeks below. https://mag.ncep.noaa.gov/Image.php
Extended is MUCH wetter!
https://www.marketforum.com/forum/topic/89733/#89734
All the weather:
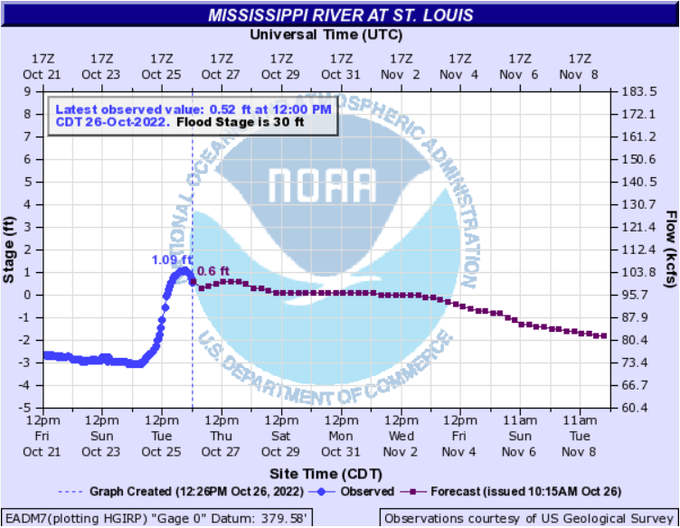
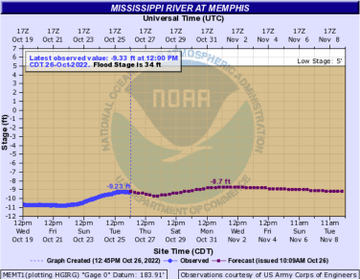
Nice little bump in the Mississippi River water levels at St. Louis after the recent rain event. Downriver levels are still concerning (Memphis shown), but upcoming rains could provide relief. Most of this moisture is expected over the weekend.
Just out 12z GFS ensemble mean.
This will help the lower Miss. river and the southeast Plains.
https://mag.ncep.noaa.gov/Image.php
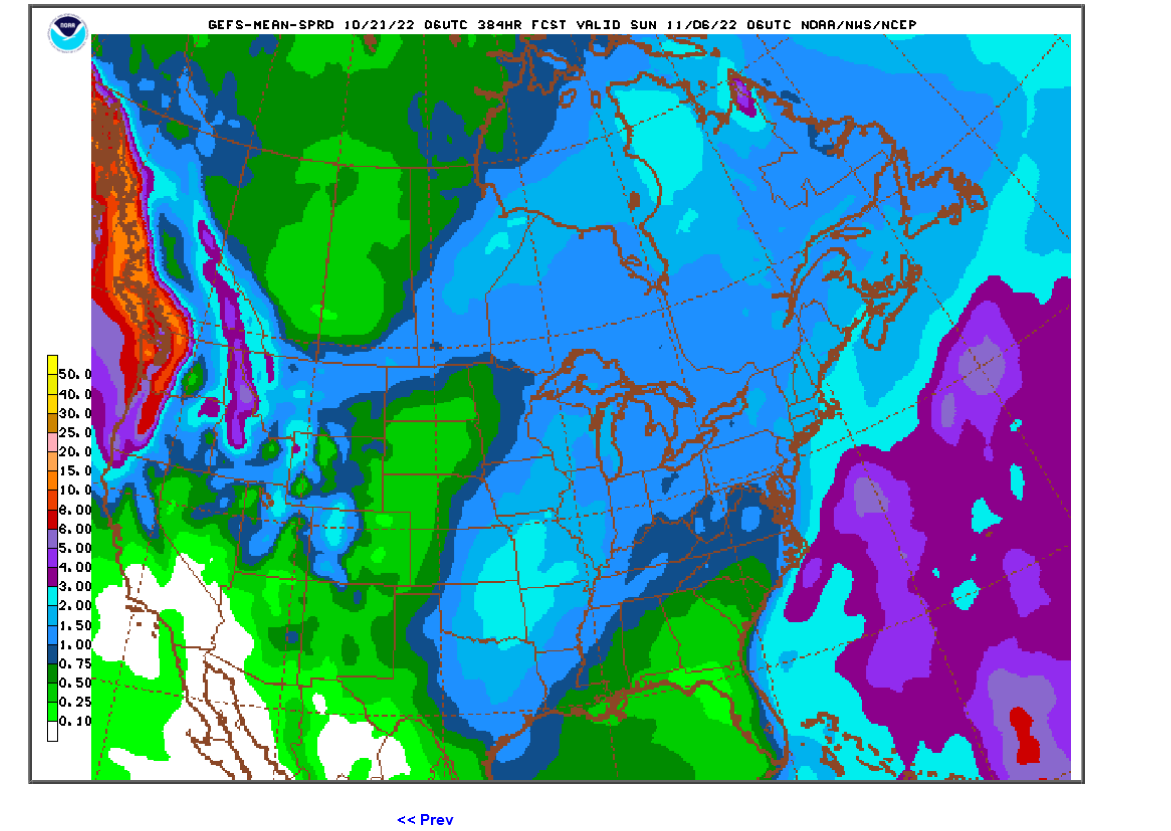
384 hour precip from the 6z GFS ensemble mean. The European model is even a bit wetter. This will help to erode the drought in some very dry places. It's more rain than late last week's maps.
12z below
https://mag.ncep.noaa.gov/Image.php
Precip is actually bearish for grains/wheat but Ukraine news is what matters most!
The European model has even MORE rain than the GFS Ensemble below!
https://mag.ncep.noaa.gov/Image.php