More La Nina lessens the chances for drought relief and continues the chances for the global warming pause to continue. It's also expected compared to last month but NOT expected in the era of global warming and previous El Nino's dominating ….at least not expected by those ignoring the -PDO in the Pacific Ocean.
This La Nina has been responsible for or enhanced the US drought and played a key role in much of this Summer's extreme weather. This extreme weather and the La Nina are part of natural variation.
The modest greenhouse gas warming the last 100 years has added 1 degree C to heat waves and 7% more moisture to rain events.
However, the beneficial growing weather during this climate optimum and increase in CO2 is also, literally feeding 1 billion people and countless other creatures on the planet.
Going back to the old climate, 100 years ago would reduce heat waves by 1 deg. C (2 deg. F) and extreme rain amounts by 7%......but 1 billion people would starve to death and most animals would have less food, including the polar bears that have increased 30% since 2005...especially from the increase in phytoplankton growth, which means more food for the entire Arctic food chain, including polar bears.
The irrefutable scientific law of Photosynthesis has not been repealed. All creatures eat plants or eat something that ate plants. CO2 is the building block for all of life and a beneficial gas.
| EL NIÑO/SOUTHERN OSCILLATION (ENSO) |
| DIAGNOSTIC DISCUSSION |
| issued by CLIMATE PREDICTION CENTER/NCEP/NWS |
| 8 September 2022 |
https://www.cpc.ncep.noaa.gov/products/analysis_monitoring/enso_advisory/ensodisc.shtml
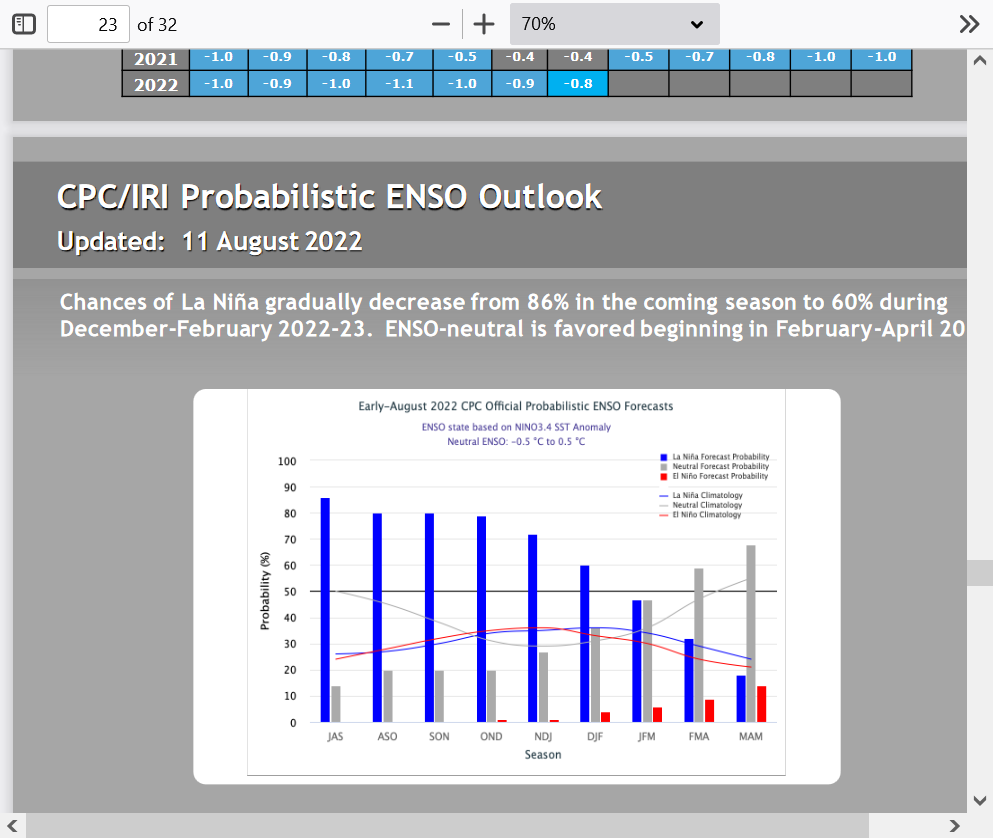
In summary, La Niña is favored to continue through Northern Hemisphere winter 2022-23, with a 91% chance in September-November, decreasing to a 54% chance in January-March 2023 [Fig. 7].
Continuation of the La Niña may also mean an extended southwest monsoon season for India and the rest of south Asia
If it lasts that long, it would be a 30-month-long La Niña and one of the longest on record. The longest La Niña on record was 37-month-long, from the spring of 1973 to the spring of 1976, according to National Oceanic and Atmospheric Administration (NOAA).
https://www.marketforum.com/forum/reply_post/88653/
The condition has strengthened between mid-July and mid-August and may further intensify floods, droughts and tropical cyclones around the world, noted the WMO’s latest update released August 31, 2022.
During a triple dip event, La Niña lasts across three winter seasons in the northern hemisphere.
La Niña is the cooler than the normal phase of the El Niño Southern Oscillation (ENSO) phenomenon in the central and eastern equatorial Pacific Ocean.
There is a 70 per cent possibility that the La Niña will persist from September to November and a slightly lower chance of 55 per cent between December and February, stated the WMO.
If it lasts that long, it would be a 30-month-long La Niña and one of the longest on record. The longest La Niña on record was 37-month-long, from the spring of 1973 to the spring of 1976, according to National Oceanic and Atmospheric Administration (NOAA).
During a La Niña event, the sea surface temperatures over the central and eastern Pacific oceans become cooler than normal. This makes the trade winds and associated storms blowing above them stronger than usual.
These strong trade winds and storms cause more rainfall over some regions such as southeast Asia, especially Indonesia and many parts of Australia, but drastically reduce rainfall in other areas such as the Horn of Africa and western United States.
The triple-year La Niña comes at a time when the impacts of global warming are exacerbating ENSO and the phenomenon itself may be affected by a warming atmosphere and oceans.
“It is exceptional to have three consecutive years with a la Niña event. Its cooling influence is temporarily slowing the rise in global temperatures — but it will not halt or reverse the long-term warming trend,” said Petteri Taalas, secretary general of WMO.
The La Niña started in September, 2020 and is touted to continue through the next six months. This implies an intensification of the devastating droughts in the Horn of Africa, the southern part of South America, especially Chile and the United States.
The protracted La Niña, the first triple dip of the 21st century and only the third since 1950, may also lead to an overactive Atlantic Hurricane season in 2022.
The continuation of the La Niña may also mean an extended southwest monsoon season for India and the rest of south Asia with exceptional episodes of rain and possible floods. In 2021, La Niña was one of the factors that caused extraordinary rainfall during the post-monsoon season in the southern part of India.
In 2022, an active monsoon caused floods in many Indian states, such as Assam, Meghalaya and other northeastern states in June. It has also affected neighbouring Bangladesh.
The sudden floods in Gujarat in the first two weeks of July and subsequent floods in — Rajasthan, Maharashtra, Odisha, Karnataka and Uttar Pradesh — have an imprint of the La Niña, apart from warming sea surfaces leading to the continuous formation of low-pressure areas and depressions.
More such floods could be expected in the next two months in the backdrop of an active La Niña.
The incessant monsoon rainfall in Pakistan, which has submerged a third of the country and displaced 33 million people, may also have been affected by an active La Niña. Apart from other local climatic factors and the heatwaves that preceded the monsoon season, the phenomenon might have contributed to the devastating floods.
Global warming not only exacerbates the devastating floods and droughts that occur during La Nia but may also impact the ENSO.
The strength of ENSO and the frequency of significant ENSO events have increased since 1950 as compared to ENSO events between 1400 and 1950, according to Tom Di Liberto, a climate scientist at NOAA.
“The Intergovernmental Panel on Climate Change’s Sixth Assessment Report also noted that a higher number of El Niño events in the last 20-30 years have been associated with temperature changes that are stronger in the central Pacific rather than the east,” Liberto wrote in theENSO blog published by NOAA.
A research paper published in the journal Nature Reviews Earth and Environment in August 2021 predicted a change in the variability of ENSO-associated rainfalland sea surface temperatures in future warming scenarios.
It has also predicted an eastward shift of the phenomenon, most probably intensifying its impact in North America and South America. The study also cautioned against putting too much trust in the models because of the internal variability of the ENSO.
It is difficult to say whether these changes are due to human-induced green house gas emissions or part of natural variations of the ENSO itself, added Liberto.
This is because of the complexity of the ENSO climatic system and the inconsistency of different climate models in accurately predicting the exact impact of a warming atmosphere and oceans on the intensity and frequency of ENSO.
metmike: They are confused and/or misled. Siting sources like this: “The Intergovernmental Panel on Climate Change’s Sixth Assessment Report also noted that a higher number of El Niño events in the last 20-30 years have been associated with temperature changes"
This is the complete OPPOSITE of an El Niño! A La Nina and its one of the longest in history......which is REALLY the opposite. Ironically, the world was supposed to continue to have MORE EL NINO'S with global warming and climate change NOT more La Nina's.
A 3 year La Nina, with massive cold water anomalies in the Eastern/Central Tropical Pacific can't be caused by global warming and is especially unusual in a warming environment.
However, natural weather/climate and a -PDO (multi decadal climate oscillator) are in control right now of the weather/climate, not the 1 deg. increase in temps from the increase in CO2 superimposed on the planet(greater in higher latitudes/coldest places).
La Nina in combination with natural variation are entirely responsible for the flooding rain events and heat waves the past 2 Summers. Global warming probably made the hottest air 2 deg. F hotter and the heaviest rains, potentially 7% greater. However, the droughts were greatly enhanced, if not completely caused (in some cases) by La Nina.
The best thing for the planet in places experiencing drought and extreme heat would be for the 6 year pause in global warming TO END, with another El Nino!!!
+++++++++++++++++++++++++
https://www.marketforum.com/forum/topic/88256/
From Cliff Mass: Considering the substantial confusion in the media about this critical issue, let me provide the GOLDEN RULE OF CLIMATE EXTREMES. Here it is:
The more extreme a climate or weather record is, the greater the contribution of natural variability.
Or to put it a different way, the larger or more unusual an extreme, the higher proportion of the extreme is due to natural variability.
It's extremely hot (record breaking) in the West right now for sure. But the Golden Rule of Climate Extremes, based on scientific principles of meteorology/climate is once again telling us where the VAST majority of the extreme heat came from.............Natural variability. In places 20 degrees above average right now, we can estimate with high confidence that 2 degrees came from global warming...........and the other 18 degrees came from the natural variability of weather that has been happening since before humans were here.
ENSO: Recent Evolution,
Current Status and Predictions
Update prepared by:
Climate Prediction Center / NCEP
5 September 2022
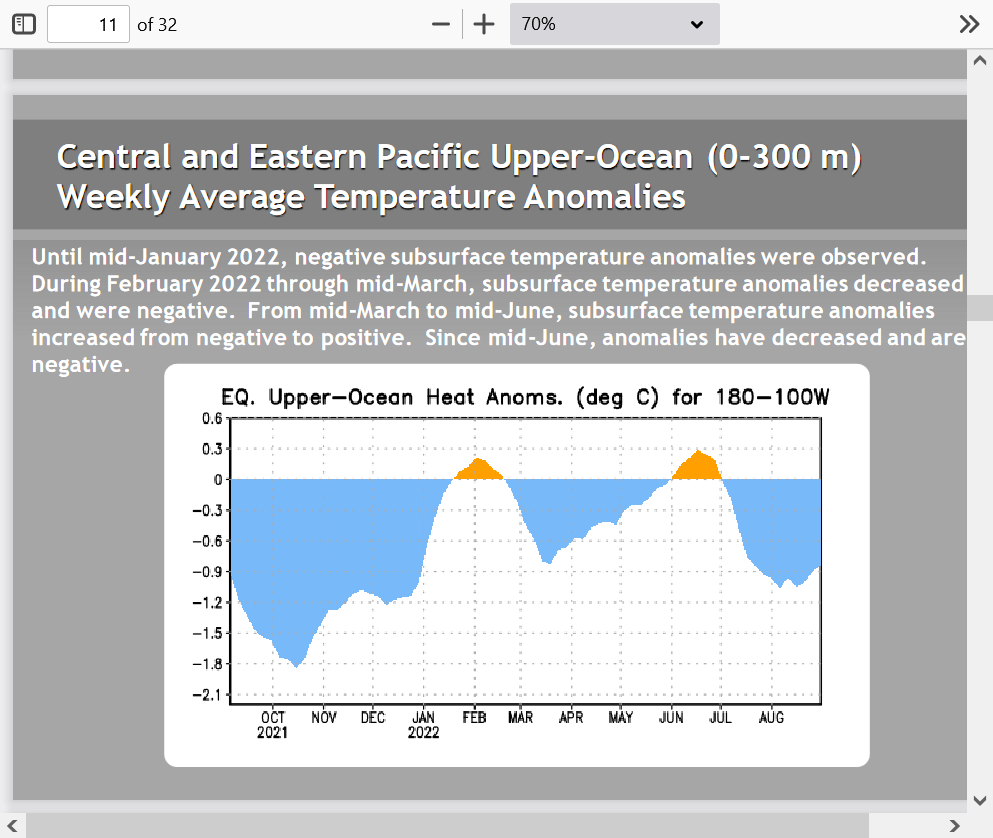
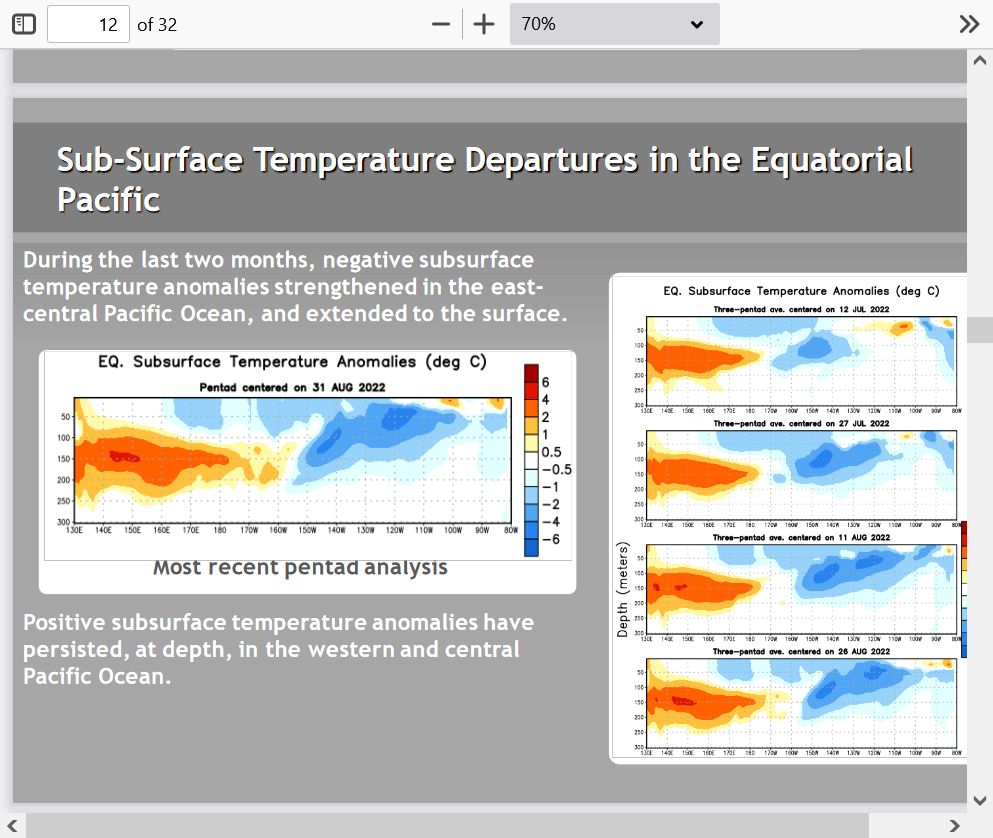
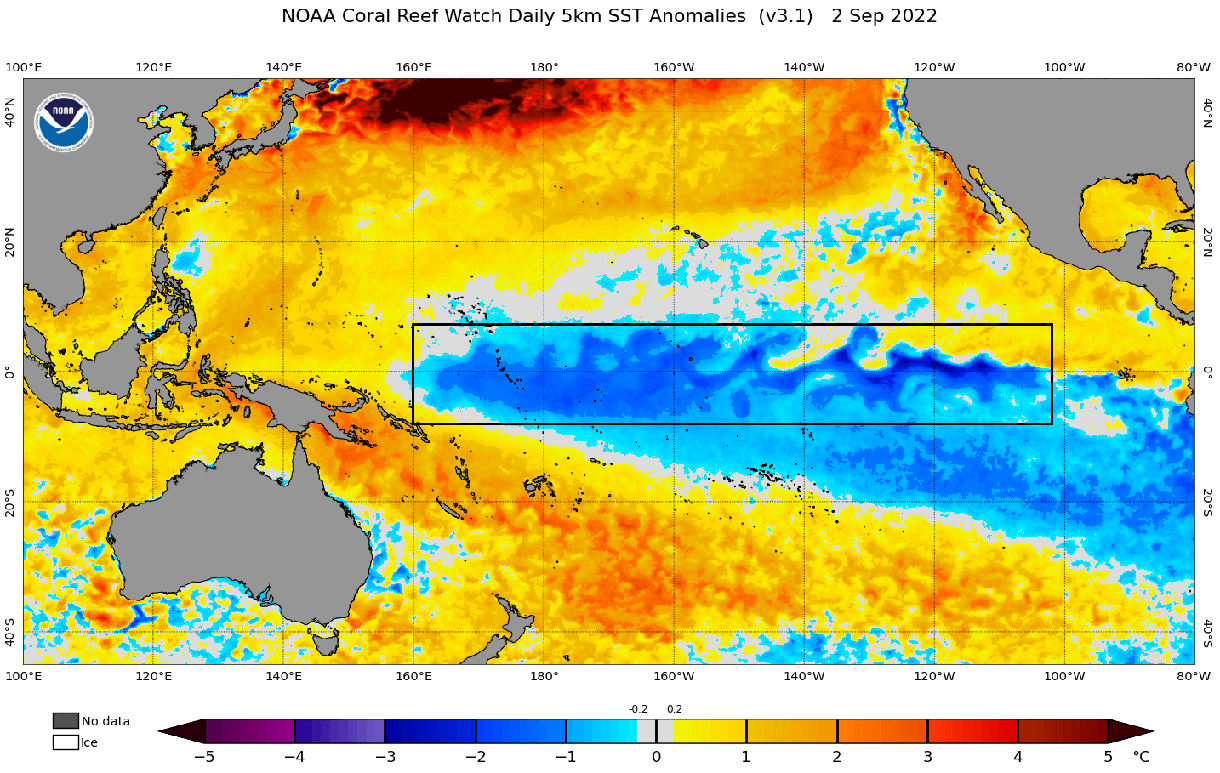
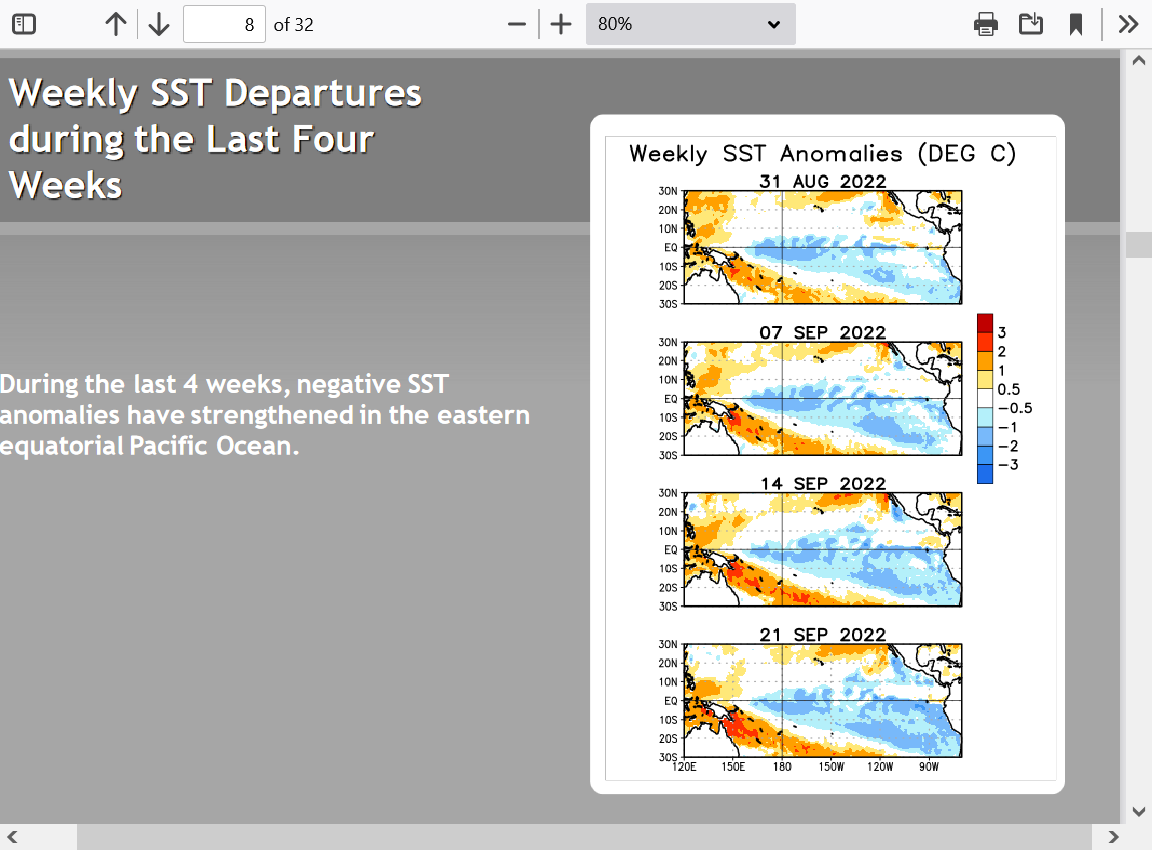
Here are some temperature maps/charts to show the La Nina in the Eastern/Central tropical Pacific.
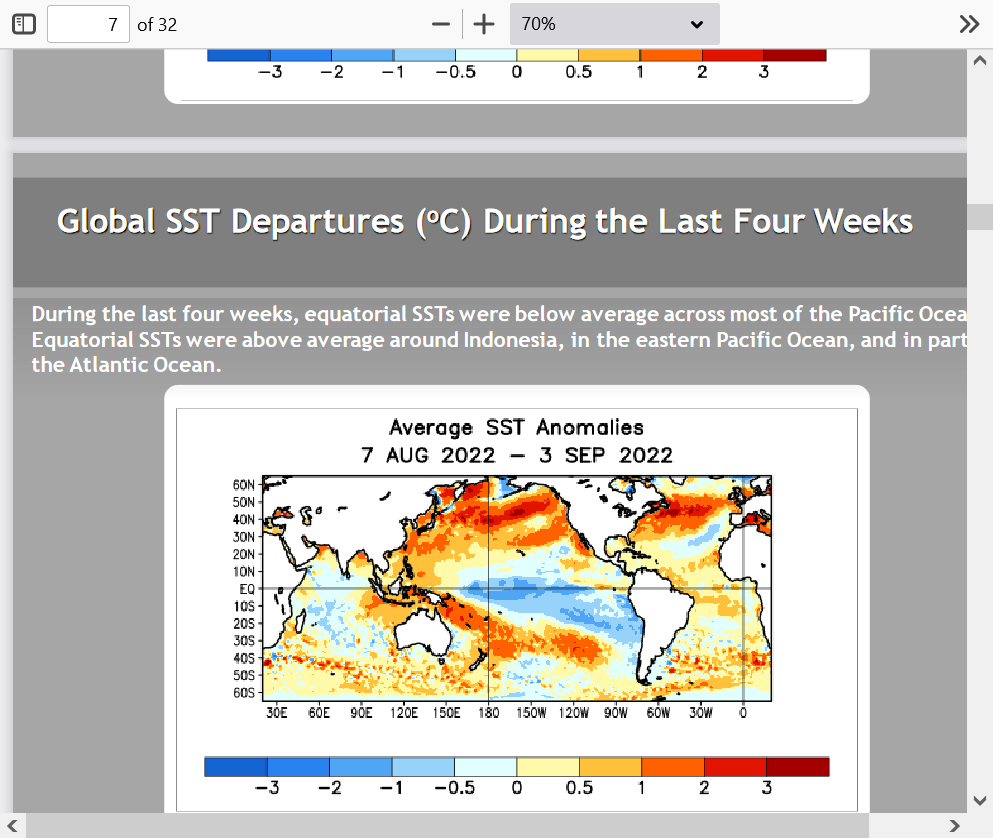
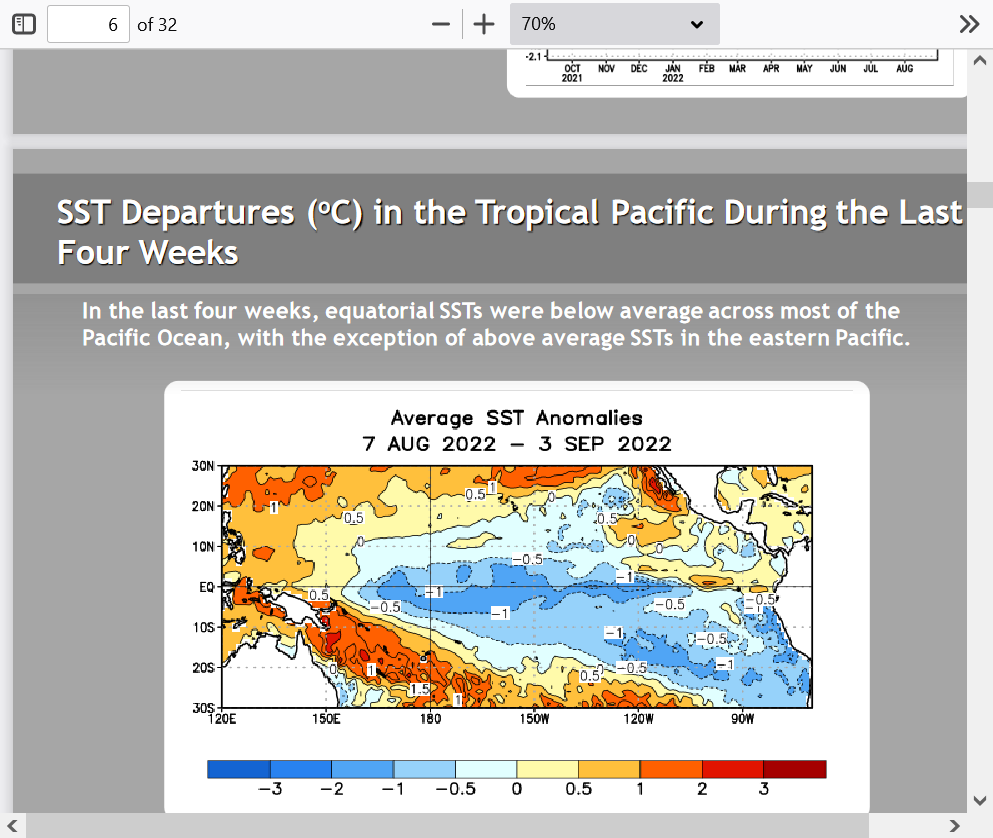
Still plenty of negative temperature anomalies to keep it going for awhile.
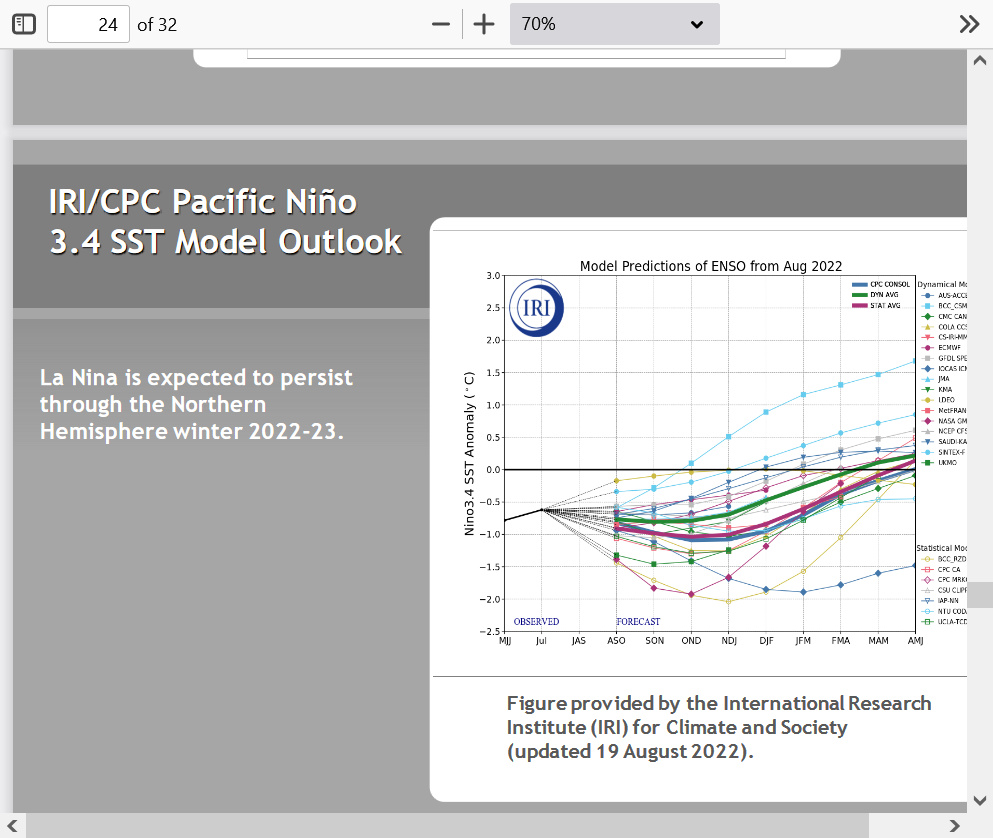
Here are the latest model forecasts. They have killed this La Nina too soon many times but it's can't go on forever.
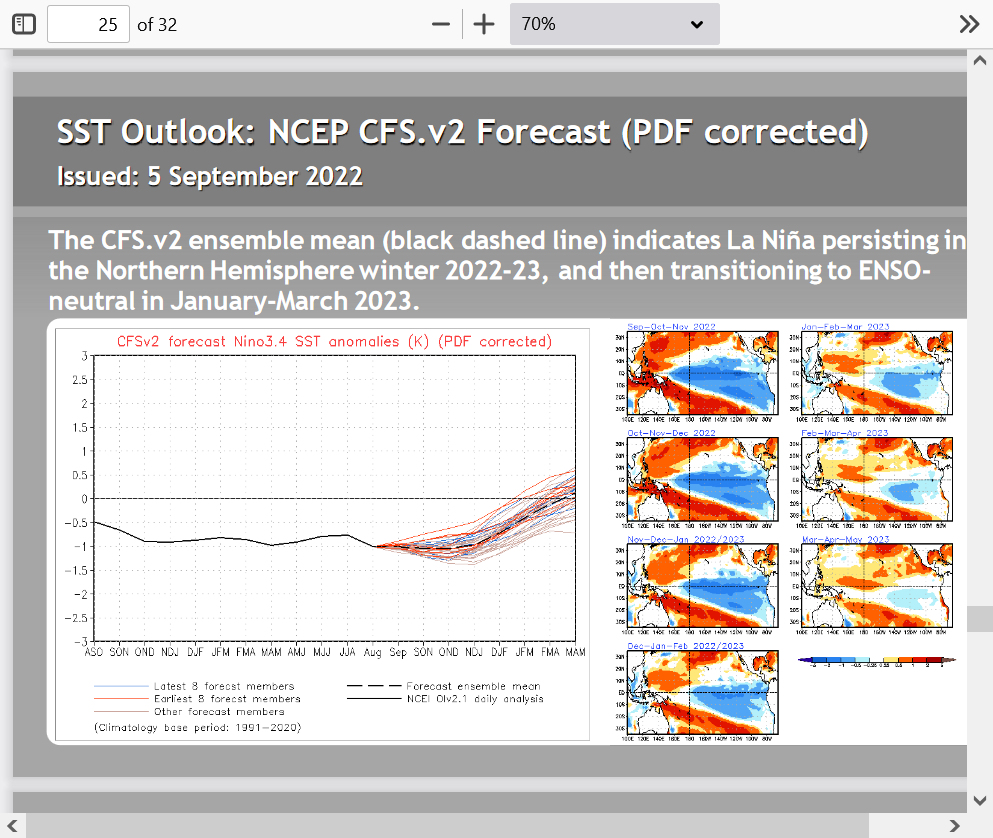
We actually know what's causing this La Nina to last so long.

++++++++++++++++++++++++++++++++++++++++++++++++++++++++++++++++++++
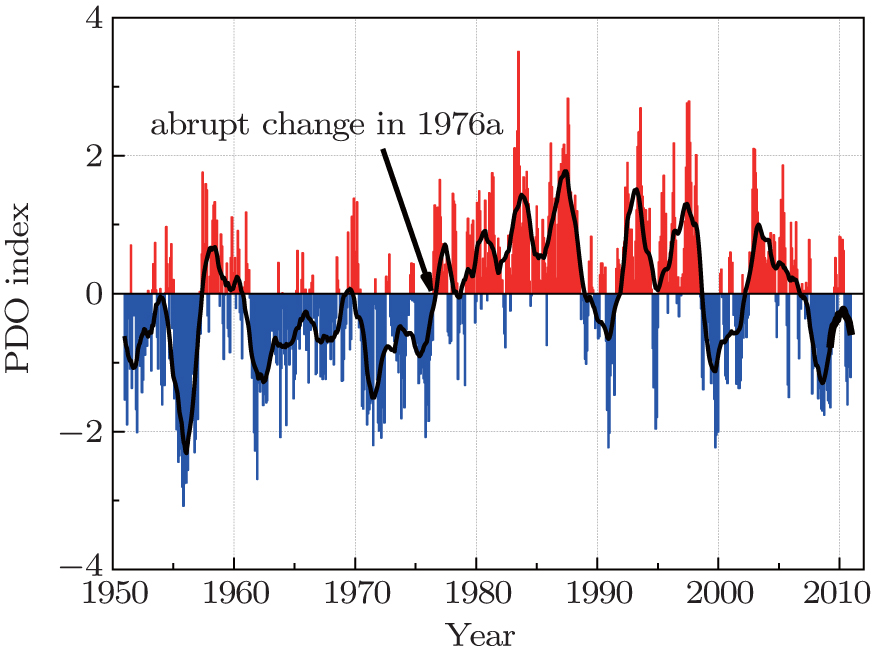
Notice how the pattern above is not a perfect, classical -PDO like below but still features the big warm anomalies north and cold anomalies south.
https://legacy.climate.ncsu.edu/climate/patterns/pdo

-PDO regimes can last for 3+ decades and they CAUSE more La Nina's. +PDO regimes also last for decades and are the opposite temperature pattern in the Pacific, also causing more El Nino's..........just like we had in the 1980'/90's.
+++++++++++++++++
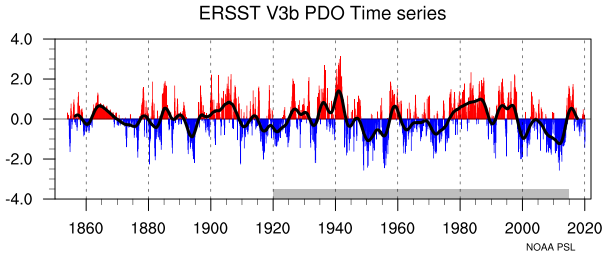
This is the PDO index below. There was modest global cooling in the 1950s/60s/early-mid 70's. Global warming from CO2 increasing was enhanced in the 1980's/90's by El Nino's with the +PDO regime.
We are back in a -PDO Regime which favors more La Nina's and much longer La Nina's!
http://cpb.iphy.ac.cn/article/2015/cpb_24_8_089201/cpb150091f2_hr.jpg.html
The main reason for the dryness in the West to Midwest during the past 3 years is the long lived La Nina. La Nina's change the course of winds and weather systems downstream. The closer to the La Nina, usually the stronger the impact.
La Nina's correlate strongly to persistent upper level high pressure domes in the West that, at times can shift farther east into the Plains and Midwest during the growing season.
The last 2 widespread, major droughts in the Midwest were caused by the La Nina's in 2012 and 1988. The record long period in between those droughts (24 years) represented the best crop growing weather in recorded history for this extremely high producing region. This has been part of the climate change that we never read about. During that time, we had a great deal of El Nino's during a mainly +PDO regime.
La Nina's feature COOL/NEGATIVE water temperature anomalies in the E/C tropical Pacific Ocean. They are NOT caused by global warming!
I'd be willing to bet my house that when we have our next major El Nino, the precipitation out West will increase and likely help ease the drought in the West and increase levels on Lake Meade, especially if water use cuts are maintained for awhile and ESPECIALLY if we had an EL Nino that was moderate/strong for an entire Winter. 2 Winters like that and I'll bet my life on it (-:
However, it's difficult to have El Nino's especially a long lived El Nino when the PDO is solidly negative as it is right now. +PDO correlates strongly with El Ninos(warm temp anomalies in the E/C tropical Pacific) and favorable weather in the US growing season/less drought.
This guy has some wonderful stuff!
By: Author Andrej Flis
Posted on Published:
Categories Long range / seasonal forecast
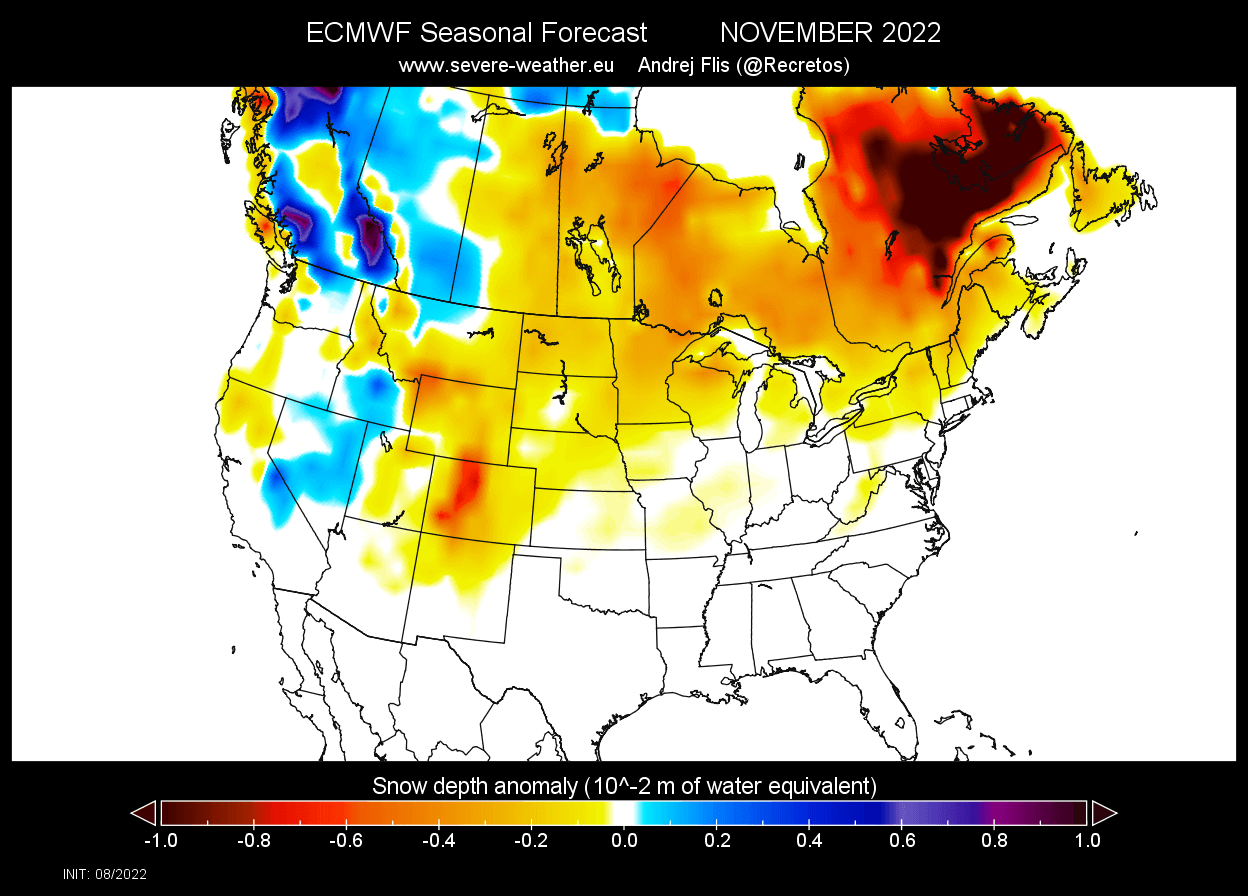
Winter 2022/2023 snowfall predictions show a global climate signal from the La Nina, now active for a third consecutive year. From Canada to the United States and across the Atlantic to Europe, we will look at the snowfall forecast and trends for the upcoming Winter.
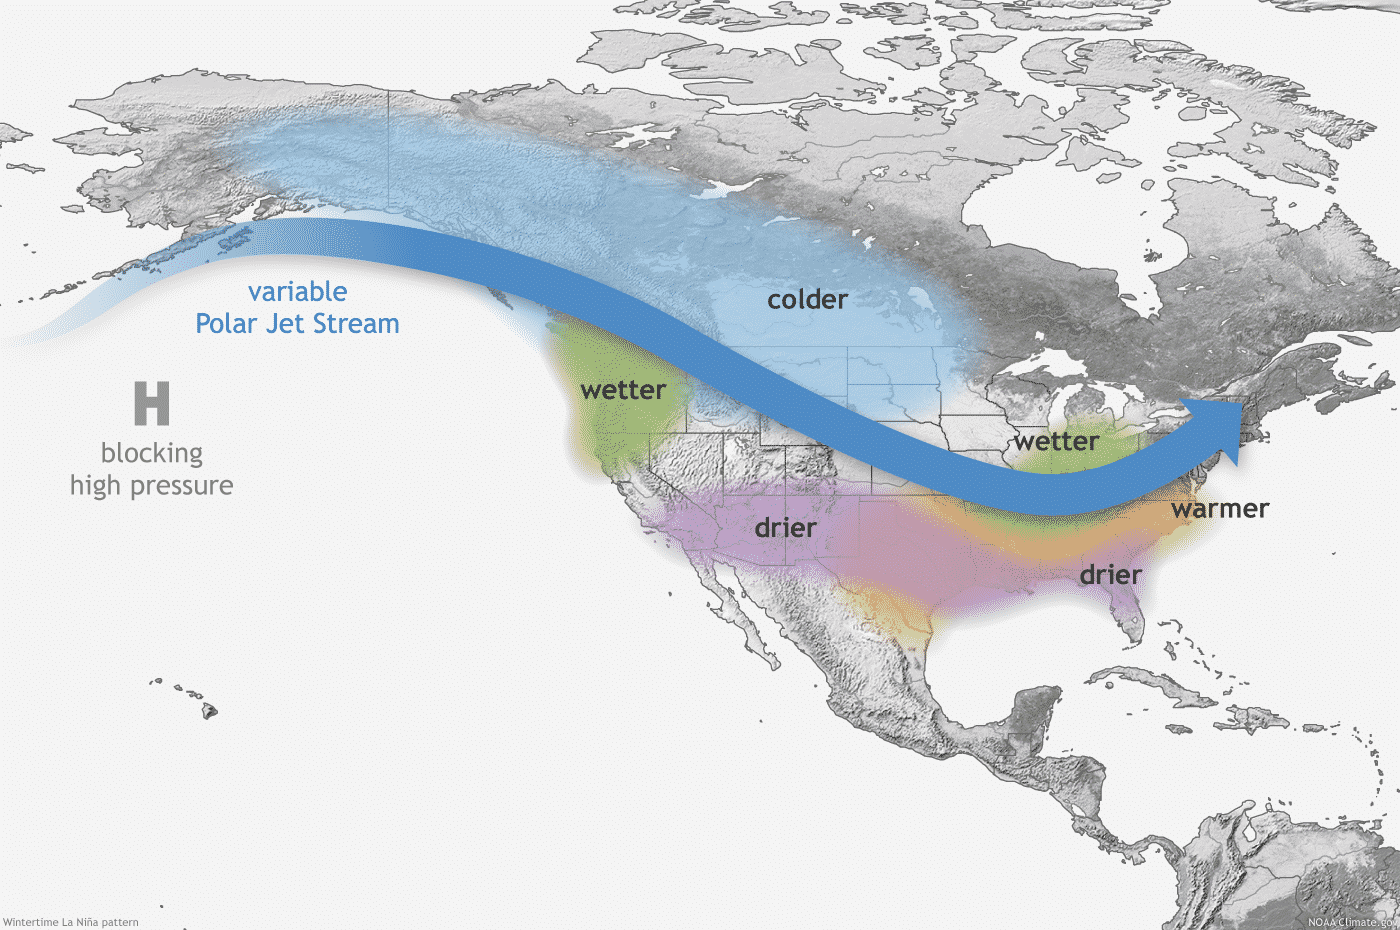
Historically, a strong blocking high-pressure system in the North Pacific is the most typical effect of a cold ENSO phase (La Nina). That usually redirects the polar jet stream down over the northern United States.
The image below shows the average pressure pattern during the last few La Nina winters. We can see a strong high-pressure system in the North Pacific and a low-pressure area over Canada and the northern United States. Images by NOAA Physical Sciences Laboratory (PSL).
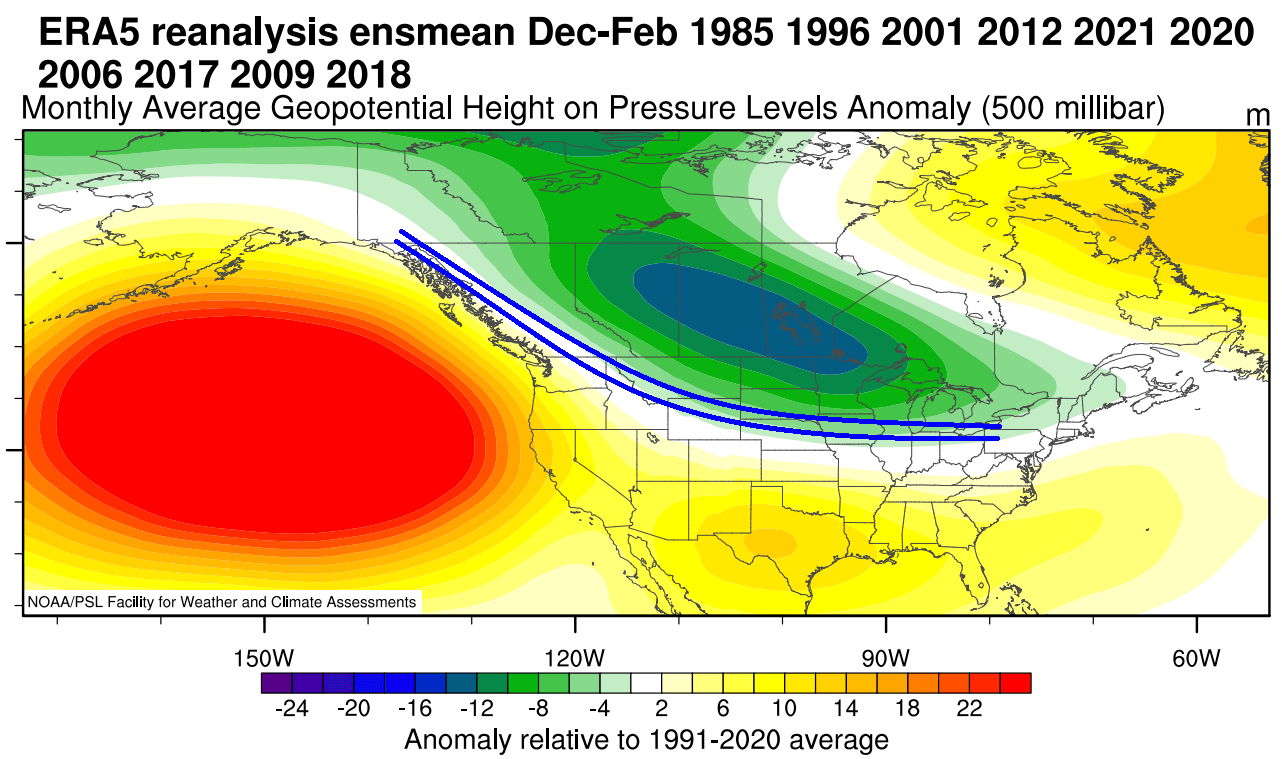
The circulation of the strong high-pressure system promotes the development of a low-pressure region over Alaska and western Canada. It curves the jet stream downwards between the two pressure systems, marked by the blue lines.
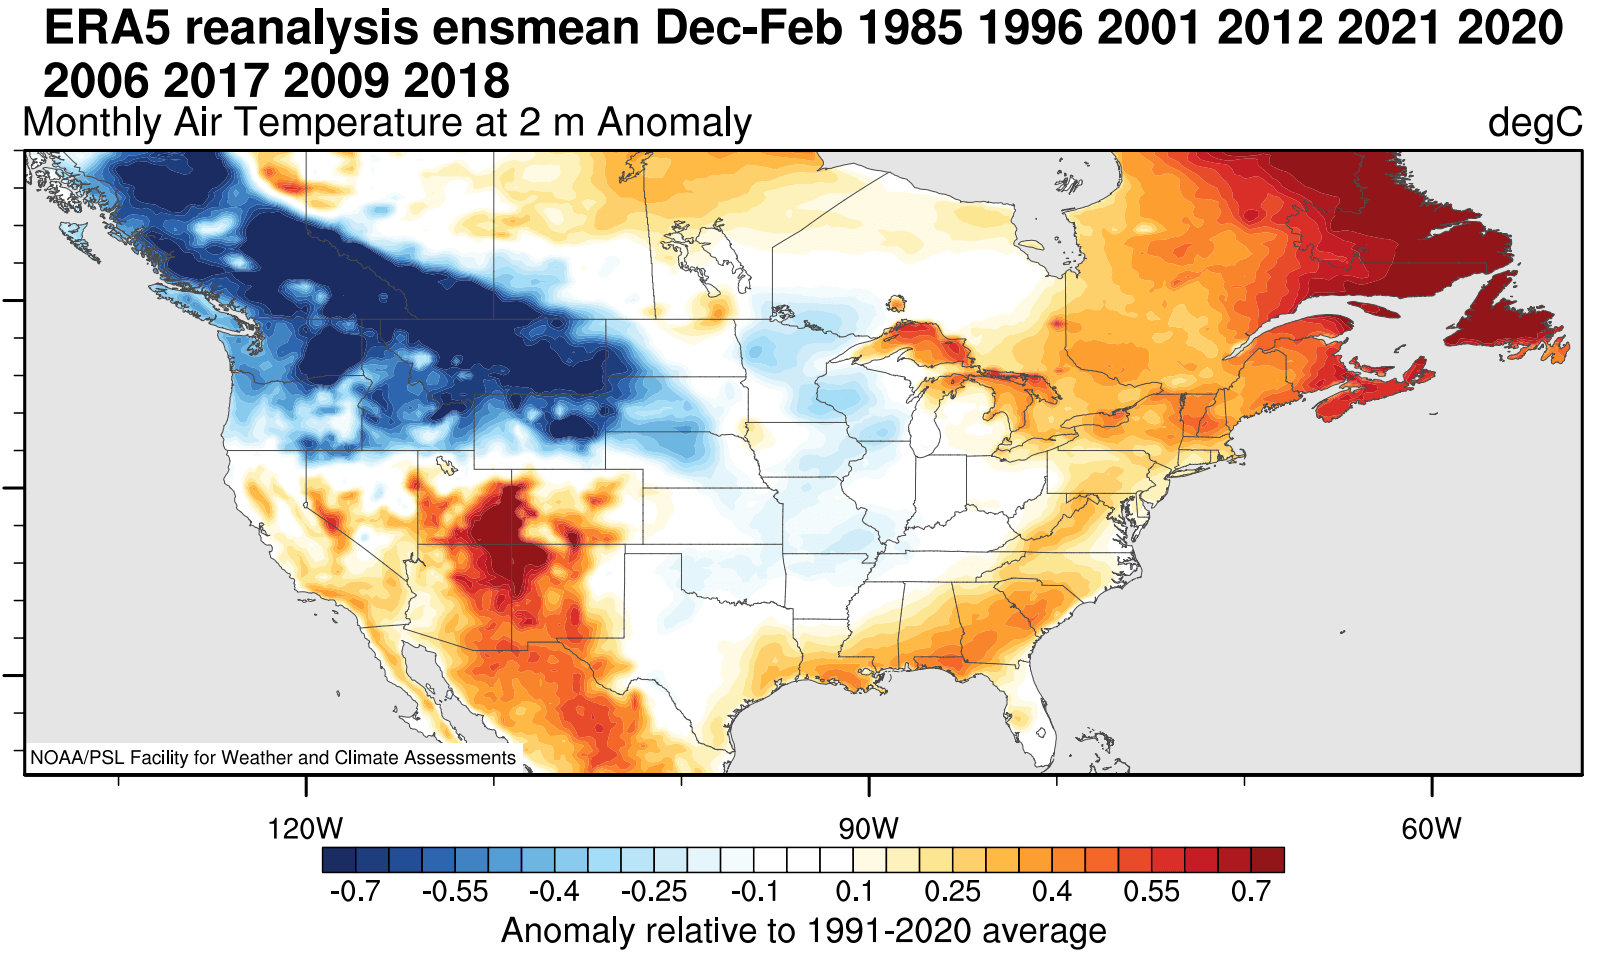
Warmer than normal weather and mild winter conditions are typically over the southwestern United States, eastern United States, and Canada. The main winter weather “battle zones” are usually in the Midwest and the central United States.
Precipitation-wise, drier La Nina winters are usually over the southwestern United States and Canada. Drier conditions are also found in the southeastern United States, as La Nina means a weaker subtropical jet stream and less moisture for the east. More precipitation is typical over the northwestern United States, the Great Lakes, and parts of the northeast.
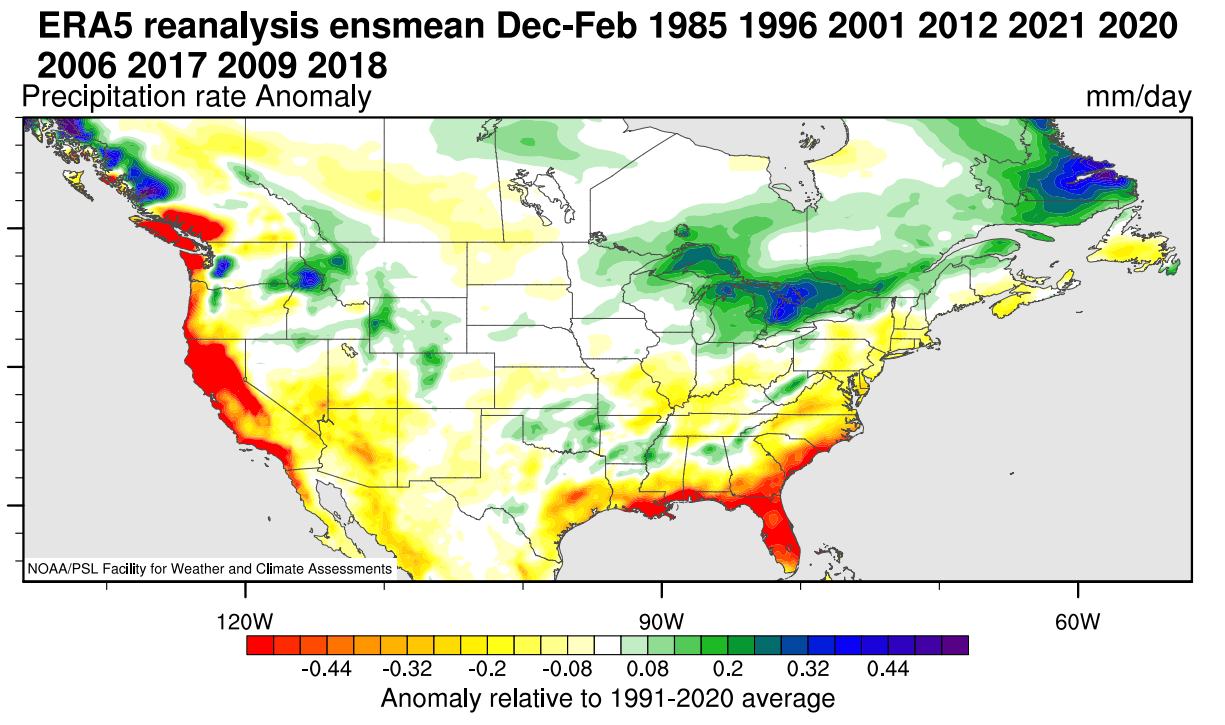
But speaking of precipitation, what about snowfall? The data shows that the La Nina jet stream also changes the snowfall potential over North America as the pressure systems take a different path.
The colder air is more easily accessible to the northern United States, which increases the snowfall potential if moisture is available. In the graphic below by NOAA-Climate. You can see the average snowfall pattern for weak La Nina years, as expected this Winter season.
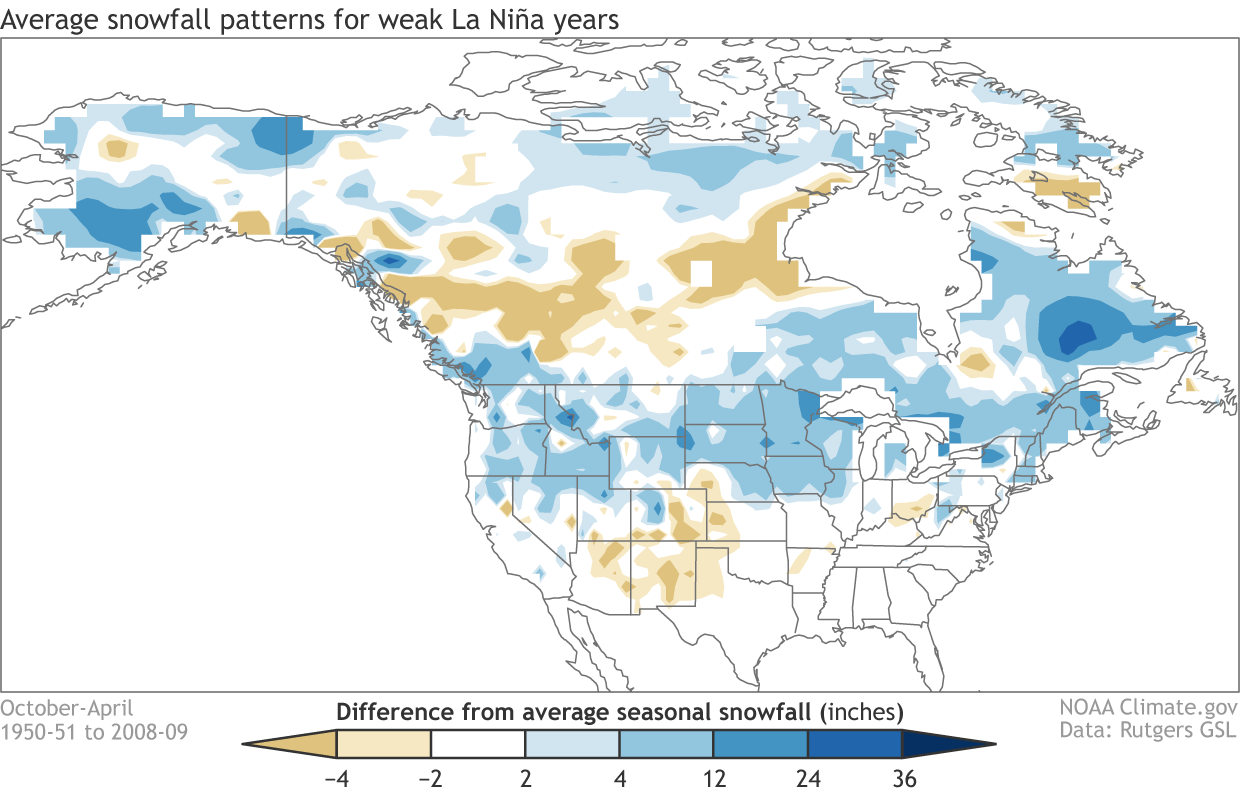
Besides the northwestern United States and the Midwest, we can see more snowfall potential over the northeastern United States and eastern Canada.
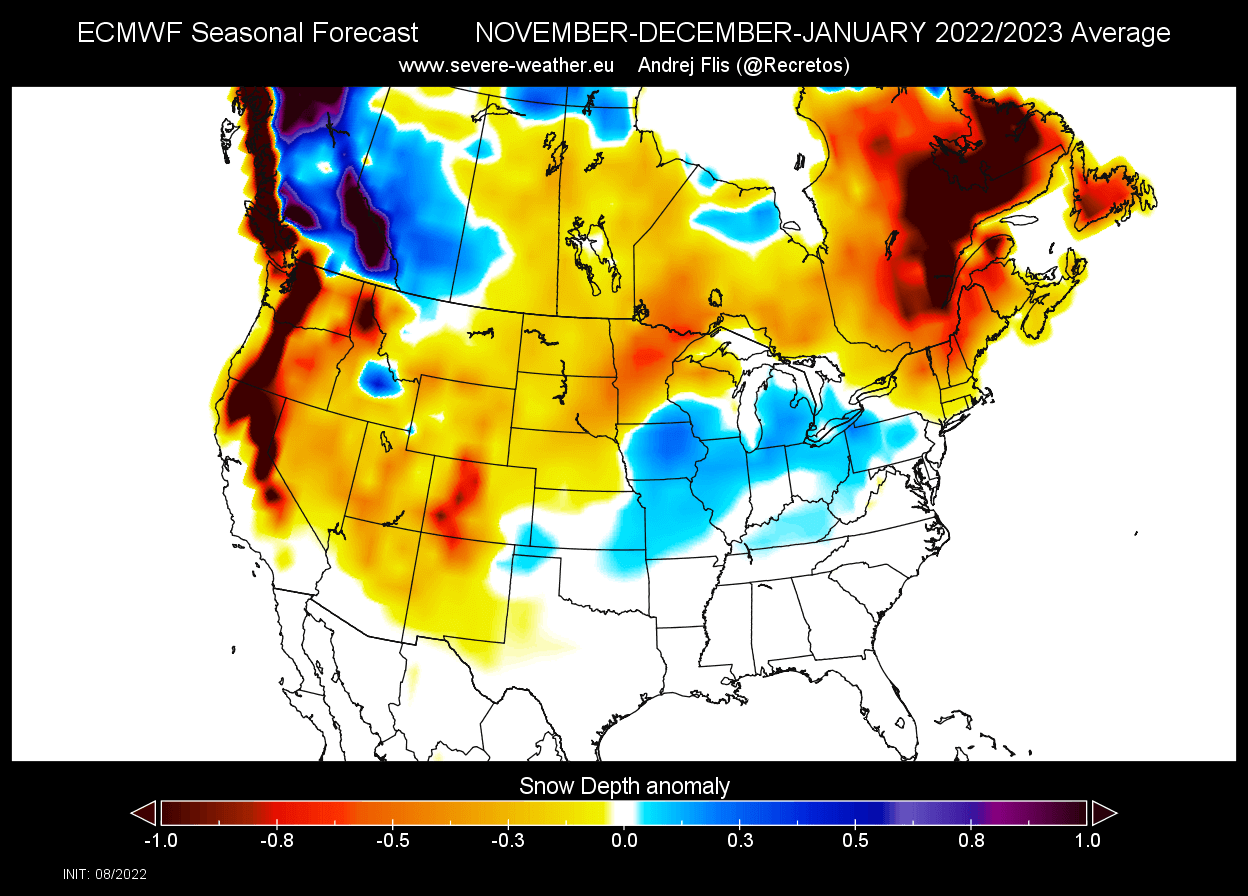
But now, we will look at some early Winter snowfall predictions from actual forecast models. We know what to expect now from historical data.
Starting with the average image for the United States and Canada, we can see more snowfall over western Canada and the eastern United States. Surprisingly, we can see less snowfall forecast over the western United States. This is potentially very bad news for Lake Mead and the Western Drought.
metmike: I'm thinking that the Upper Midwest will see more snow than this but seasonal forecasts are low skill by their nature and with this being a seasonal snow forecast, even lower skill. Trying to fine tune it is more speculation than weather forecasting.
The November snowfall forecast shows some increased snowfall potential over the higher elevations of the western United States and Canada. However, in late Fall, less snowfall is seen over much of central and eastern Canada and the Midwestern United States.
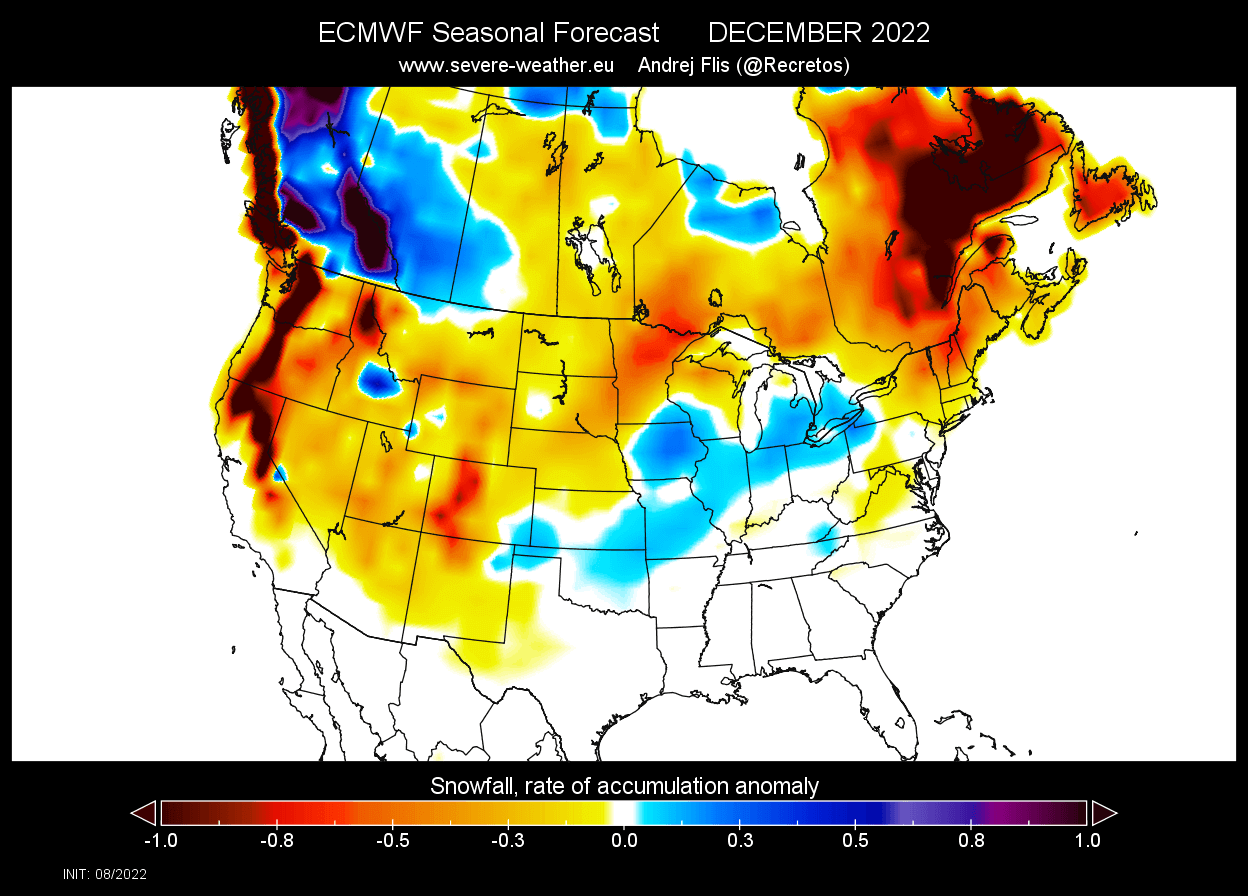
The December snowfall forecast shows the potential increase over the south-central United States, expanding over parts of the Midwest into the Great Lakes. Less snowfall is shown in this forecast run over the western United States.
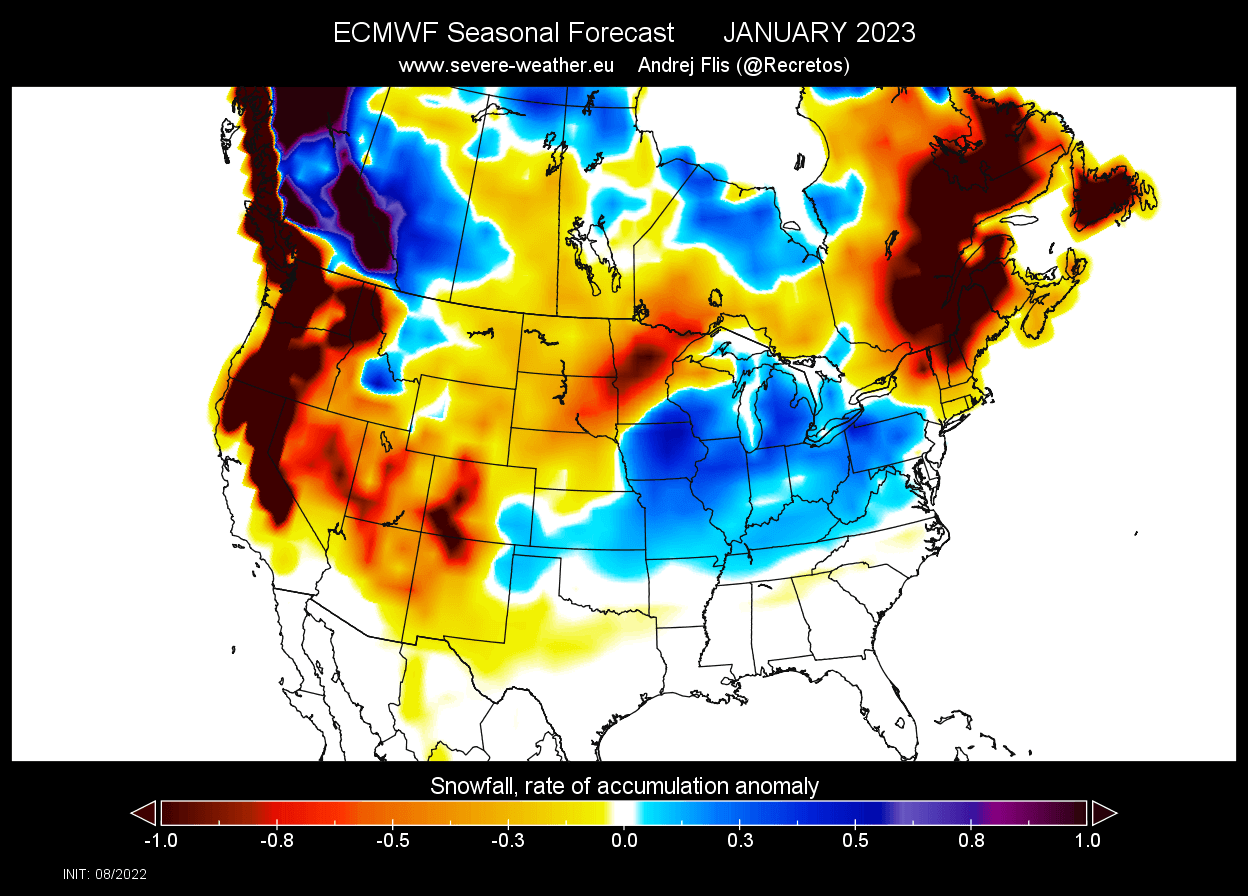
January snowfall forecast shows an even stronger pattern, with more snowfall in the same regions as the previous month. But the lack of snowfall over the upper Midwest and the northwestern United States is surprising in a La Nina winter. This is likely to be corrected in future runs.
Scroll up for the previous posts, including the upcoming Winter forecast.
+++++++++++++++++++++++++++
The La Nina that won't die has actually strengthened a bit this month!(cool water anomalies in the tropical Pacific-the complete opposite of global warming-a big reason that there's been a long pause in global warming for over 6 years and the main cause of the drought out West the past 3 seasons)
See all the ENSO/La Nina maps at the link below:
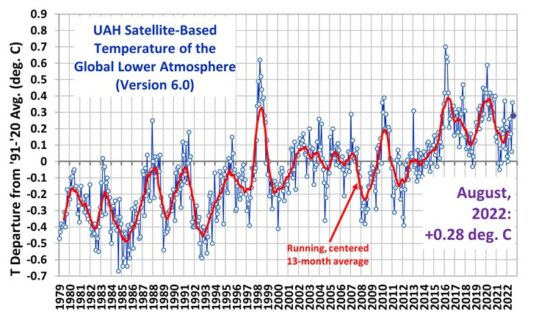
https://www.drroyspencer.com/2022/09/uah-global-temperature-update-for-august-2022-0-28-deg-c/
![[Fig. 7]](https://www.cpc.ncep.noaa.gov/products/analysis_monitoring/enso_advisory/figure07.gif)