Most of the maps below are updated daily/automatically.
5-28-21: The weather flipped to being bullish on 5-26
5-19-21: As mentioned several times, the weather pattern turned bearish for the grains on 5-9-21 and has remained that way with drought stricken ND on tap to get the most rain in at least a year. Maybe 2 inches in many places.
ND to the Great Lakes region are by far the driest right now. This is the opposite of how it was in 2012.
https://www.marketforum.com/forum/topic/69635/#69643
Interesting that the ECB where this upcoming heat ridge will dominate, will see near 90 and not much rain into early next week......something to consider as potentially bullish at some point but the heat ridge is transient and is gone in week 2.
The upcoming heat ridge does not block moisture from the Gulf of Mexico, like the ones in 2012 that were farther west. In fact, this one encourages moisture to return from the GOM and makes rains in the Plains and Western Cornbelt.
I'll have a thread on the weather pattern from 2012 later today that will show you what happened.
The latest rain forecasts are below.
Day 1 below:
http://www.wpc.ncep.noaa.gov/qpf/fill_94qwbg.gif?1526306199054

Day 2 below:
http://www.wpc.ncep.noaa.gov/qpf/fill_98qwbg.gif?1528293750112

Day 3 below:
http://www.wpc.ncep.noaa.gov/qpf/fill_99qwbg.gif?1528293842764

Days 4-5 below:
http://www.wpc.ncep.noaa.gov/qpf/95ep48iwbg_fill.gif?1526306162

Days 6-7 below:
http://www.wpc.ncep.noaa.gov/qpf/97ep48iwbg_fill.gif?1526306162

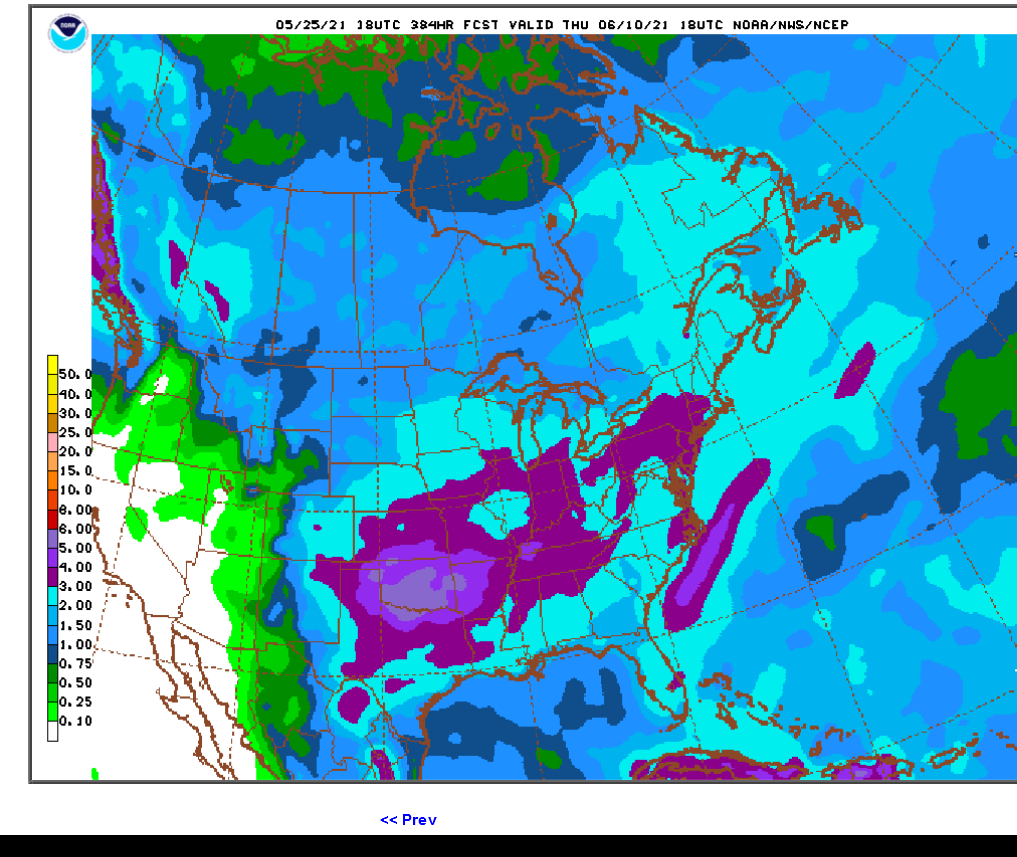
7 Day Total precipitation below:
http://www.wpc.ncep.noaa.govcdx /qpf/p168i.gif?1530796126

Severe Storm Risk.
https://www.spc.noaa.gov/products/outlook/
Current Day 1 Outlook | |
Current Day 2 Outlook | |
Current Day 3 Outlook | |
Current Day 4-8 Outlook |
Weather maps for days 3-7 below:

Highs for days 3-7:
https://www.wpc.ncep.noaa.gov/medr/medr_max.shtml


Extended weather.......non threatening, the week 1 heat ridge weakens on many model solutions.
https://www.cpc.ncep.noaa.gov/products/predictions/610day/ | |||||||||
| 6 to 10 day outlooks | |||||||||
| Click below for information about how to read 6-10 day outlook maps Temperature Precipitation | |||||||||
| Click below for archives of past outlooks (data & graphics), historical analogs to todays forecast, and other formats of the 6-10 day outlooks ArchivesAnalogsLines-Only FormatGIS Data | |||||||||
Temperature Probability | |||||||||
Precipitation Probability | |||||||||
Soilmoisture anomaly:
These maps sometimes take a day to catch up to incorporate the latest data(the bottom map is only updated once a week).
https://www.cpc.ncep.noaa.gov/products/Soilmst_Monitoring/US/Soilmst/Soilmst.shtml#
![]()


Drought Monitor....long term drought.
Top map was last Thursday(20th)...the latest map. 2nd map was the previous week/map.
https://droughtmonitor.unl.edu/Maps/CompareTwoWeeks.aspx


This link below provides some great data. Hit the center of the box below for the area that you want, then go to observation on the far left, then surface observations to get constantly updated surface observations. Let us know how much rain you got/get!
 |
Current Conditions below updated every few minutes.
https://www.spc.noaa.gov/exper/mesoanalysis/new/viewsector.php?sector=13#


Additional other good weather information:

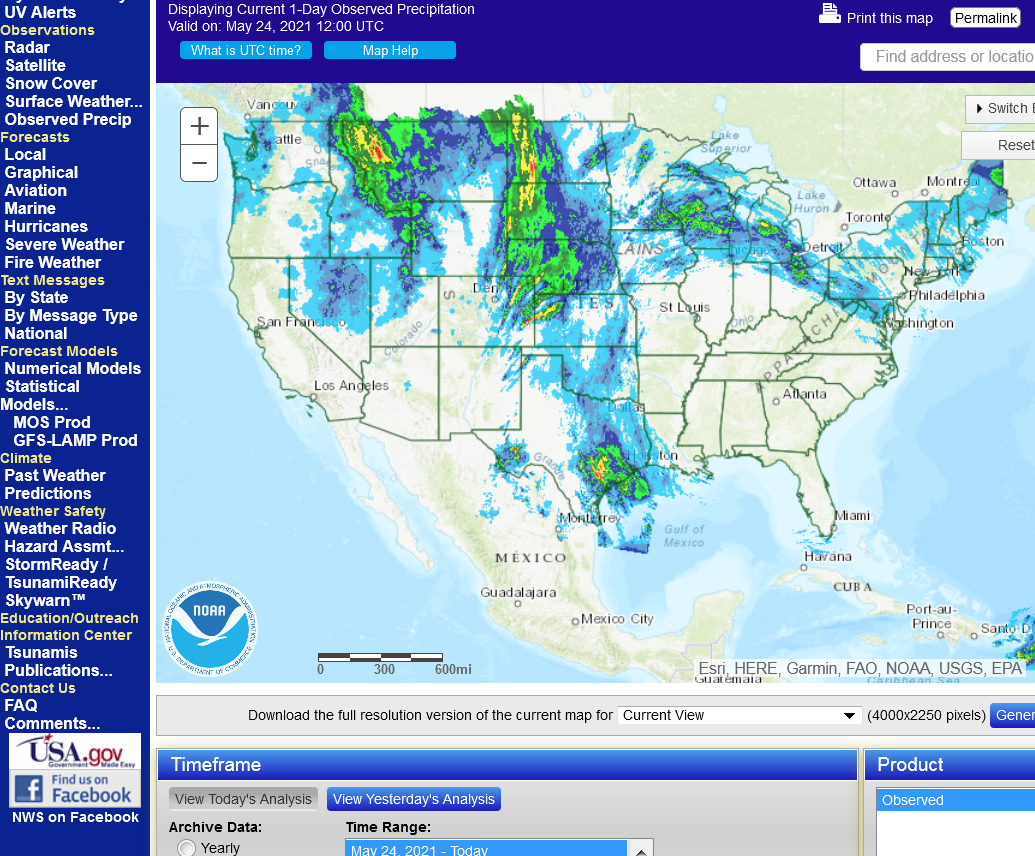
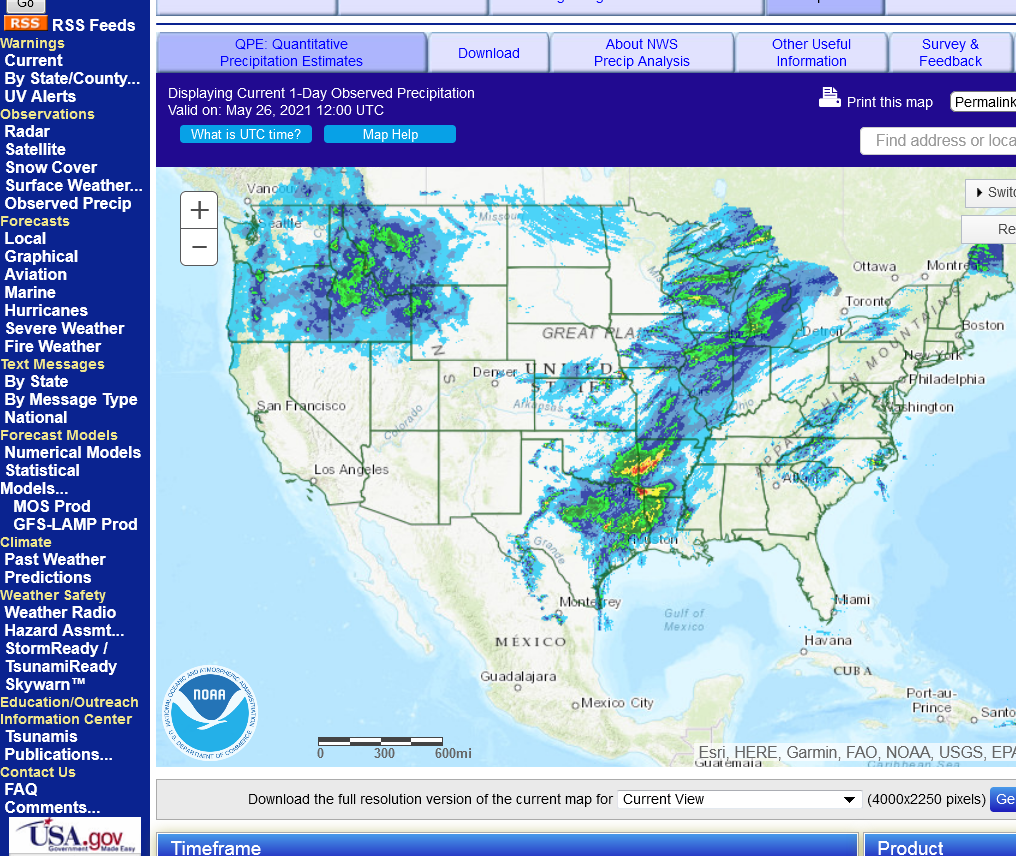
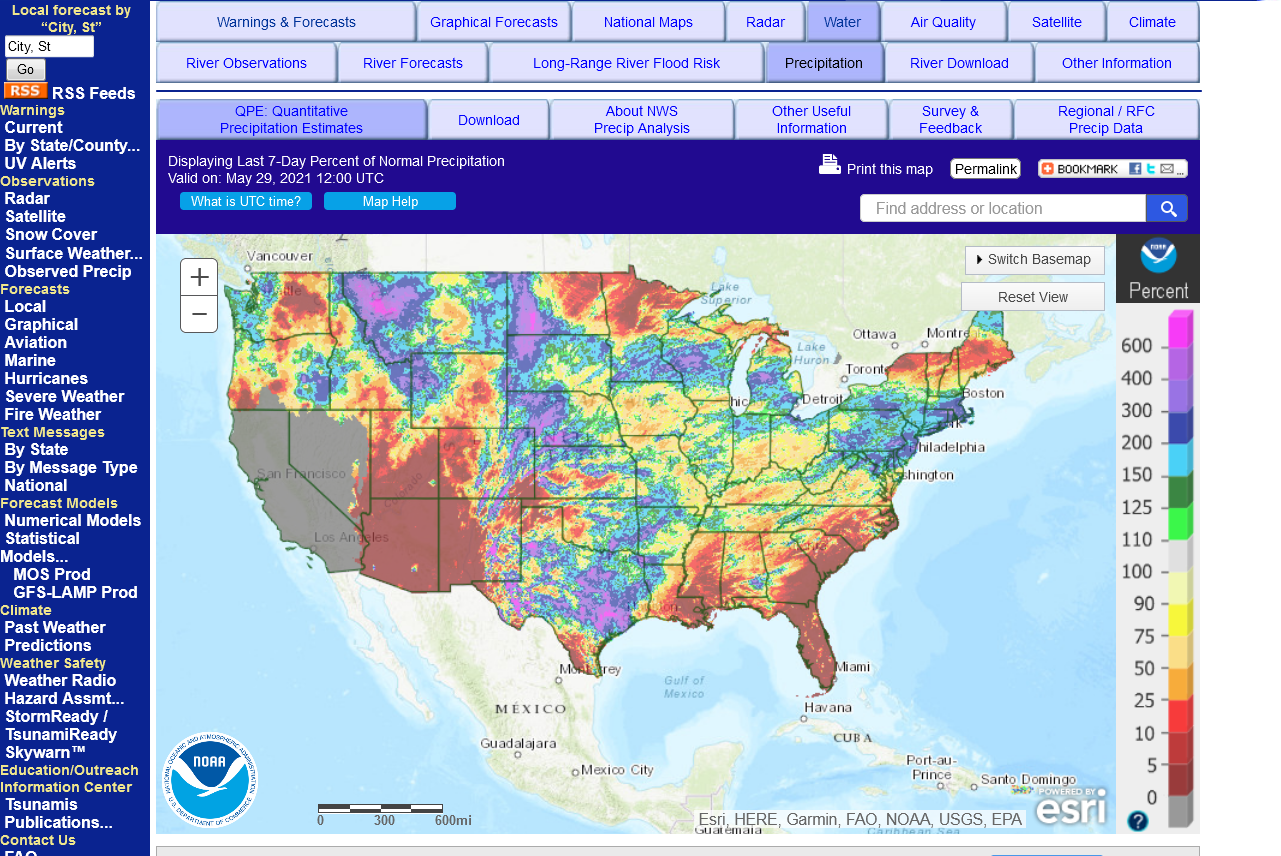
You can go to this link to see precipitation totals from recent time periods:
https://water.weather.gov/precip/
Go to precipitation, then scroll down to pick a time frame. Hit states to get the borders to see locations better. Under products, you can hit "observed" or "Percent of normal"
Good site with data:
As mentioned yesterday at the top. The ECB does not get much rain the next several days with a heat ridge cranking temps up to 90 and drying it out. ND also has less rain on some models, especially the European model. GFS still has good rain there.
The Western and Central belt should get lots of welcome rain.
Western to Central Midwest to get nice rains.....ECB waits on rain with heat ridge into early next week. ND amounts going back and forth but still the most rain in a year(which isnt saying much)
Most of the maps above are updated.
I'm on the verge of getting the sprinkler out for parts of my front yard.
Thanks Jim,
Could be some decent rains later this week for you.
Most places have decent rains with the central belt possibly getting a ton....followed by non threatening weather.
With most of the crop planted rain continues to be bearish.
Corn gapped lowed on the open tonight.
Is it a downside break away gap?
Maybe....if the weather stays bearish. However, CZ has dropped $1 already in the last 2 weeks.
If the weather turns bullish, it will be an selling exhaustion gap when it gets filled......a gap and crap technical formation on the charts.
After this rain event ends tonight in ND, the Minn wheat has a chance to bounce higher if the amounts are disappointing and rains get taken out of the forecast.
Rains were huge for parts of ND last night. Mainly in a north to south band across the western 1/3 towards central. This and more rains in the extended is crushing Minn wheat today. Rains ending Monday morning below:
24 hour Rains ending Tuesday morning below.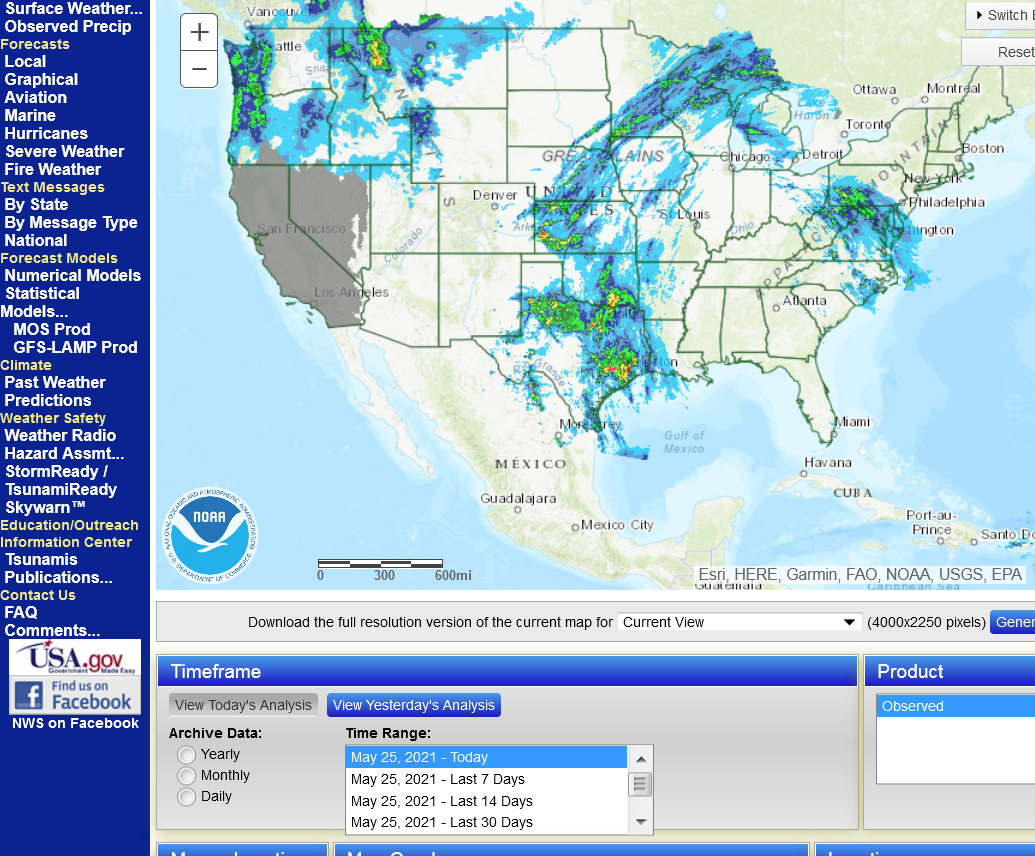
24 hour rains ending Wednesday morning below:
Rains continue to increase in the week 1 forecast. Now we have the threat of excessive rains for the c and s plains into parts of the w,s. And c corn belt. The e corn belt gets the least but still potentially good rains. Scroll up for the amounts and threat.
The fact that dew points are only in the 60s and not 70s should help to keep amounts from getting too excessive outside of isolated areas.
scroll up for the updates.
This will help to restore soil moisture in some of the dry areas.
Here is a reminder of why 2012 is NOT a good analog year for 2021.
Massive belt wide rains continue on the 12z GFS ensemble.
There is a much higher threat for excessive rains in a few spots than the non existent threat of it turning drier.
Below was the solution for rains the next 2 weeks from this evening's GFS ensemble.
You won't find this much widespread rain of 2"+ everywhere except the Northern Plains too often in late May/Early June. Especially with planting waaay ahead of average.
If we had planting delays, this map would be extremely bullish. With corn 90% planted vs 80% average and beans 75% planted vs 54% average, this is a rain makes grain weather forecast. For the new crop that is.
Scroll up for all the updated weather maps
Wednesday morning:
Potential heat ridge developing towards the end of 2 weeks on recent models.
-PNA (crashing lower) gives me some confidence that this will happen.....which means a trough in the Pac NW that pumps up a heat ridge downstream.
GFS ensembles below from the oz run at the end of 2 weeks.
Tons of rain before then however and a rain event in the dry areas of the ECB is very welcome...with more to come. Scroll up for the radar image and rain forecasts.
So the way that the weather shapes up with a heat ridge like this will depend on its location.
Directly underneath and surrounding the heat ridge for several hundred miles will be HOT and DRY weather.
Then, around the periphery of that zone is often some very heavy rains, potentially excessive rains............depending on the set up.
The Great MISS River flooding of 1993, for instance was caused by a blocking heat ridge in the Eastern Cornbelt to East Coast.
A heat ridge east of the MS River, especially to the East Coast will feature tons of rain in the Plains and Western belt.
If its far enough east, the entire Cornbelt can be wet.
The farther west the heat ridge, the drier the Cornbelt gets.
Sometimes you can have the heat ridge, instead of being developed as described above can be located in the North/South direction and controlling rains based on latitude instead of longitude(West to East).
A heat ridge across the Gulf States and Deep south can cause a flash drought to quickly develop down there but a strong jet stream coming from the Pacific and traveling over the top of the ridge(which often happens with a -PNA) can cause numerous waves that trigger rounds of heavy rain producing rains over the same areas around the periphery of the "dome'........just to the north of it..............in the Midwest, where the air is juicy from the heat ridge and southerly winds drawing moisture from the Gulf northward and the energy from the jet stream can take advantage of that environment.
Long lived heat ridges are almost always bullish, sometimes even if you are under the heavy rains.
They represent/cause a blocked pattern, vs a progressive one. Everybody just keeps getting the same weather which ends up being too much of whatever that is......whether its hot/dry or wet weather.
A heat ridge for several days thats transient is more bearish though. When it moves out, the weather normalizes and the dry places usually get a good shot of rain as that happens and the wet places then dry out.
No way to know how long this one might last or where it might be or even if its going to be well developed or not.
A heat ridge, regardless of the amount of rain, is almost always BULLISH for natural gas if its anywhere in the Eastern half of the country during the cooling season.
It's early yet, there are at least a couple more weather scares to keep prices active. I eagerly look forward to your prognostications. :)
Thanks!
This could be more of an Upper Midwest/Northern tier centered heat ridge too and there would be no GOM moisture very far north...............also possibly just transient.
Much of it will depend on the trough in the Pac NW and the PNA index.
Freeze watch for ND/SD tonight:
Heat ridge building at the end of week 1 and strengthening in week 2 continues to be bullish the grains..............after it reversed us higher yesterday earlier this week.
As long as we have the PNA plunging much lower, I have high confidence that it will pump up a heat ridge in the middle or eastern US.
https://www.cpc.ncep.noaa.gov/products/precip/CWlink/pna/pna.shtml
Total Rains the past 7 days. Northeast half of ND/N.MN not much for HRS crop. IA was a bit light.
See 2nd map to note the driest areas :
https://water.weather.gov/precip/
![]()
Southeastern to Eastern 1/3 of the Cornbelt is wet/bearish.
Northwestern 2/3rds is mostly dry....buliish.
Very warm most places............HOT N.Plains.
Scroll up for updates maps.
A bit of scat light rain for ND in the forecast took the mn wheat off of its highs.
These are the areas with the risk of excessive heat, days 3-15:
https://www.wpc.ncep.noaa.gov/threats/threats.php
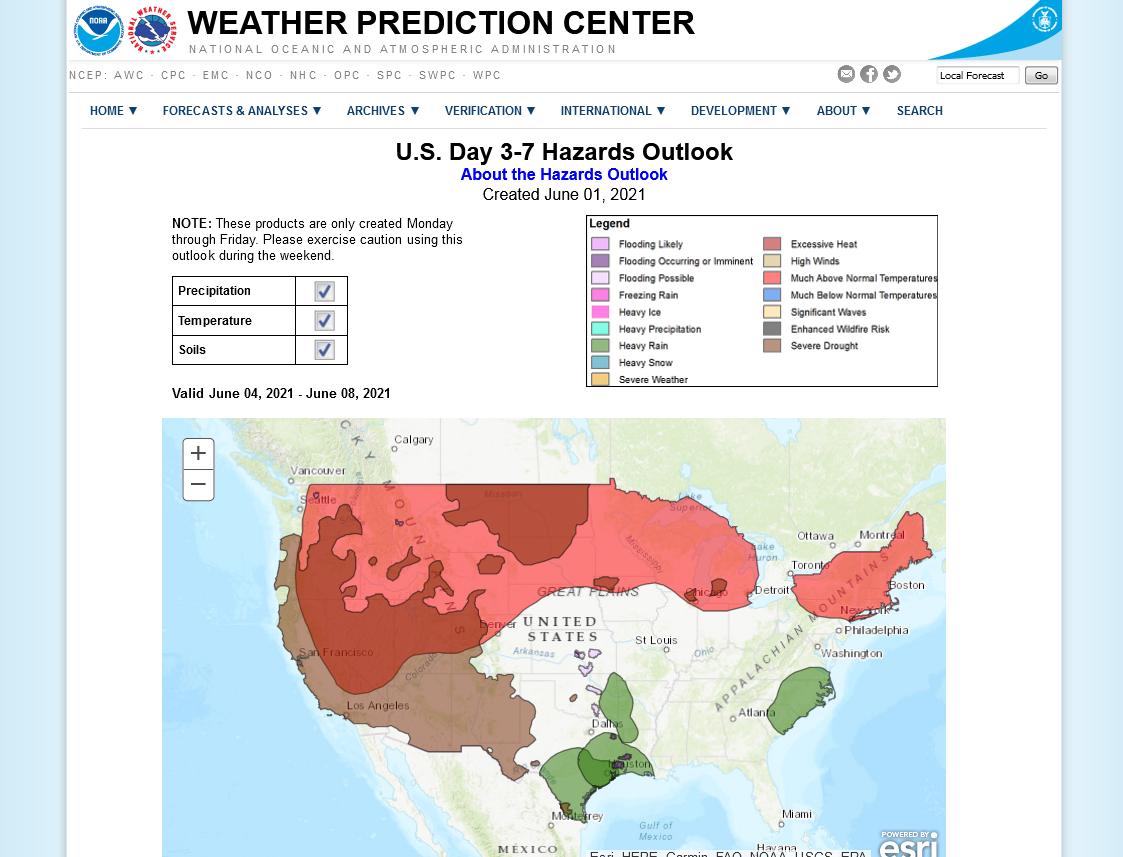
https://www.cpc.ncep.noaa.gov/products/predictions/threats/temp_probhazards_d8_14_contours.png


