Marco came in with less intensity than was predictred on the models. Shut in production drove the price up well yesterday. Drawing back a little today.
However, Laura is already officially classified as a hurricane. And scheduled to make landfall thursday am on the Louisianna coast. This will have an even greater effect on gas rigs and production than Marco did, thereby more shutin production. This will bring another bullish move.
I don't think the storage report is going to have much sway in the market. I expect it to be lower than last week. So maybe a little influence.
Thanks Mark!
Laura predicted to become a MAJOR hurricane now. Shut ins may not be that much more because of the higher intensity, however the risk for structural damage to the platforms in the Gulf goes up when wind speed get up there above 110 mph(for sustained winds).
They are at 115, now which is a cat. 3 hurricane!
From NGI earlier today:
Markets
Natural gas futures hovered close to even early Tuesday as traders monitored the strengthening Hurricane Laura, which was threatening both supply and demand as it churned toward the Gulf Coast. The September Nymex contract was up 1.9 cents to $2.532/MMBtu at around 8:45 a.m. ET. At 8:15 a.m. ET Tuesday, the National Hurricane Center reported…
August 25, 2020
metmike: The September contract expires on Thursday.
Wow, what a ride this am! But I guess we have dialed in all the hurricane points we are going to get.
If tomorrow's storage report comes in less than last week, it would be slightly bullish. If the same, then neutral to bearish. Gonna be some touchy riding.
October is still just barely above the May 5, spike high of 2.588....after testing the highs of the previous 2 days......2.654.
Several unusual factors here all at the same time.
1. Hurricane Laura
https://www.marketforum.com/forum/topic/57763/
2. Sept contract expiration tomorrow(along with the EIA weekly storage report).
3. Uncertainty on how expansive the heat ridge in the Southeast will be going forward.
4. Technical, massive upside break out earlier this month but we are at major resistance and have come a very long way very fast.
5. Lowest rig count in history for much of the Summer...........is cutting back on the supply glut that was foreseen earlier in the Summer.
6. Exports? They are down but will that pick up?
NGI Wednesday Morning:
Amid a number of “variables in play” in the natural gas market early Wednesday, most notably the imminent threat of Hurricane Laura bearing down on Texas and Louisiana, prices strengthened in early trading. The September Nymex contract climbed 4.5 cents to $2.534/MMBtu at around 8:40 a.m. ET. As of 8 a.m. ET Laura was 280…
August 26, 2020
Weather Wednesday: https://www.marketforum.com/forum/topic/58165/
After the close Wed.......NGI:
With a Category 4 hurricane targeting natural gas export facilities and other energy infrastructure on the Gulf Coast, gas traders struggled with where to price September futures Wednesday. After some back and forth within a 10-cent range, the September Nymex contract settled 2.8 cents lower at $2.461. October slipped 2.2 cents to $2.574. Spot gas…
August 26, 2020
I find it interestiing that prices fell all afternoon with an intense hurricane coming in. I had traded overnight, and after 3 trades that netted nearly $1000, I was ready to get off the puter before lunch. I know we have an excess in storage. And exports are down, per the EIA report. Could it be that most of the gas wells in the path of the hurricane are already offline? So there is no real threat?
BTW. Interesting action in the otherwise quiet nigh markets already. Hhhmmm...
Thanks Mark.... Congrats on your trading!
Thursday early from Natural Gas Intelligence:
Natural gas traders had a veritable maelstrom of factors to consider as they plotted potential price moves early Thursday, including a major storm crashing into the Gulf Coast, updated government inventory data and looming front-month expiration. As of around 8:40 a.m. ET, the expiring September Nymex contract was trading 4.7 cents higher at $2.508/MMBtu. October…
+++++++++++++++++++++++++++++++
The U.S. Energy Information Administration (EIA) reported a 45 Bcf injection into natural gas storage inventories for the week ending Aug. 21, a figure that was right in line with consensus but below the year-ago and five-year average builds. September Nymex gas futures, trading more than 12 cents higher ahead of expiration later Thursday at…
August 27, 2020
![]()
for week ending August 21, 2020 | Released: August 27, 2020 at 10:30 a.m. | Next Release: September 3, 2020
+45BCF Nuetral to slightly bullish
| Working gas in underground storage, Lower 48 states Summary text CSV JSN | |||||||||||||||||||||||||
|---|---|---|---|---|---|---|---|---|---|---|---|---|---|---|---|---|---|---|---|---|---|---|---|---|---|
| Historical Comparisons | |||||||||||||||||||||||||
| Stocks billion cubic feet (Bcf) | Year ago (08/21/19) | 5-year average (2015-19) | |||||||||||||||||||||||
| Region | 08/21/20 | 08/14/20 | net change | implied flow | Bcf | % change | Bcf | % change | |||||||||||||||||
| East | 775 | 750 | 25 | 25 | 676 | 14.6 | 709 | 9.3 | |||||||||||||||||
| Midwest | 904 | 880 | 24 | 24 | 781 | 15.7 | 783 | 15.5 | |||||||||||||||||
| Mountain | 212 | 209 | 3 | 3 | 172 | 23.3 | 187 | 13.4 | |||||||||||||||||
| Pacific | 306 | 313 | -7 | -7 | 277 | 10.5 | 294 | 4.1 | |||||||||||||||||
| South Central | 1,223 | 1,223 | 0 | 0 | 934 | 30.9 | 1,009 | 21.2 | |||||||||||||||||
| Salt | 334 | 335 | -1 | -1 | 201 | 66.2 | 247 | 35.2 | |||||||||||||||||
| Nonsalt | 889 | 888 | 1 | 1 | 734 | 21.1 | 762 | 16.7 | |||||||||||||||||
| Total | 3,420 | 3,375 | 45 | 45 | 2,840 | 20.4 | 2,982 | 14.7 | |||||||||||||||||
Totals may not equal sum of components because of independent rounding. | |||||||||||||||||||||||||
Working gas in storage was 3,420 Bcf as of Friday, August 21, 2020, according to EIA estimates. This represents a net increase of 45 Bcf from the previous week. Stocks were 580 Bcf higher than last year at this time and 438 Bcf above the five-year average of 2,982 Bcf. At 3,420 Bcf, total working gas is above the five-year historical range.
For information on sampling error in this report, see Estimated Measures of Sampling Variability table below.

Note: The shaded area indicates the range between the historical minimum and maximum values for the weekly series from 2015 through 2019. The dashed vertical lines indicate current and year-ago weekly periods.
https://www.investing.com/economic-calendar/natural-gas-storage-386
Latest Release Aug 27, 2020 Actual 45B Forecast 47B Previous 43B
| Release Date | Time | Actual | Forecast | Previous | |
|---|---|---|---|---|---|
| Aug 27, 2020 | 10:30 | 45B | 47B | 43B | |
| Aug 20, 2020 | 10:30 | 43B | 43B | 58B | |
| Aug 13, 2020 | 10:30 | 58B | 57B | 33B | |
| Aug 06, 2020 | 10:30 | 33B | 30B | 26B | |
| Jul 30, 2020 | 10:30 | 26B | 26B | 26B | |
| Jul 23, 2020 | 10:30 | 37B | 36B | 45B |
7 day temps last week that were used for this reporting period. HOT west/mild to cool East.
NGI Friday early:
Natural gas futures were trading slightly lower early Friday as energy operators were in the process of assessing damages and resuming normal activities in the aftermath of Hurricane Laura. After surging 13.6 cents in the previous day’s trading, the October Nymex contract was down 1.7 cents to $2.693/MMBtu at around 8:45 a.m. ET. Laura had…
August 28, 2020
metmike: Very volatile. Turning cooler and cooler in the extended...........BEARISH WEATHER!
And with close to a million people without power reduces the need for NG as well.
This is true Jim!
NGI after the close Friday:
Natural gas futures, fresh off a massive 12-cent climb, retreated a bit Friday as Hurricane Laura’s destruction slowly came into focus. Aided by a cooler weather outlook over the coming weeks, the October Nymex gas futures contract fell 5.3 cents to $2.657. November lost 2.7 cents to hit $2.916. Spot gas prices also were lower…
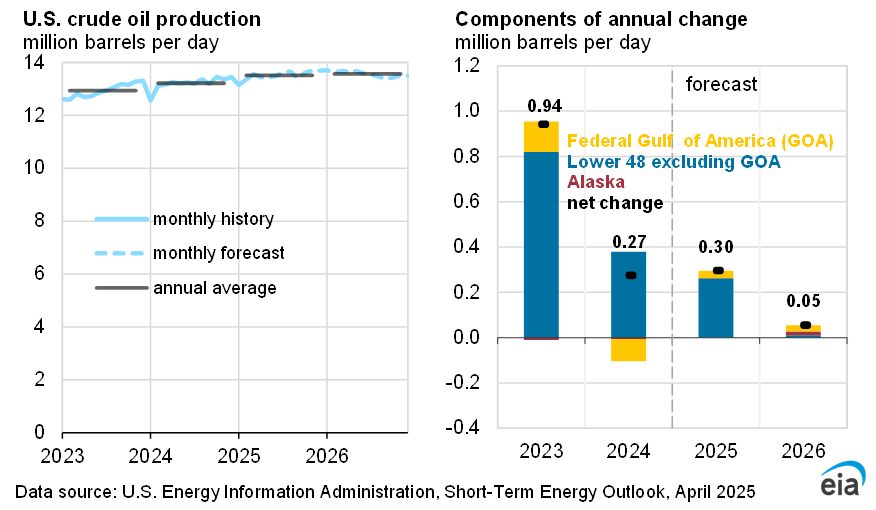
HOUSTON (Reuters) - U.S. energy companies on Saturday continued to restaff offshore oil and gas production facilities in the U.S. Gulf of Mexico, according to data released by the U.S. Department of Interior.
There were 122 facilities that were reoccupied as of midday, the data showed. Crude oil production was off 82%, or 1.5 million barrels per day (bpd) and natural gas production was down 59%, or 1.6 billion cubic feet per day. (tinyurl.com/yyzyvb3f)
There were 189 platforms or drilling rigs in the U.S. Gulf of Mexico that remain unmanned on Saturday, the department said, down from 310 unoccupied facilities on Wednesday.
U.S. Gulf of Mexico offshore wells account for 17% of total U.S. crude oil production and 5% of total U.S. natural gas production.
Hurricane Laura shut six coastal refineries this week accounting for about 12% of U.S. oil processing capacity. Those without significant damage have taken steps to restart operations.
metmike: The wildcard would be if there are any reports of significant damage that took some facilities offline for several months.
Laura was pretty strong when passing over some of these locations, so its possible.
Weather Sunday. Mildly Bearish weather but a couple of other factors bullish.
Last weeks temps featured major heat in the Midwest!
Some of that heat........... all the way to the East Coast. The EIA report this Thursday will be a smallish/bullish number. Also, there was some shut in production in the GOM to cause the number to be even lower.
This is history and the conditions are known and were dialed in with last weeks rally but we can still speculate on how bullish the number might be ahead of it.
NG opened modestly lower from coolish weather maps, tested the lows of Friday when we dropped to 2.622 in the first minute, 1 tick off that Fri low but that held solidly and we have been creeping higher ever since, now on the highs at 2.648,
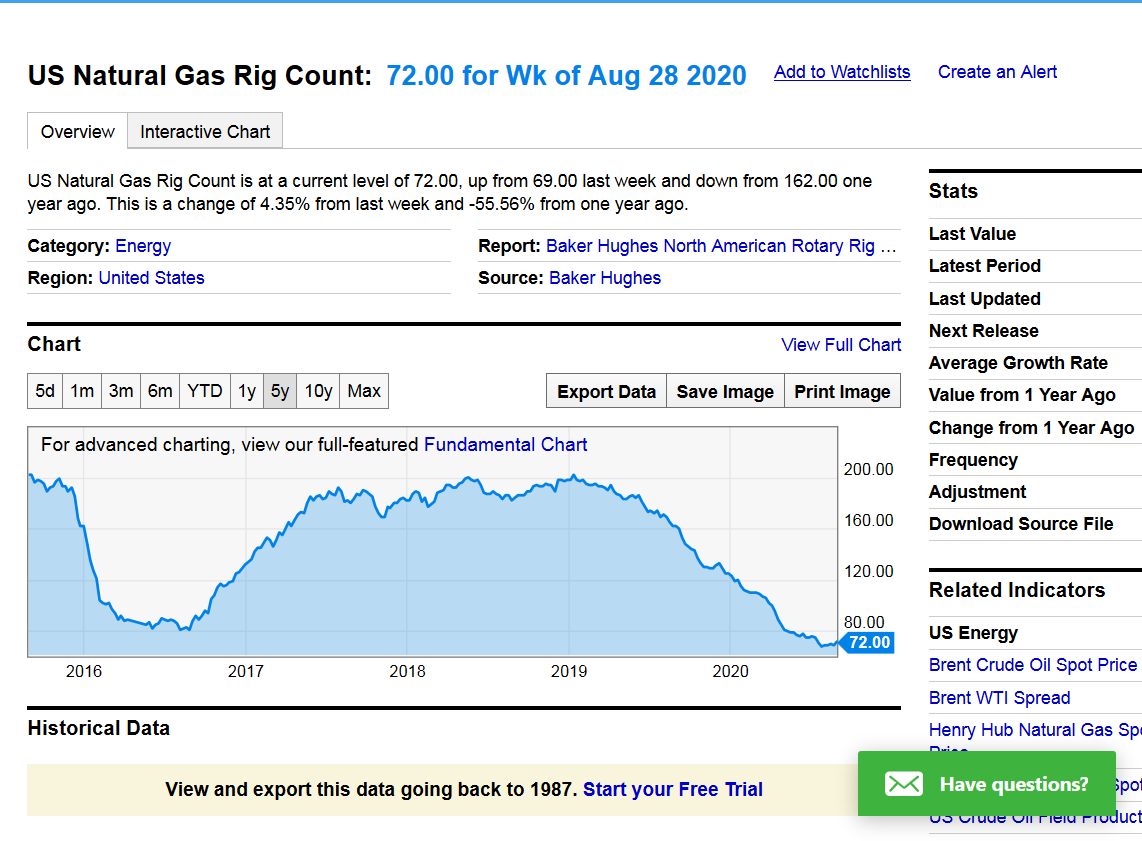
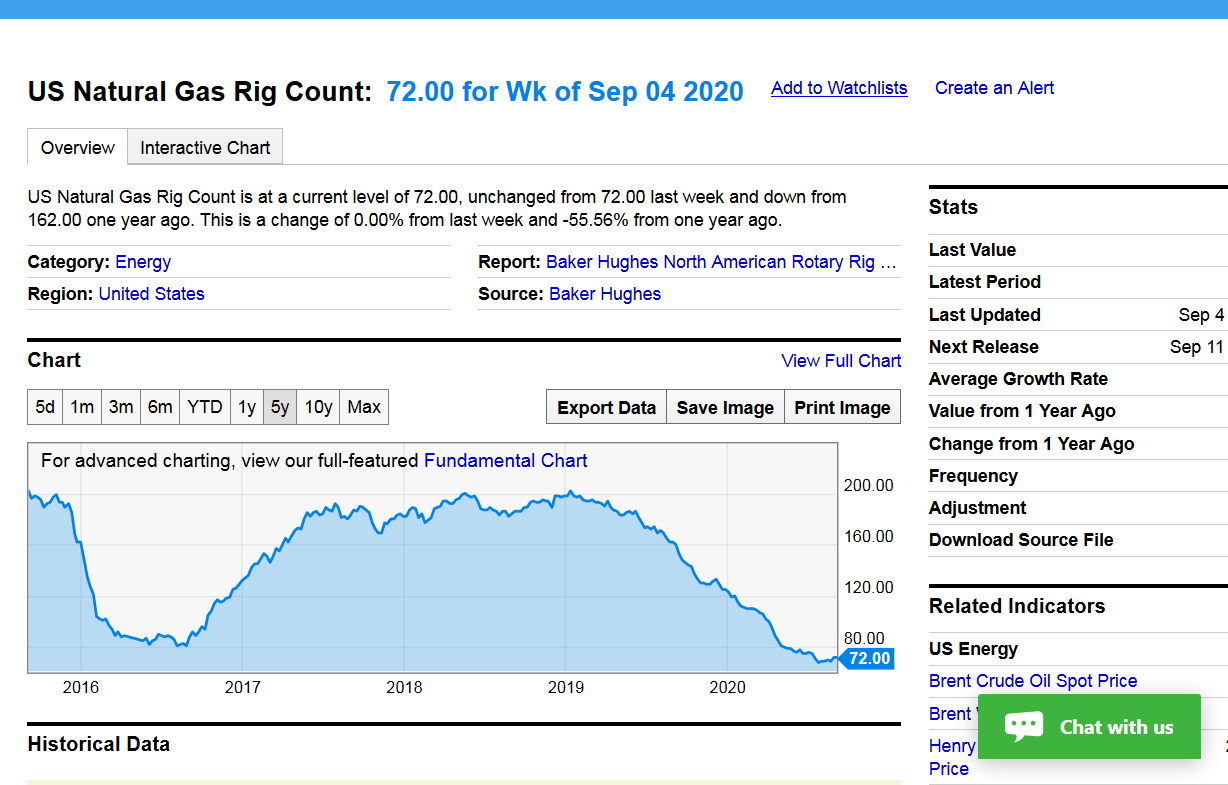
Natural gas rig count is starting to climb a bit higher from the low point of 68 back in late July.
72 is still pretty low though and below the previous record low of 81, set 4 years ago.
https://ycharts.com/indicators/us_gas_rotary_rigs
There are 2 natural gas seasonal graphs below.
The top one is very updated....1999-2019. The one below that is thru 10 years ago, 1991-2009.
They are almost identical thru early August............then really deviate tremendously!
What are some things we might learn from this? I would appreciate Larry and others chiming in with views.
1. Spring is an extraordinarily strong time frame for NG prices.......always has been. Something like 19 out of 20 years up for some embedded time frames.
2. Despite it being so dependable, in 2020 COVID caused the opposite to happen in unprecedented fashion.
3. Late June, thru July is the weakest period of the year historically. We started that period this year, with near record heat and CDD's being added to the weather forecast making it MORE bullish than the seasonal pressure.
4. That support gave way in early/mid July with the heat dialed in and the forecasts cooling off.
5. The August seasonal has apparently changed in the last 10 years. Used to be very weak and a continuation of the weak July(maybe it was hurricane premium coming out, when most of the production was coming from the Gulf). The more recent seasonal is nuetral for August.
6. Then, we have both graphs lining up together with Sept and Oct being very strong months historically.
7. Then, we have huge divergence which is very surprising to me based on what I "thought" which might be a bias.
I always remember November as being my most profitable month in the 1990's and it was always picking the October high and being short in November. I remember lots of Halloweens, trick or treating with the kids and having an especially fun time checking price quotes on the short positions. However, we had some very mild Novembers in the late 1990's too. ...so it makes sense.2 The 2009 seasonal shows that. However, the 2019 seasonal shows the complete opposite. The biggest difference of the year between these 2 graphs. November from the 2019 graph actually has the greatest % increase of any month. WOW!
Before commenting more, I will still need to look at HDD data for November to see if the Novembers from 2010-2019 were that much colder than the Novembers from 1991-1999 that they replaced on the 20 year chart. Memory tells me yes. Recent Halloweens for me......now trick or treating with the GRAND kids have featured everybody bundled up. Last Thanksgiving featured some major cold.
https://charts.equityclock.com/natural-gas-futures-ng-seasonal-chart
2000-2019 seasonal below

http://www.equityclock.com/charts/natural-gas-futures-ng-seasonal-chart/
 Seasonal Chart")
The above chart represents the seasonality for Natural Gas Futures (NG) Continuous Contract for the past 19 years.
Any comments are appreciated.
metmike: Note below, that production drops more than consumption in the forecast.
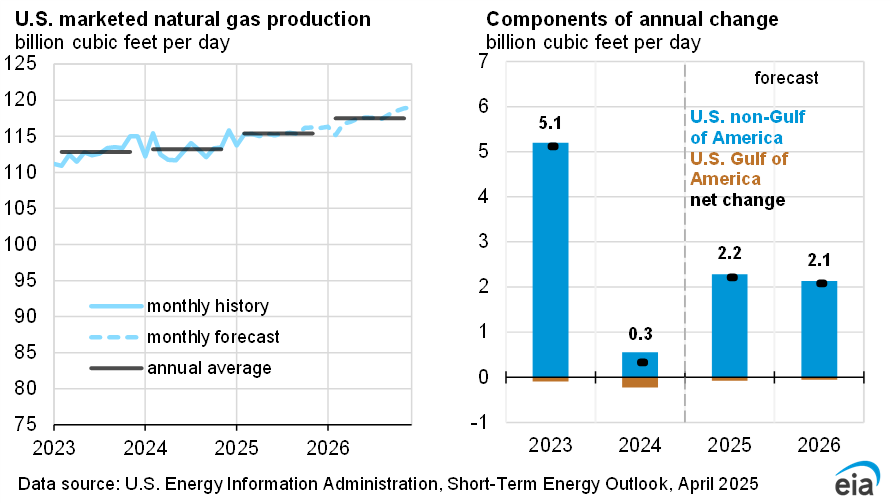
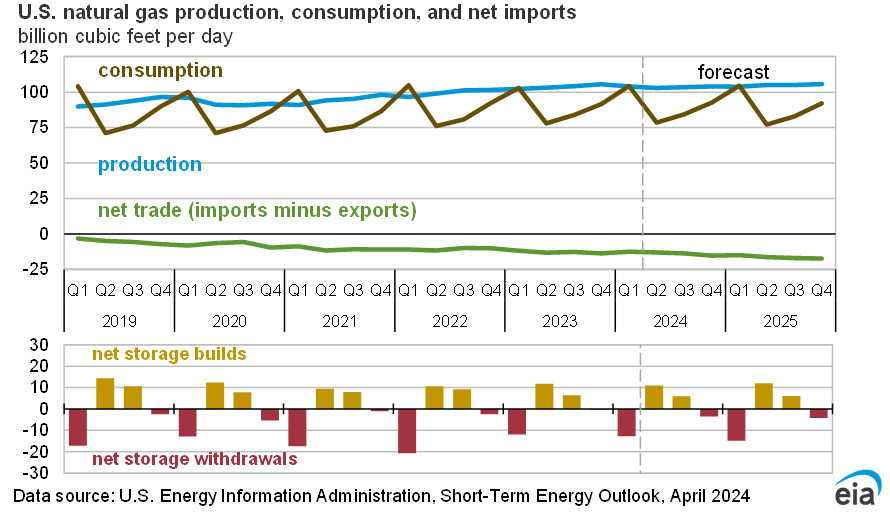
Continued higher prices are expected.
https://www.eia.gov/outlooks/steo/index.php
"U.S. dry natural gas production set an annual record in 2019, averaging 92.2 Bcf/d. EIA forecasts dry natural gas production will average 88.7 Bcf/d in 2020, with monthly production falling from its monthly average peak of 96.2 Bcf/d in November 2019 to 82.7 Bcf/d by April 2021, before increasing slightly."
This prediction would have been before the covid hit, officially. Now, how could they have known this?
Not sure what you are saying Mark.
However, the rig count dropping is contributing to this big production drop ahead.
The rig count is up 3 from last week. This means more production. More gas injected into the reserve.
As analyst estimates showed liquefied natural gas (LNG) demand continuing to sag in the aftermath of former Hurricane Laura, gas futures were down sharply in early trading Monday. The October Nymex contract was off 7.8 cents to $2.579/MMBtu at around 8:45 a.m. ET. Estimates from Genscape Inc. put interstate pipeline flows to U.S. LNG export…
August 31, 2020-NGI AM
What initially appeared to be a substantial retracement for natural gas futures ultimately turned out to be a much smaller pullback to start the week. After bouncing off a $2.497/MMBtu intraday low, the October Nymex gas futures contract settled Monday at $2.630, off only 2.7 cents from Friday’s close. November finished four-tenths of a cent… .NGI after the close on Monday.
metmike: After being down by over $1,500/contract early this morning, ng battled back to only slight losses. This evening, we actually traded above the close from Friday.
The very cool weather coming up was probably dialed in Friday and early Monday.
That cool pattern could be transient will the late week 2 solutions looking to heat things up again........with a big heat ridge building.
The 18z GFS ensemble was very impressive. This is the 360 hour/14 day solution below.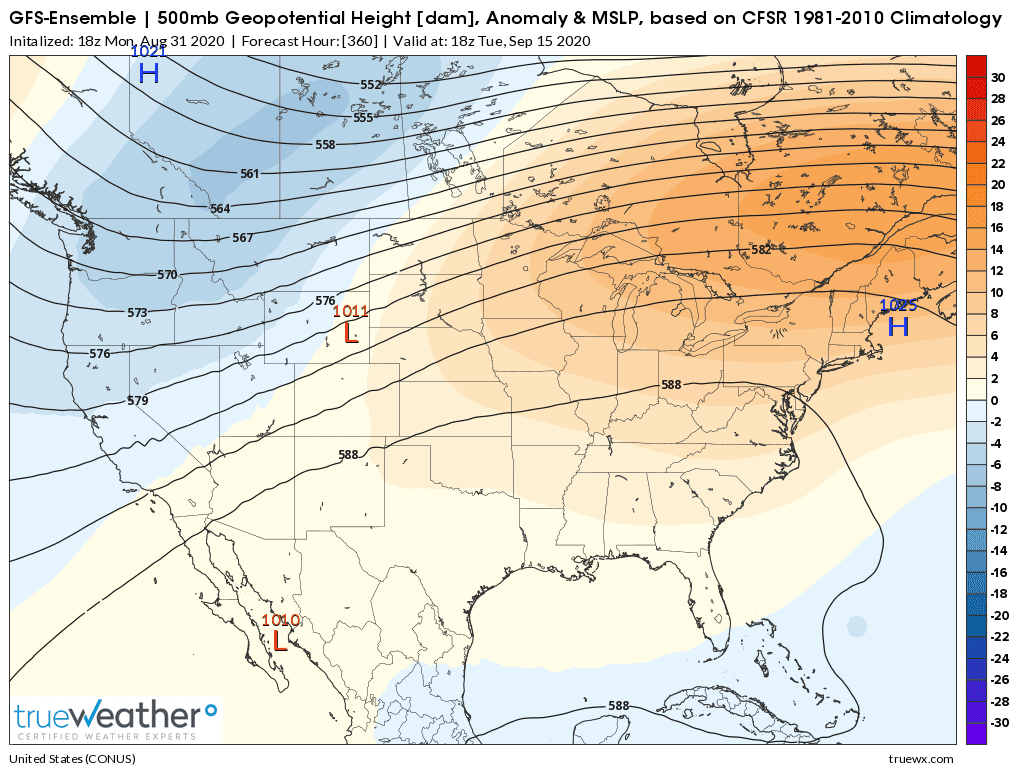
NGI Tuesday Morning:
Markets
With lingering uncertainty over how quickly liquefied natural gas (LNG) demand will recover following Hurricane Laura, gas futures were trading several cents lower early Tuesday. The October Nymex contract was down 7.0 cents to $2.560/MMBtu at around 8:45 a.m. ET. The October contract fell to as low as $2.497 in Monday’s session amid signs of…
September 1, 2020
Terrific Tuesday To You: Here's your weather: https://www.marketforum.com/forum/topic/58508/
Bearish for natural gas.
NGI after the close Tuesday:
After another day of low liquefied natural gas (LNG) demand, natural gas futures buckled in a big way Tuesday as the continuation of weak exports and cool September outlook pressured the market. The October Nymex gas futures contract dropped 10.3 cents to settle at $2.527. November fell a much more modest 1.9 cents to $2.901.…
September 1, 2020
Let it drop! Makes it easier to take a long January contract.
Are you hoping for a brutally cold fall? Seems January is already quite expensive.
Expecting a fairly mild winter. And you are right. January is way overpriced.
NGI after the close Wed:
Natural gas futures waffled between gains and losses on Wednesday as Hurricane Laura’s destruction and still anemic U.S. liquefied natural gas (LNG) exports continued to weigh on markets. After falling more than 8 cents early, the prompt month climbed back into positive territory before midday following estimates for a modest storage build that could ease…
September 2, 2020
The U.S. Energy Information Administration (EIA) on Thursday reported an injection of 35 Bcf into storage for the week ending August 28. The result came in roughly on par with median estimates and nudged Nymex natural gas futures higher. The latest injection was bullish relative to a year earlier, when EIA reported a 77 Bcf…
September 3, 2020
metmike: ng was already slightly higher and got a small bounce shortly after the number for 30 minutes. Now we are just below the pre report level. Temps coming up will be very cool/bearish but models are a great amount of disagreement and change from their preview runs.
Some of the GFS solutions overnight came out much warmer, the European models cooler. ........for the same run.
![]()
for week ending August 28, 2020 | Released: September 3, 2020 at 10:30 a.m. | Next Release: September 10, 2020
+35 BCF Neutral
| Working gas in underground storage, Lower 48 states Summary text CSV JSN | |||||||||||||||||||||||||
|---|---|---|---|---|---|---|---|---|---|---|---|---|---|---|---|---|---|---|---|---|---|---|---|---|---|
| Historical Comparisons | |||||||||||||||||||||||||
| Stocks billion cubic feet (Bcf) | Year ago (08/28/19) | 5-year average (2015-19) | |||||||||||||||||||||||
| Region | 08/28/20 | 08/21/20 | net change | implied flow | Bcf | % change | Bcf | % change | |||||||||||||||||
| East | 789 | 775 | 14 | 14 | 705 | 11.9 | 734 | 7.5 | |||||||||||||||||
| Midwest | 924 | 904 | 20 | 20 | 816 | 13.2 | 817 | 13.1 | |||||||||||||||||
| Mountain | 212 | 212 | 0 | 0 | 176 | 20.5 | 190 | 11.6 | |||||||||||||||||
| Pacific | 304 | 306 | -2 | -2 | 277 | 9.7 | 295 | 3.1 | |||||||||||||||||
| South Central | 1,225 | 1,223 | 2 | 2 | 943 | 29.9 | 1,013 | 20.9 | |||||||||||||||||
| Salt | 331 | 334 | -3 | -3 | 198 | 67.2 | 244 | 35.7 | |||||||||||||||||
| Nonsalt | 895 | 889 | 6 | 6 | 745 | 20.1 | 768 | 16.5 | |||||||||||||||||
| Total | 3,455 | 3,420 | 35 | 35 | 2,917 | 18.4 | 3,048 | 13.4 | |||||||||||||||||
Totals may not equal sum of components because of independent rounding. | |||||||||||||||||||||||||
Working gas in storage was 3,455 Bcf as of Friday, August 28, 2020, according to EIA estimates. This represents a net increase of 35 Bcf from the previous week. Stocks were 538 Bcf higher than last year at this time and 407 Bcf above the five-year average of 3,048 Bcf. At 3,455 Bcf, total working gas is above the five-year historical range.
For information on sampling error in this report, see Estimated Measures of Sampling Variability table below.
Note: The shaded area indicates the range between the historical minimum and maximum values for the weekly series from 2015 through 2019. The dashed vertical lines indicate current and year-ago weekly periods.
https://www.investing.com/economic-calendar/natural-gas-storage-386
Latest Release Sep 03, 2020 Actual35B Forecast34B Previous45B
U.S. Natural Gas Storage
| Release Date | Time | Actual | Forecast | Previous | |
|---|---|---|---|---|---|
| Sep 10, 2020 | 10:30 | 35B | |||
| Sep 03, 2020 | 10:30 | 35B | 34B | 45B | |
| Aug 27, 2020 | 10:30 | 45B | 47B | 43B | |
| Aug 20, 2020 | 10:30 | 43B | 43B | 58B | |
| Aug 13, 2020 | 10:30 | 58B | 57B | 33B | |
| Aug 06, 2020 | 10:30 | 33B | 30B | 26B |
Weather Thursday...........cool period coming up, then warmer?
https://www.marketforum.com/forum/topic/58613/
“Warmer” in September is relative. The dog days are over for most of the country. NG is a bear market even if the seasonal is bullish. Storage is going to end well over 4 bcf. When they talk about potentially Not having enough storage it’s all bearish. Sell rally’s.
Natural gas futures broke even Thursday as markets looked past improved U.S. liquefied natural gas (LNG) export demand and a light storage report to the expected onset of fall weather, eased cooling demand and the likelihood of more robust stockpile injections in coming weeks. The October Nymex contract inched up one-tenth of a cent day/day…
Natural gas exports, hammered by Hurricane Laura only days after reaching levels not seen since pre-Covid-19, were at the forefront of a steep decline in October forward prices during the Aug. 27-Sept. 2 period. The rest of the forward curve fared better, however, as the potential for further production decreases and stronger global demand this…
September 4, 2020
Weather is not always the clear driver in ng prices, especially at the end of the cooling season and before the heating season.
However, bullish fundamentals kicking in, the lowest rig count ever the last few months, along with demand returning has featured underlying strength.
The bearish weather/cool temps coming up, appear to have only provided a bull flag(temporary drop in prices) on the price charts but if cool weather dominates during September and bigger injections result, it might try to offset that.
I would not be short if it turns hot again this month, even if it's September heat but thats just me.
The November and December 2020 contracts are setting 4 year highs in prices with this price move. The market is looking ahead. Prices making 4 year highs with a record low rig count and demand returning is NOT bearish.
Rig count still well below the previous record low set 4 years ago at 81.
https://ycharts.com/indicators/us_gas_rotary_rigs
Natural gas futures finished the trading week on a high note, despite festering concerns about lofty storage levels, moderating demand when fall weather moves in, and a slow recovery for U.S. liquefied natural gas (LNG) exports in the wake of Hurricane Laura. After trading in the red on Friday morning, the October Nymex contract rebounded…
September 4, 2020
This is a year like no other. What is traditional, is not being followed. And not just in the commodity market.
I'm just a daytrader. I read the fundamental news to try to understand the general leaning of the herd. My days end up with maybe $200 profit, or $1,000 profit. And sometimes a loss, if I pick the wrong direction. No matter. I will recover on the next day.
NG has been rather tumultuous the entire year. Historical seasonals have not applied since the declaration of the dangers of the virus. And still don't. Far out months are way overpriced. Near months are also. Especially with the amount of NG in storage. An abundant supply, with a low use and export, can only be bearish. but there's not much influence.
So one has to play it on the daily runs. Most days are worth $300-500. Report days can be $1,000+. Just let the market talk, and tell you which way to go.
I think the price spread of the from 3-4 months support what you are saying Mike. But I also know that if demand doesn’t show up, the correction in NG can be painful if you are leaning the wrong way.
If Jan contract gets to $4, any warm weather and it will plunge to $3 in heartbreaking fashion.
Thanks Jim,
If we look at the current supplies, they are at, to just above the top of the 5 year range. Based purely on that, one might think that prices should be at the bottom of the 5 year range................but its the complete opposite.
We are at 4 year highs for Nov/Dec right now. I haven't checked farther out.
A few months ago, the market price was actually not just below the 5 year price, it was the lowest price in 25 years, about the lowest in the trading history.
That's when the rig count was still dropping lower and demand had not yet returned. Back then, we were still trading todays bearish storage graph.
The market turned the corner though and is NOT trading today's absolute storage number any more. It will trade weekly number vs expectations but the market, as it always does is looking ahead.
Demand has been returning much faster than supplies(the rig count is still well below the previous record lows).
EIA numbers that were pretty bearish earlier in the Summer have been coming in lower than seasonal averages with us having a very warm Summer. Mostly in line with expectations based on the amount of CDD's but plenty of CDD's and enough to prevent what looked likely earlier this Summer, that we might run out of room for ng and top out well above 4 TCF.
In a situation like that, the cash price could really crash lower. If we have mild temps into November, that can still happen and we seem to have a tremendous amount of downside potential with this incredible rally.
Prices are up more than $10,000 from bottom to top for the NGV contract! In just over 2 months. That would be impressive if supplies were near the bottom of the 5 year average but near the top and staying near the top for current storage with such a powerful rally is probably unprecedented.
Of course prices were MUCH TOO LOW earlier this Summer but the market must really see bullish things ahead.
With that being the case, with the rig count not likely recovering back to where it was last Winter for some time, a very cold start to Winter could erode the surplus by a great deal in big hurry..............and the market sees exactly that which is why cold season ng prices now are above $3.
Seems crazy that NGF21 was trading at $3.4 on Friday..........with near record ng storage for this date.
Seasonals that were worthless in the Spring and early Summer because of COVID, causing the price to crash, even though historically, 95% of the time prices went up previously during that period...........show a typical top around the October time frame if you go from the chart of the old days above.
Tops in October were very frequent, when storage was topping out and lower prices were almost a sure thing when it was mild in November.
Early Sept, well into Oct however, is often seasonally very strong and all things being equal, historically is a bad time to be short for the past 3 decades.
If we were still at the prices of 2 months ago, this would be the ideal buying set up if expecting unusual late season heat.
But we are not. Bearish, very cool weather caused us to drop from the highs a couple of weeks ago but it was met with buying at support late last week, instead of more selling, so the market was saying it was still too early for the top to be confirmed. Such a strong rebound on Friday indicated to me that the big traders that pile on the shorts after a top(and cause waves of selling to new lows that quickly plunge us to lower and lower prices fast) is in were still buyers.
I agree with every word Mike....except the last part. I think the buying Friday was from the strong jobs report.
I didn't think about the jobs report influence. Good point Jim.
Sensational Sunday to you.
Here's your weather(added a few new maps and analysis today): https://www.marketforum.com/forum/topic/58744/
Models have turned warmer the last couple of runs, so I will guess a slightly higher open(vs the 4pm close).
It was a slightly higher open that was immediately sold and the price has been under some modest selling pressure with light volume very early on down just a bit.
Temps may be warmer(after the big cold snap in the center of the country this week) but they still are not that far from average(with the heat out West)
Lucky Labor Day to you! Here's your weather:
Monday Morning:
After rallying late last week on the prospect of recovering liquefied natural gas (LNG) demand, October gas futures lost ground in early trading Tuesday even as estimates showed the anticipated recovery in export activity coming to fruition. The October Nymex contract was down 3.9 cents to $2.549/MMBtu at around 8:45 a.m. ET. Total U.S. LNG…
September 8, 2020
metmike: NG collapsing lower today is not about the weather, other than the fact that the extended forecast does not have anomalous heat in it.............which is no different than the forecast on Friday, when prices were sharply higher.
Natural gas futures gave up ground on Tuesday as markets weighed a mixed weather outlook and new data pointing to both increased production and demand for U.S. liquefied natural gas (LNG) as the industry recovers from the impacts of Hurricane Laura. The October Nymex contract settled at $2.400/MMBtu, down 18.8 cents day/day. November declined 9.5…
September 8, 2020
metmike: I was interested in seeing what their explanation would be for the massive drop that ended the day at over a $2,000/contract loss for the Oct/front month.
It was NOT weather driven and September, coming after most of the cooling season is over and before the heating season has started is usually not a month when weather matters. (Last Sept featured long lasting record heat which was an exception to that).
I will guess that the recent rally just went way to far too fast ($10,000 in just 2 months) with supplies still just above the 5 year average(when supplies are very low, you can justify big moves but not when they are very high like they are now.
They market is looking ahead at much higher prices this Winter because of demand coming back and supplies dropping from the lowest rig count ever still but it got way ahead of itself, while supplies are still bulging and not being drawn down YET vs the 5 year average.
So traders kept piling on with the buying as technical indicators and trends pointing upwards added to the very bullish sentiment/outlooks for the next year and it got way overvalued and finally ran out of steam, at which point, today, after we dropped we starting violating some momentum and technical indicators/moving averages and the huge traders piled on in the same direction, with countless waves of selling all day(each save takes us to new lows, then we bounce back to just above the previous low and have another wave of selling to a new, new low, and repeat this a ton of times, as they often do in ng).
So the highs for the October, front month at 2.743 on August 28th are likely in. The last price/close was 2.383. Unless the EIA reports, the next 3 weeks are shockingly bullish.
The November on contracts were up to their highs last Friday and with some early season cold, could still surpass them but there is a decent chance, if the weather stays non bullish and the EIA reports are also non bullish, that the seasonal highs are in for the deferred contracts too.
Bullish EIA numbers and/or bullish weather/temps can turn that around.
The EIA projected dry gas production will drop to 89.88 billion cubic feet per day (bcfd) in 2020 and 86.59 bcfd in 2021 from the all-time high of 92.21 bcfd in 2019.
It also projected gas consumption would fall to 82.68 bcfd in 2020 and 79.14 bcfd in 2021, from a record 84.97 bcfd in 2019.
That would be the first annual decline in consumption since 2017 and the first time demand has fallen for two consecutive years since 2006.
EIA’s projections for 2020 in September were higher than its August forecasts of 88.65 bcfd for supply and 82.42 bcfd for demand.
The agency forecast U.S. liquefied natural gas exports would reach 6.27 bcfd in 2020 and 8.73 bcfd in 2021, up from a record 4.98 bcfd in 2019. That is higher than its August forecasts of 5.54 bcfd in 2020 and 7.28 bcfd in 2021.
U.S. coal production is expected to fall 28% to 511 million short tons in 2020, which would be its lowest level since 1964, before rising to 600 million short tons in 2021 when power plants are expected to burn more coal due to a forecast increase in gas prices, EIA said.
It projected carbon emissions from burning fossil fuels will fall to 4.618 billion tonnes in 2020, the lowest since 1986, from 5.130 billion tonnes in 2019, the lowest since 1992, before rising to 4.841 billion tonnes in 2021 as power generators burn more coal.
Markets
Natural gas futures wavered between gains and losses much of Wednesday before clawing out a modest gain as markets mulled positive export data against the prospects of cooler weather, a potentially bearish storage report and fall containment concerns. Coming off an 18.8-cent drop a day earlier, the October Nymex contract on Wednesday climbed six-tenths of…
September 9, 2020
Thursdays are my favorite day to trade NG.