Hi there November 3rd! Smile and say hello to some real people today. Then think about how lucky you are to be living in this era of plenty in human history!
Scroll down and enjoy the latest comprehensive weather to the max...... occurring because of the natural physical laws in our atmosphere as life on this greening planet continues to enjoy the best weather/climate in at least 1,000 years(the last time that it was this warm) with the added bonus of extra beneficial CO2.
Quiet but chilly weather now(colder changes from Friday have continued over the weekend). Detailed analysis today on weather indice page regarding negative AO.
Winter Weather Forecasts
https://www.wpc.ncep.noaa.gov/wwd/winter_wx.shtml
Here are the latest hazards across the country.
Purple/Pink/blue on land is cold/Winter weather. Brown is wind, Green is flooding. Gray is fog. Reddish is a red flag advisory.
Go to the link below, then hit the location/county on the map for details.
https://www.spc.noaa.gov/ Go to "hazards"

Current Weather Map
| NCEP Days 0-7 Forecast Loop | NCEP Short-Range Model Discussion | NCEP Day 3-7 Discussion |


Wind map Press down on this on the left with your cursor!


Current Jet Stream

| Low Temperatures Tomorrow Morning |

Highs today and tomorrow.


Highs for days 3-7:
CHILLY period, especially northcentral to Northeast.


Temperatures vs average for days 3-7.
Blues dominate except along the West Coast.
https://www.wpc.ncep.noaa.gov/medr/medr_mean.shtml


Weather maps for days 3-7 below
Quiet with Cold high pressure and reinforcing cold fronts under a ridge west, trough east couplet aloft.

Liquid equivalent precip forecasts for the next 7 days are below.
Mostly dry pattern.
Day 1 below:
http://www.wpc.ncep.noaa.gov/qpf/fill_94qwbg.gif?1526306199054

Day 2 below:
http://www.wpc.ncep.noaa.gov/qpf/fill_98qwbg.gif?1528293750112

Day 3 below
http://www.wpc.ncep.noaa.gov/qpf/fill_99qwbg.gif?1528293842764

Days 4-5 below:
http://www.wpc.ncep.noaa.gov/qpf/95ep48iwbg_fill.gif?1526306162

Days 6-7 below:
http://www.wpc.ncep.noaa.gov/qpf/97ep48iwbg_fill.gif?1526306162

7 Day Total precipitation below:
https://www.wpc.ncep.noaa.gov/qpf/p168i.gif?1566925971

Last 24 hour precip top map
Last 7 day precip below that
Current Dew Points

Latest radar loop
http://www.nws.noaa.gov/radar_tab.php


| (3400x1700 pixels - 2.2mb) Go to: Most Recent Image |

Go to: Most Recent Image
You can go to this link to see precipitation totals from recent time periods:
https://water.weather.gov/precip/
Go to precipitation, then scroll down to pick a time frame. Hit states to get the borders to see locations better. Under products, you can hit "observed" or "Percent of normal"
+++++++++++++++++++++++++++++++++++++++++++++++
Precipitation compared to average for the last 7, 14, 30 and 60 days.
Some spots in Iowa and especially N/C Illinois have dried out!
Usually not updated for previous day until late the next day.
Soilmoisture anomaly:
These maps sometimes take a day to catch up to incorporate the latest data(the bottom map is only updated once a week).
https://www.cpc.ncep.noaa.gov/products/Soilmst_Monitoring/US/Soilmst/Soilmst.shtml#
![]()


Latest: The first map below is the latest. The 2nd one is from last week.
In july/August/Sept/Oct, it's typical to see some increase in drought because of evaporation, seasonally exceeding low rainfall during those months. However, this year saw a HUGE increase in the Southeast!
Oct.31: TOP MAP SHOWS DROUGHT DECREASED in the Eastern Cornbelt and a bit in the Southeast thanks to some very welcome rains but much more is needed.
The maps below are updated on Thursdays.


The top map is the Canadian ensemble average, the maps below are the individual members that make up the average at the end of week 2.
+++++++++++++++++++++++++++++++++++++++++
Each member is like the parent, Canadian model operational model.......with a slight tweek/variation in parameters. Since we know the equations to represent the physics of the atmosphere in the models are not perfect, its useful to vary some of the equations that are uncertain(can make a difference) to see if it effects the outcome and how.
The average of all these variations(ensembles) often yields a better tool for forecasting. It's always more consistent. The individual operational model, like each individual ensemble member can vary greatly from run to run.........and represent an extreme end of the spectrum at times. The ensemble average of all the members, because it averages the extremes.............from opposite ends of the spectrum.........changes much less from run to run.
End of week 2....................0z Canadian ensembles:
360h GZ 500 forecast valid on Nov 18, 2019 00 UTC


Forecasts for the control (GEM 0) and the 20 ensemble members (global model not available)
0Z GFS(American model) Ensembles at 2 weeks:

GFS Ensemble mean(average of all the individual solutions above). The first map is a mid/upper level map. The 2nd one is a temperatures map at around 1 mile above the surface. These are anomalies(difference compared to average).
NCEP Ensemble t = 360 hour forecast

Latest, updated graph/forecast for AO and NAO here, including an explanation of how to interpret them...............mainly where they stand at the end of 2 weeks.
Previous analysis, with the latest day at the bottom for late week 2 period.
https://www.marketforum.com/forum/t
Saturday: the big player is the solidly negative AO. This is resulting in cold surges dropping from high latitudes Across Canada aimed at the US. With a near zero NAO and Near zero PNA, the push deeply south may not be completely maximized but cold blasts will be crossing the northern border and effecting the northern half. This will be seen with an active northern stream with periodic perturbations that dig strongly south in the flow and amplify The models have had an impossible time forecasting these entities recently.....usually under predicting them but the model to model changes have been enormous in both directions. The northern stream is in fact tougher to forecast historically. A competing, milder southern branch of the jet with mild , dried out oceanic air is trying to exert its influence pushing from west to east.
At times, the models think that this feature will warm up much of the country, possibly even defining a new pattern.......then surprise! Another chunk of northern stream energy shows up dropping south thru Canada which quickly replaces any warmth along the northern stream.
Additionally a ridge west, weakening trough east couplet is favorable for air masses to have a southern component in movement which gives the northern stream more power to intercept air masses coming from the west, trying to push east....and failing
I’ve been expecting a milder pattern in week 2 now for a week but until the AO increases more, cold surprises on week 2 models could continue.
What is most likely is that the West will warm up. How Far East the warmth can go is in question. Maybe in mid november it will finally be able to do that more....if the -AO lets
Sunday: Forecast philosophy is unchanged from yesterday.
National Weather Service 6-10 day, 8-14 day outlooks.
Updated daily just after 2pm Central.
Temperature Probability
 Precipitation Probability

| the 8-14 day outlooks ArchivesAnalogsLines-Only FormatGIS Data | |
Temperature Probability | |
 | |
Previous posts:
By wxgrant - Oct. 21, 2019, 7:11 p.m.
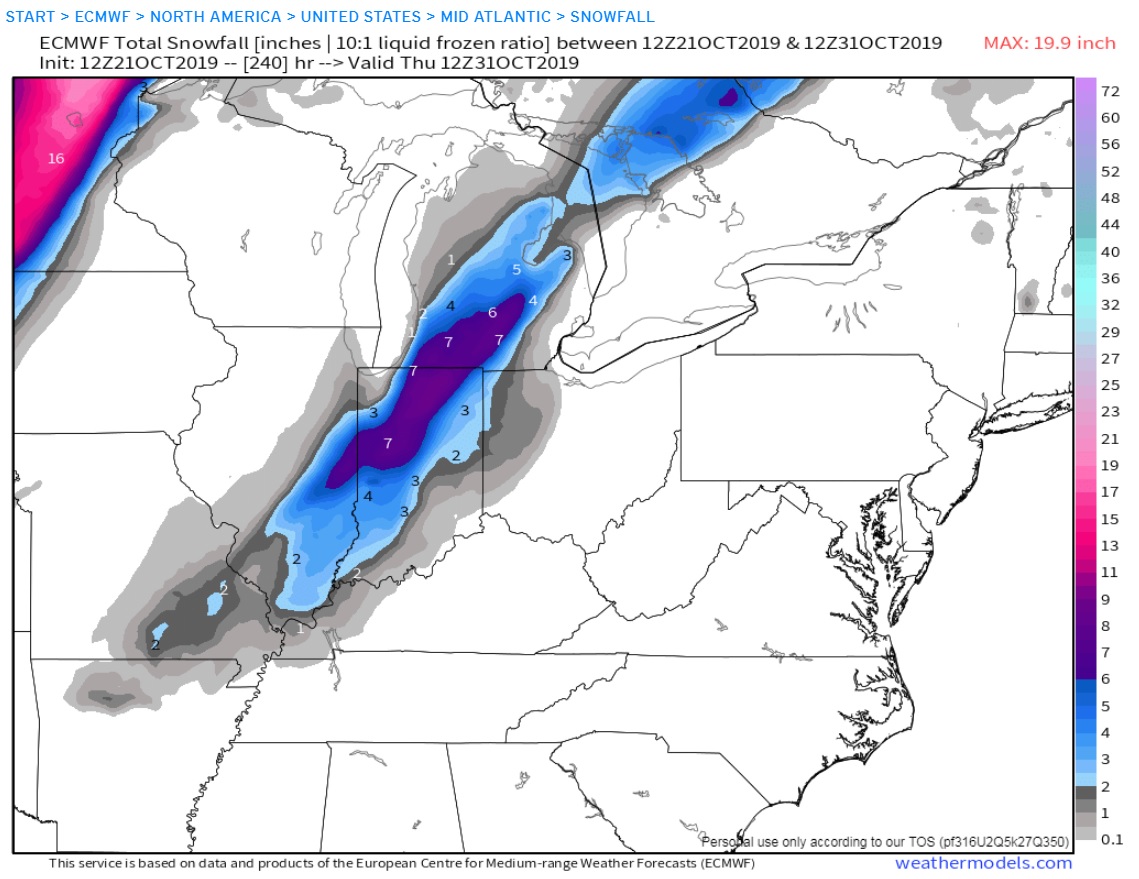
1993 anyone? This is the 240hr Operational Euro which is painting some snow the morning of Halloween. I know it probably won't happen but I love winter weather and I'm glad it's that time of the year where hour 240 is always interesting somewhere :-) . There was a huge cold air outbreak around Halloween 1993. Snowed as far south as Montgomery Alabama that day.
++++++++++++++++++++++++++++++
Re: Re: Re: Re: Natural Gas October 14, 2019
By metmike - Oct. 21, 2019, 7:42 p.m.
Thanks Grant!
I remember that one vividly and it was actually the day before Halloween here in Evansville, Oct 30th which was a Saturday.
I went sledding with the kids and we made a snow man in the backyard.
I went Trick or Treating with the kids the next day with the snow on the ground and sub freezing temps.
I'm guessing our snow was just over 6 inches and it was a record for October but will retrieve the records.
Snow storms have always been my favorite too. When I moved down here in 1982 from Cincinnati(6 months) after living in Michigan, it was thought to be temporary and farther south than I would have preferred because of less snow(but I was going to any tv station that would hire me-including applying at Fairbanks Alaska)
+++++++++++++++++++++
By metmike - Oct. 21, 2019, 7:55 p.m.
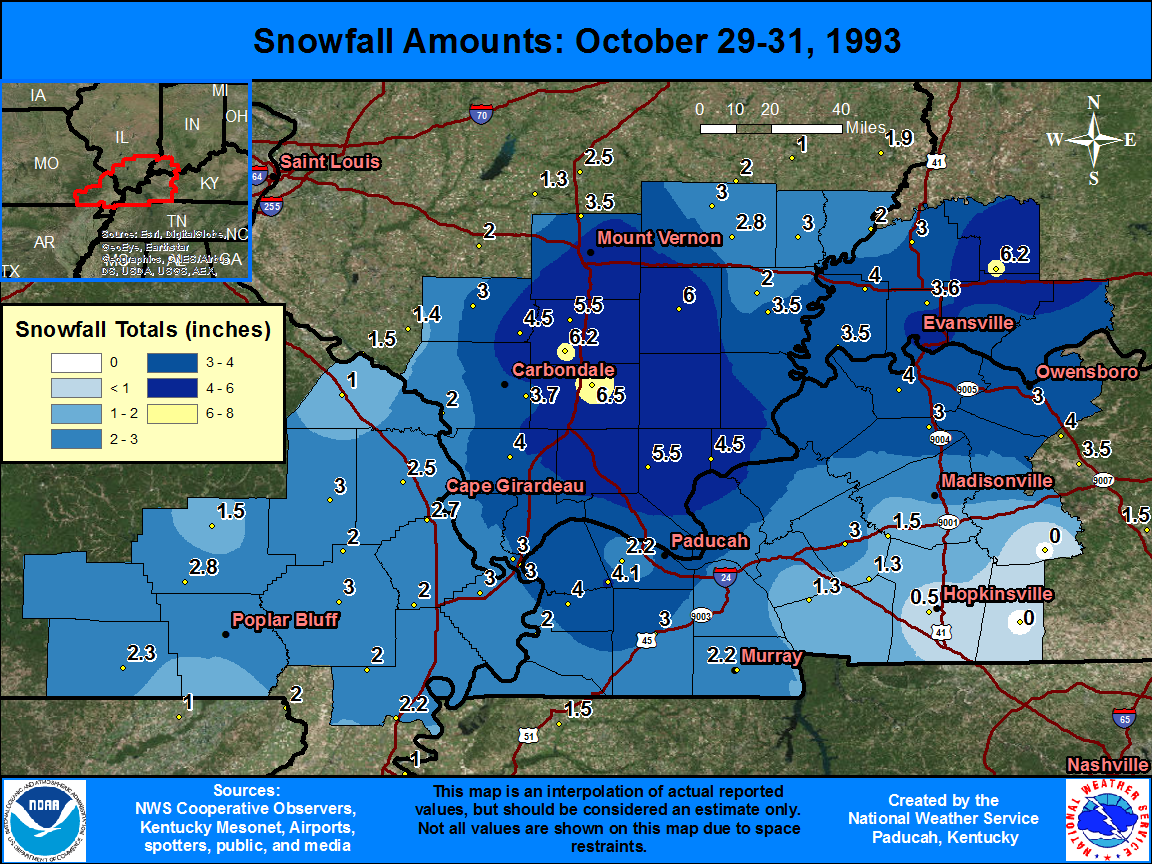
OK, we got a total of 4.6 inches from that event, 3.7 inches fell on October 30th(most of which was very early in the morning.
The 3.7 inches is a record for 24 hours in October.
Our record snow for November is 6.9 inches set on the 28th in 1958.
That snow event in 1993 is the biggest snow in the records until the event on Nov 28th almost a month later to show how anomalous the Oct 1993 event was.
Go to snowfall at the link below
https://www.weather.gov/pah/EvansvilleDailyNormalsAndRecords
Maybe I can retrieve some wx maps of that storm now.
+++++++++++++++++++++++++++
By metmike - Oct. 21, 2019, 7:58 p.m.
https://www.weather.gov/pah/SnowOct29-31_1993
OK, even better:
+++++++++++++++++++++++++++++++++
By metmike - Oct. 21, 2019, 8:06 p.m.
https://www.youtube.com/watch?v=uzosOgVFQJY
A surprise snowstorm hit the Cincinnati area on the weekend of Oct. 30-31, 1993. When it ended on Sunday, there were 6.2 inches on the ground, marking the first White Halloween on record in the region. The 5.9 inches of snow on Saturday – Halloween Eve - was a record for a single day in October. The next day, the coldest high temperature for Halloween - just 36 degrees – kept a lot of trick-or-treaters home.
+++++++++++++++++++++++++++++++++++++++++++++++++
Re: Re: Re: Re: Re: Re: Re: Re: Natural Gas October 14, 2019
By cutworm - Oct. 21, 2019, 10:42 p.m.
I remember taking the kids Trick or Treating that year! Great memories! Should have had abominable snow man costumes!
+++++++++++++++++++++++++++++++
By metmike - Oct. 31, 2019, 12:34 p.m.

++++++++++++++++++++++
By bowyer - Oct. 31, 2019, 5:48 p.m.
We got our Halloween snowstorm here. I think the most we've ever had here on Oct. 31 was a trace. I measured almost 6 inches on the ground in sheltered areas. There has been some drifting this afternoon also. Lots of corn and beans still in the field in the area.
+++++++++++++++++++++++++++++++++++++++++
Re: Re: Re: Re: Weather Halloween
By wxgrant - Oct. 31, 2019, 7:25 p.m.
We had snow flurries in Cape Girardeau today. Numerous reports of flurries on my area.
++++++++++++++++++++++++++
Re: Re: Re: Re: Re: Weather Halloween
By metmike - Oct. 31, 2019, 11:51 p.m.
We had some flurries too here in southwest IN.
+++++++++++++++++++++++++
Take this forecast with a huge grain of salt and its several days old.
It's for the month of November.
| Revised OFFICIAL 30-Day Forecasts | |||
| Issued: October 31, 2019 | |||
  | |||
| | |||
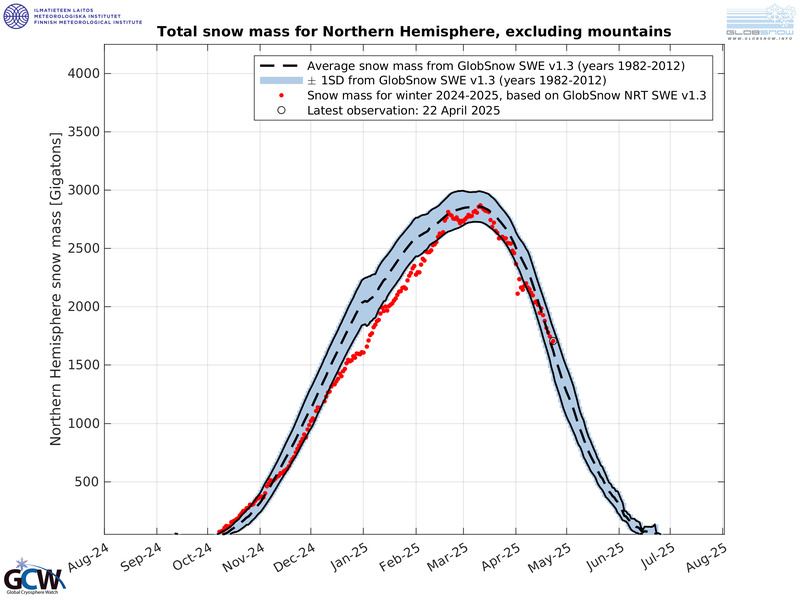
Snow cover right now in the Northern Hemisphere is way above average.
In November, this increases the chances for colder than average temperatures during the first half of Winter.
https://globalcryospherewatch.org/state_of_cryo/snow/fmi_swe_tracker.jpg
https://climate.rutgers.edu/snowcover/chart_daily.php?ui_year=2019&ui_day=307&ui_set=2


