Awesome August 8th! Do something to make somebody feel wonderful today! Congrats to the Integral Heart Family on raising massive funds for their "wonderful" children: https://www.marketforum.com/forum/topic/34791/
Scroll down and enjoy the latest comprehensive weather to the max...... occurring because of the natural physical laws in our atmosphere.
We continue to trade: "Rain makes Grain"(hot HAS turned bullish as we have some heat during week 2).
We have added more heat to the forecast again today in week 2 but the last GFS ensemble was cooler.
Still big rains ahead of the heat, starting late week 1 now. ........so they are finally getting closer. They are not as robust and widespread in the dry spots on some models but this is uncertain. The central and eastern Cornbelt have dried out and need rains ASAP.
Crop ratings did drop 1% for corn but stayed the same for beans..............on the bearish side of expectations.
The added heat in the forecast is clearly bullish for natural gas but it struggles with mega bearish fundamentals. The big rains finally moving up to week 1 and getting closer is a secondary factor for grains today.
Possibly hot and dry after that is primary.
Here are the latest hazards across the country.
Purple/Pink/blue on land is cold/Winter weather. Brown is wind, Green is flooding. Gray is fog. Reddish is a red flag advisory.
Go to the link below, then hit the location/county on the map for details.
https://www.spc.noaa.gov/ Go to "hazards"

Current Weather Map
| NCEP Days 0-7 Forecast Loop | NCEP Short-Range Model Discussion | NCEP Day 3-7 Discussion |


Wind map Press down on this on the left with your cursor!


Current Jet Stream

| Low Temperatures Tomorrow Morning |

Highs today and tomorrow.
Hot West, East and South!
Cool Upper Midwest!


Highs for days 3-7:
Hot in the South!!! Cool northern tier to West!!


Temperatures compared to average for days 3-7 below
A bit below average northcentral to West US. Hot in the south!
We have passed the peak in Summer temperatures based on climatological/historical averages.
But there will be plenty of heat left this Summer and more of it in todays week 2 forecast.
https://www.wpc.ncep.noaa.gov/medr/medr_mean.shtml


Weather maps for days 3-7 below
Cold front tracking south next week has potential for big rains in dry spots.

Liquid equivalent precip forecasts for the next 7 days are below.
Huge totals in the Southwest belt. Rains move east next week. Generous amounts possible but uncertain.
Rains continue to get 1 day closer with the turn of the calendar page.
Day 1 below:
http://www.wpc.ncep.noaa.gov/qpf/fill_94qwbg.gif?1526306199054

Day 2 below:
http://www.wpc.ncep.noaa.gov/qpf/fill_98qwbg.gif?1528293750112

Day 3 below
http://www.wpc.ncep.noaa.gov/qpf/fill_99qwbg.gif?1528293842764

Days 4-5 below:
http://www.wpc.ncep.noaa.gov/qpf/95ep48iwbg_fill.gif?1526306162

Days 6-7 below:
http://www.wpc.ncep.noaa.gov/qpf/97ep48iwbg_fill.gif?1526306162

7 Day Total precipitation below:
http://www.wpc.ncep.noaa.govcdx /qpf/p168i.gif?1530796126

Risk of excessive rains.
Mesoscale Precipitation Discussions
A stalled area of heavy rains from E.KS to points just southeast.
Current Day 1 Forecast Valid 12Z 04/22/19 - 12Z 04/23/19 |
Day 1 Threat Area in Text Format
| Day 2 and Day 3 Forecasts |
Current Day 2 Forecast Valid 12Z 04/23/19 - 12Z 04/24/19 |
Day 2 Threat Area in Text Format
Current Day 3 Forecast |
Severe Storm Risk
Slight risk in a couple of places.
Current Day 1 Outlook | Forecaster: Thompson/Squitieri Issued: 20/1624Z Valid: 20/1630Z - 21/1200Z Forecast Risk of Severe Storms: No Svr Tstms |
Current Day 2 Outlook | Forecaster: Broyles Issued: 20/0546Z Valid: 21/1200Z - 22/1200Z Forecast Risk of Severe Storms: Marginal Risk |
Current Day 3 Outlook | Forecaster: Broyles Issued: 20/0711Z Valid: 22/1200Z - 23/1200Z Forecast Risk of Severe Storms: Marginal Risk |
Current Day 4-8 Outlook |
Last 24 hour precip top map
Last 7 day precip below that
https://www.wunderground.com/maps/precipitation/daily


Current Dew Points
Moisture pooling up towards the cold front in the Southern Midwest.
Not enough to generate robust rains in the dry and getting drier spots of the Central and Eastern Cornbelt this week(except for southwestern belt)

Latest radar loop
http://www.nws.noaa.gov/radar_tab.php


| (3400x1700 pixels - 2.2mb) Go to: Most Recent Image |

Go to: Most Recent Image
You can go to this link to see precipitation totals from recent time periods:
https://water.weather.gov/precip/
Go to precipitation, then scroll down to pick a time frame. Hit states to get the borders to see locations better. Under products, you can hit "observed" or "Percent of normal"
+++++++++++++++++++++++++++++++++++++++++++++++
Precipitation compared to average for the last 7, 14, 30 and 60 days.
Some spots in Iowa and especially N/C Illinois have dried out!
Usually not updated for previous day until late the next day.
https://www.atmos.illinois.edu/~snodgrss/Ag_Wx.html


Soilmoisture anomaly:
These maps sometimes take a day to catch up to incorporate the latest data(the bottom map is only updated once a week).
Parts of Iowa has dried out, along with much of the central and eastern belt, especially central Illinois.
Rains don't look (possibly)robust until..............next week. Getting 1 day closer, every day.
https://www.cpc.ncep.noaa.gov/products/Soilmst_Monitoring/US/Soilmst/Soilmst.shtml#
![]()


Currently, there is now some drought in the main Cornbelt/Midwest. There is still drought in the Southeast.
July summary: Short term dryness is becoming an issue is some spots that might result in a bit of long term drought (flash drought) later this Summer if rains don't pick up.
Latest: The first map below is the latest. The 2nd one is from last week. Note the increase in yellow, slight drought across much of the central and eastern Cornbelt on the latest map.
The map below is updated on Thursdays.
The market has turned into a rain makes grain market( any hot/dry in the forecast will be considered as bullish for the next month+).
https://droughtmonitor.unl.edu/


The top map is the Canadian ensemble average, the maps below are the individual members that make up the average at the end of week 2.
+++++++++++++++++++++++++++++++++++++++++
Each member is like the parent, Canadian model operational model.......with a slight tweek/variation in parameters. Since we know the equations to represent the physics of the atmosphere in the models are not perfect, its useful to vary some of the equations that are uncertain(can make a difference) to see if it effects the outcome and how.
The average of all these variations(ensembles) often yields a better tool for forecasting. It's always more consistent. The individual operational model, like each individual ensemble member can vary greatly from run to run.........and represent an extreme end of the spectrum at times. The ensemble average of all the members, because it averages the extremes.............from opposite ends of the spectrum.........changes much less from run to run.
End of week 2....................0z ensembles:
Analysis starting from a week ago, ending with today:
Last week+ of analysis, starting with the day farthest in the past. This is an end of week 2 forecast!
Last Tuesday: Similar to Monday. Could be a pretty big temp gradient(with cool air north) that serves to focus big rains later in week 2. along with an active jet stream.
Wednesday: Heat ridge in the Southern Plains is building a bit more. Some solutions have a dome building in across the South, others keep the upper level trough in the Midwest to Northeast.
Thursday: More solutions going for the heat ridge/dome across the south. Trough in the north is weaker. Looks like high heat in the south, cool in the northern tier and tons of rain in between. This pattern can be favorable for excessive rain events around the periphery of the heat ridge.
Friday: Heat ridge in the south still impressive late week 2. Trough West and jet stream over the top of the heat ridge
Saturday: Heat ridge not as impressive. A bit more troughing and cooling Midwest to Northeast.
12z Saturday update: Heat ridge MUCH more impressive!
Sunday: Using 12z run today. Not as impressive as Saturday's 12z run the heat ridge but the pattern is pretty clearly defined. A huge heat ridge in the south with a strong, active jet stream tracking zonally over the top of the heat ridge across the country with plenty of storm making systems along the southern edge of that jet stream. How far north or south these features will be is uncertain. Good chance the heat ridge will build north late in week 2.
Monday: A ton of disagreement towards the end of week 2 on the location of the main features, especially the heat ridge/dome, which will be impressive. Favored location is maintaining in the south but there's a good chance for it to be pumped to the East Coast if the strong jet stream coming over the top of it zonally, buckels to the west or if the upper level trough just off the West Coast moves east.
Tuesday: Heat ridge does in fact get pumped east on the majority of the solutions. Deep trough off the West Coast moves inland bit, helping that to happen. This shifts the heat eastward. Heavy rains between the trough and heat ridge.
Wednesday: Heat ridge decidedly farther east again, in fact, centered in the the far W.Atlantic off the Southeast Coast. Trough West still and active jet along the northern border. Additionally some potential northern stream flow from Canada and a ridge in N.Alaska with downstream trough in Central Canada.
Thursday: 12z run(12 hours later than usual but just in). Much less bullish and much farther south with the head ridge at the end of week 2 on this model and run. Jet stream much farther south as well as cooler air and heat displaced farther south........on this run.
360h GZ 500 forecast valid on Aug 23, 2019 12 UTC


0Z GFS Ensembles at 2 weeks:
Analysis, starting with the oldest, ending with the most recent:
Last Friday: Ridge West, trough east. Cooool. How much rain?
Saturday: Ridge West/trough East in week 2 is dominant on this model with potential for some changes late week 2.
Sunday: Is the ridge out West going to shift eastward late in week 2?
Monday: More indications that the ridge in the West could shift farther northeast, along with some of the heat. Trough in the east is notably weaker which means not as cool in the Midwest/East.
Tuesday: Active/wet jet stream coming over the top of the heat ridge. Significant troughing in the Northeast to deliver cool air down into the Midwest.
Wednesday: Half of the solutions on this model build a major heat ridge across the country that pushes the upper level trough influence farther north.
Thursday: Heat ridge anywhere from the Rockies to points southeast. Troughing along the Canadian border to the Northeast will usher in some cooler air there. Big temperature gradient and heavy rains.
Friday: Heat ridge somewhere from the S.Rockies to the Southeast US. Active flow over the top?
Saturday: Wide spread in solutions. 12Z update, huge change to heat ridge building farther across the country.
Sunday: Not as bullish as yesterday's 12z run. Huge spread on location of the heat ridge(for sure in the south) and jet stream.
Monday: Still the major disparity in the location of the heat ridge late in week 2 on individual solutions and the location of an upper level trough and jet stream. 1. There will be a big heat ridge. 2. There will be a deep upper level trough to the west of north of it. 3. The upper level trough in the Northeast is weakening.
Tuesday: Still some disagreement on heat ridge but most bring it east and even northeast............so the heat moves east! Stormy weather on the backside of the heat ridge in front of a deep upper level trough that might be around sw Canada/Pac Northwest.
Wednesday: Heat ridge builds in week 2 but late in the period, potential for northern stream energy to crash south with an upper level ridge in the Gulf of Alaska coupled nicely with an upper level low downstream. In the absence of the northern stream influence(south of it) heat will dominate.
Thursday: Still the 0z, older run for this model. Huge heat ridge but great uncertainty on location.

GFS Ensemble mean(average of all the individual solutions above). The first map is a mid/upper level map. The 2nd one is a temperatures map at around 1 mile above the surface. These are anomalies(difference compared to average). The daily analysis starts with the oldest and ends with the latest.
Last Friday: Full latitude positive anomaly West, all the way to Alaska, coupled nicely with negative anomaly downstream centered in Southeast Canada to Northeast US. Heat West, cool Midwest/East.
Saturday: Anomalies have a bit less magnitude today but are still positive/hot west, negative/cool east.
Sunday: Weak positive west and new positive height anomaly in the deep South. Negative in eastern Canada. Cool in the period before this but things might change late in week 2.
Monday: Trend continues to weaken the positive anomaly in the West and shift it eastward/southeast, along with some of the heat. In combination with the negative anomaly in Southeast Canada weakening, which lessens the amount of cool air in the Midwest/East.
Tuesday: Center of the positive anomaly has shifted into northwest Canada to Siberia with a much deeper negative anomaly in southeast Canada which is a cooler solution, despite slightly elevated heights in the Plains. The cooler air coming south will set up a boundary that is the focus for increasing week 2 rains.
Wednesday: BIG CHANGE! Now we have modest positive anomalies across most of the USA and a negative anomaly in Southeast Canada. This is MUCH warmer than the guidance for some time. The heat will spread east with this solution.
Thursday: Slight positive anomalies except for weaknesses in the Pac NW and SE Canada, so some cooler air along the border states.
Friday: Modest, slightly positive anomalies across the US late week 2. Negative anomaly far Eastern Canada might be a source of some cooler air along the northern tier.
Saturday: New negative anomaly center(weak) west of the Hudson Bay in Canada. Modest positive anomalies over much of the US. Lot's of uncertainty. 12Z update, positive anomaly across the US greatly amplified on this run at the end of 2 weeks. Speculation: A strong jet stream coming zonally underneath the new negative anomaly west of the Hudson Bay has the potential to greatly build a heat ridge to the south of it and cause it to spread across much of the United States, especially the southern half.
Sunday: Still a weak negative anomaly just west of the Hudson Bay in Canada. Positive anomalies growing in the East late in the period. Pattern change to hotter for the 2nd half of August???
Monday: New positive anomaly in Eastern Canada to the Northeast.........so this area will warm up. Weak Negative anomaly, possibly transient from West of Hudson Bay to N.Rockies. Looks wet midsection and hotter and more humid eastern half at the end of week 2.
Tuesday: Pattern change to hotter! Positive anomaly in the Northeast has grown today. ...replacing the negative anomaly that has been there for awhile and will last another week. Some troughing along the West Coast to Central Canada.
Wednesday: Heat ridge builds in week 2 but positive anomaly in the Gulf of Alaska and downstream negative anomaly in south/central Canada will be sending some northern stream energy south of the border. Modest positive anomaly Northeast means the heat has shifted east.
Thursday: Modest positive anomaly in the Northeast may be transitory. Much bigger positive anomaly in the Guof of Alaska with a downstream negative anomaly around the Hudson Bay, linked well to deliver cold fronts south to the West, then Plains, then eastward?
NCEP Ensemble t = 360 hour forecast

Latest, updated graph/forecast for AO and NAO here, including an explanation of how to interpret them...............mainly where they stand at the end of 2 weeks.
Previous analysis, with the latest day at the bottom for late week 2 period.
Last Wednesday: AO near 0. NAO, going from strongly negative to 0 with the pattern change and trough in the East filling in, allowing heat in the West to spread eastward. This is potentially a big deal for temperatures. PNA around 0.
Thursday: AO and PNA near 0. The NAO is on the move. Rebounding from solidly negative to near 0 at the end of 2 weeks......less favorable for cool air delivery.
Friday: AO around 0. PNA increases to positive. NAO goes from quite negative, bouncing back to 0 as week 2 progresses, so cool influence until late in week 2.
Saturday: AO near 0. NAO goes from very negative for his time of year to just above 0, possible warming(uncertainty). PNA gets pretty positive, which is favorable for ridging west and cooling downstream.........mixed signals.
Sunday: NAO on the move from very negative for August, back to near 0.......could mean warmer temps the 2nd half of August. PNA is crazy. Goes from a bit negative to extremely positive(ridge west/trough east) then crashes back towards 0 at the end of 2 weeks.
Monday: AO slightly negative. NAO continues to go from very negative and cool into the start of week 2 to increasing rapidly back to 0 at the end and possibly foretell a much warmer pattern in the East. PNA mostly positive.
Tuesday: The big deal has been the NAO. It continues to go from very negative and cool and rapidly increasing to 0 as the pattern shifts to much warmer from the heat ridge moving to the east. AO slightly negative. PNA goes from very positive, to dropping towards 0 with the new pattern featuring a trough out West.(trough West/ridge East couplet)
Wednesday: AO near 0. PNA drops from very positive. NAO continues from very low to recovering back to 0 and some are positive............warming in the East week 2!!!
Thursday: AO a bit negative. PNA drops from positive. NAO comes from very low to almost 0. For sure warming in week 2 but what then after that?
National Weather Service 6-10 day, 8-14 day outlooks.
My comments below are usually made hours before the afternoon update, starting with the oldest comment.
Last Wednesday: Extended maps hotter today. Not sure how much will be dialed in by NWS this afternoon. Rains pick up, along with temps with some uncertainty on precip.
Thursday: HOT South! Cool north. Heavy rains in between!
Friday: Hot South and very cool north. A zone of heavy rains in between.
Saturday: Probably similar to the last few extended NWS outlooks......hot reds south, cool blues north, lots
of green rains in between.
Sunday: More hot south and cool north with lots of rain in between.
Monday: More hot south and cool north but the 8-14 may have some changes that start soon that feature warming in the East and cooling West. Still a ton of rain in the midsection.
Tuesday: High confidence now in the changes mentioned yesterday. Not sure how much will show up in the NWS forecast this afternoon but the heat moves east and below temps dominate the West. Still potential for a lot of rain in between with the location shifting farther northwest than yesterday.
Wednesday: NWS should be warming the East up much more...........cooler West. Big rains now mainly in the early parts of the 6-10 day, possibly drying up in the 8-14 day.
Thursday: NWS came around yesterday to bringing in the heat. More heat today in these outlooks. How much rain is the huge question. Rains might become scarce again in some locations but there is also a case to be make for active weather in the north.
Temperature Probability
 Precipitation Probability

| the 8-14 day outlooks ArchivesAnalogsLines-Only FormatGIS Data | |
Temperature Probability | |
 | |
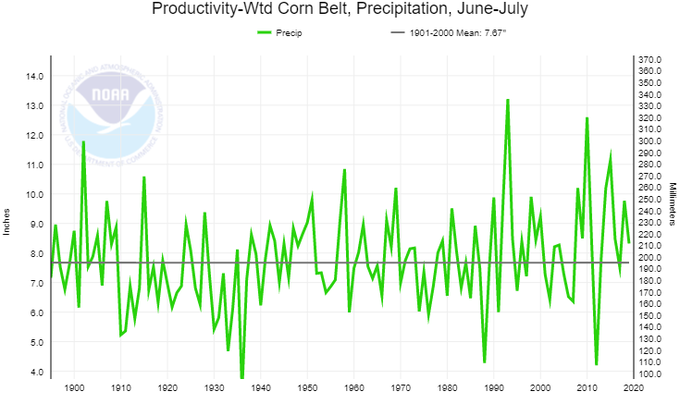
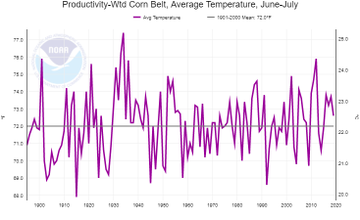
A very "normal" summer so far in the Corn Belt (productivity weighted) statistically...temps 0.6°F above normal with June-July rainfall 0.65" above normal. Warm overnight lows in July (2.6°F above normal, 13th warmest on record) but highs were near normal (0.1°F above normal)
Previous discussions
By cliff-e - July 31, 2019, 11:13 a.m.
My Grandpa used to say we needed to have "Roasting" ears by his birthday August 10 in order to have good corn...the best of the corn in our locale in W. Mn. is barely in the "Blister" stage now...a lot of corn has yet to tassle and there's a field or 2 that's not yet waist high. Even the most advanced fields are highly uneven in height due to "mudding" the crop in whilst skimping on fertility and there's been tremendous de-nitrification due to excessive rainfall. Soybean fields are highly variable... all were planted late not allowing enough time for root nodulation required for adequate flower and pollination and none are yet knee high. The numerous PP fields were/are badly weed infested before weed control could be done due to extreme wetness...some have just now opted to plant cover crops with no hope of harvesting even poor quality forage from them. Time is marching on quickly towards the 1st killing frost...that is a certainty.
Thanks Cliff!
metmike
By metmike - Aug. 3, 2019, 7 p.m.
Updated above:
12Z update, positive anomaly across the US greatly amplified on this run at the end of 2 weeks. Speculation: A strong jet stream coming zonally underneath the new negative anomaly west of the Hudson Bay has the potential to greatly build a heat ridge to the south of it and cause it to spread across much of the United States, especially the southern half.
++++++++++++++++++++++++++++++++++++++
By bowyer - Aug. 3, 2019, 10:52 p.m.
We have had one shower of 2/10 inch since June 24. That's 41 days straight with basically no rain. West central Illinois. We had 11.15 inches in May
++++++++++++++++++++++++++++++++++++++
Thanks bowyer!
Yes, been watching that closely. You might miss good rains for most of this week too. How is your crop holding up?
+++++++++++++++++++++++++++++++++++
By bowyer - Aug. 4, 2019, 5:12 p.m.
Corn is rolling during the day, and some of the lower leaves are starting to fire. We really need rain soon. Will try to bale some hay this week, but it is short and drying up, so there won't be much there. It seems that the forecasts are always for big rains in week 2. Maybe everywhere else, but not here.
++++++++++++++++++++++++++++++++++++++
Re: Re: Re: Re: Weather Sunday
By metmike - Aug. 4, 2019, 5:29 p.m.
Thanks!
How about the beans?
I think the ratings will be down a point or 2 because of the drops in the I states and Ohio.
+++++++++++++++++++++++++++++++++++++++++++++
Re: Re: Re: Re: Re: Weather Sunday
By bowyer - Aug. 4, 2019, 8:44 p.m.
The beans are short, but seem to be holding on. They have a good color. If it ever starts raining, they have a chance at respectable yields, but we need the rain ! (and a late frost would help) Thanks for your thoughts on the grain markets
++++++++++++++++++++++++++++++++++
Re: Re: Re: Re: Re: Re: Weather Sunday
By metmike - Aug. 4, 2019, 9:29 p.m.
YW bowyer!
Thank YOU for the crop condition report where you are.
Sorry that you may have to wait awhile for that needed rain.
++++++++++++++++++++++++++++++++++++++++++++++++++++++++++++++
Re: Re: Re: Re: Weather Tuesday
By bowyer - Aug. 6, 2019, 1:51 p.m.
We had an unexpected half inch of rain last night. The rains dropping from northern Iowa were supposed to dry up by the time they arrived here, according to the local 10:00 TV weather forecast. Not far from here, I've heard amounts between 1.0 to 1.3". It was NEEDED !
++++++++++++++++++++++++++
Re: Re: Re: Re: Re: Weather Tuesday
By metmike - Aug. 6, 2019, 5:28 p.m.
Congrats bowyer!
Probably added a couple of bushels to your crop!
The advertised big rains for week 2 have finally been moved up to week 1. Here they are in days 6-7 of the latest forecast:
+++++++++++++++++++++++++++++++++++++++++++++++++++++
Re: Re: Re: Re: Weather Tuesday
By bowyer - Aug. 6, 2019, 8:34 p.m.
I am under that beautiful purple blotch. Hope it materializes ! Mowed hay today to beat the rain !!! :)
Damaging Midwest Freezes the last 50 years
Started by metmike - Aug. 7, 2019, 5:33 p.m.

