Been doing a bit of homework on the historical data for early damaging freezes in the Midwest.
So we have 3 big freezes in the last 45 years.
Early Sept 1974 must have been great damage to both corn and beans
Sept 15, 2011 mainly beans
Sept 23-25 1995 did damage, mainly beans only because of the late planting in IL/IN.
Thats 3 times in 45 years, the last 2 mainly to the beans, and the last one only because we planted in IL/IN well into June........not unlike this year.
Here's a good article on the 2011 freeze from Accuweather.
https://www.accuweather.com/en/weather-news/freeze-upper-midwest-soybeans/55096

This map shows low temperatures as of 7:00 a.m. CDT, Thursday morning Sept. 15, 2011, over the upper Midwest.
| her.com |
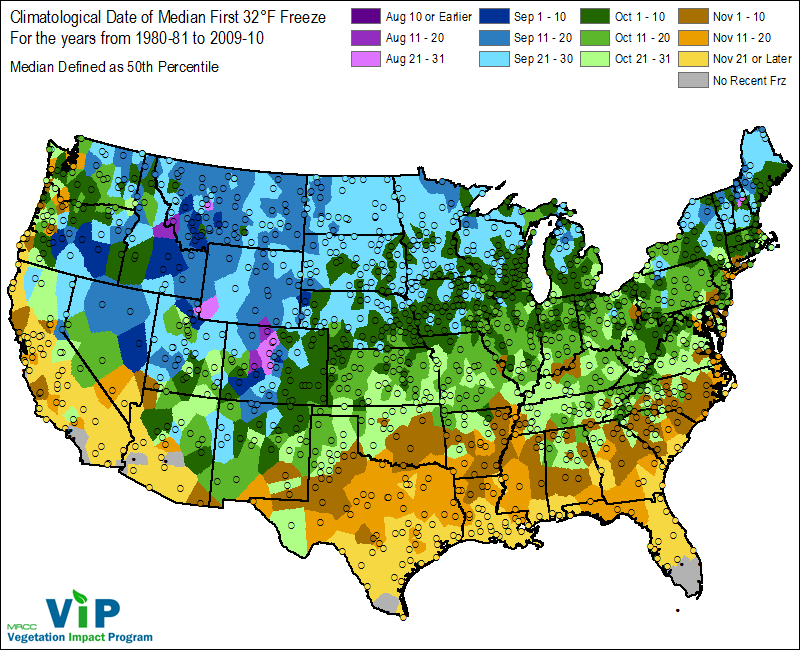
Note that the first freeze in the Upper Midwest averages the last week in September. With a warm August, this will not do alot of damage.
The first freeze dates in the Eastern Cornbelt are 10+ days later. Early October in the colder spots, mid October in much of the rest of those locations. This will not do alot of damage with a warm August.
If we have freeze dates more than 2 weeks early, then it will do some damage.
https://www.weather.gov/iwx/fallfrostinfo
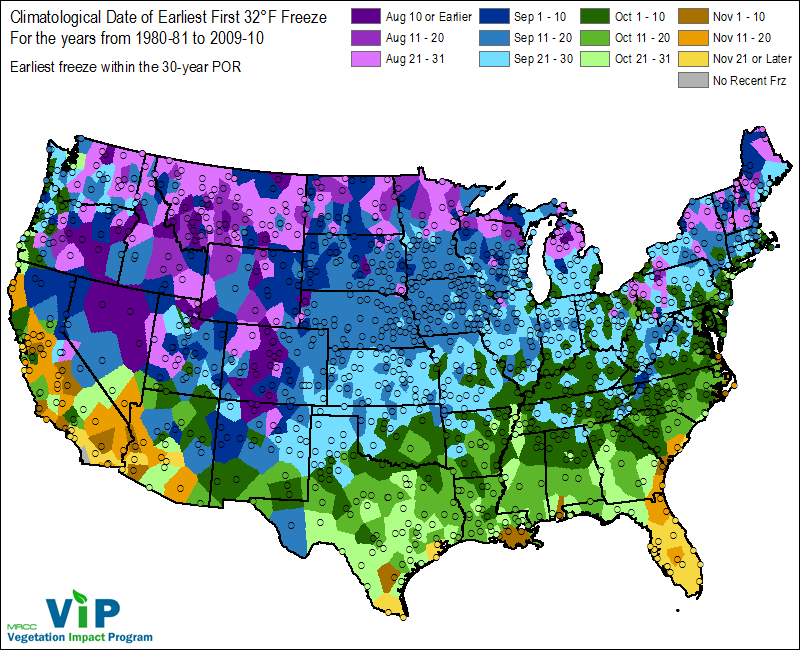
Here are the earliest freeze dates since 1980............so this data did not include an earlier one in 1974.
A very rare freeze has happened before along the Canadian border as early as late August. This would be mainly Hard Red Spring wheat country. The HRS crop was actually planted on time this year.
If this map included 1974 in some places in the Upper Midwest, it would have the dark/navy blue shade for early Sept. instead of the medium blue, which is Sept 11-20.
Very rare first freezes have happened in the Eastern cornbelt in the coldest places in mid Sept with most spots having late Sept. The 1995 Sept HARD freezes that went down to the Ohio River were actually Sept. 23/24. That would hurt the beans for sure this year and possibly the corn if its cool between now and then.
Again, these are rare events, maybe once every 15 years to get that cold so early.
https://www.weather.gov/iwx/fallfrostinfo
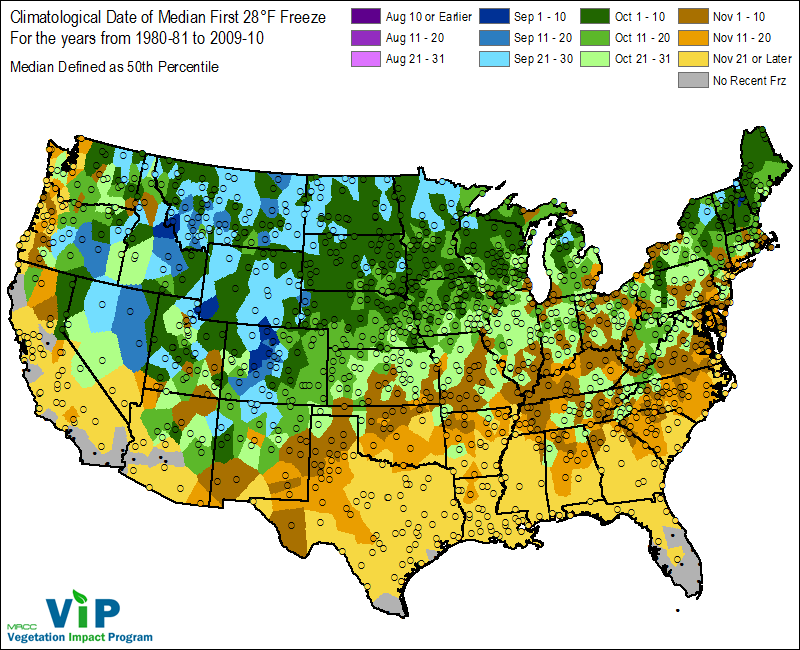
Fig. 7. Climatological Date of the Median First 28°F freeze for the United States.
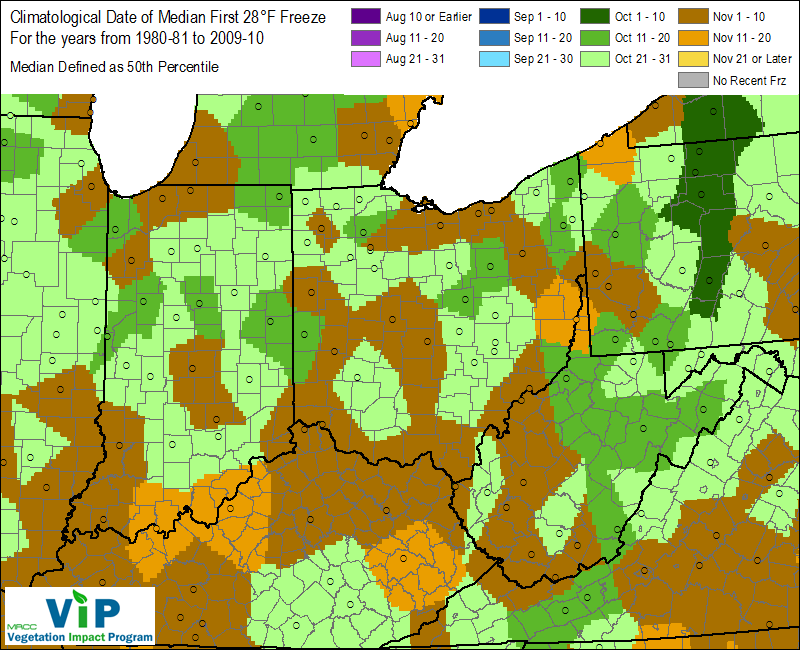
Fig. 8. Climatological Date of Median First 28°F freeze for the region.
Below are images depicting the earliest and the latest dates for the first 28°F freezes across the U.S. and in our region.
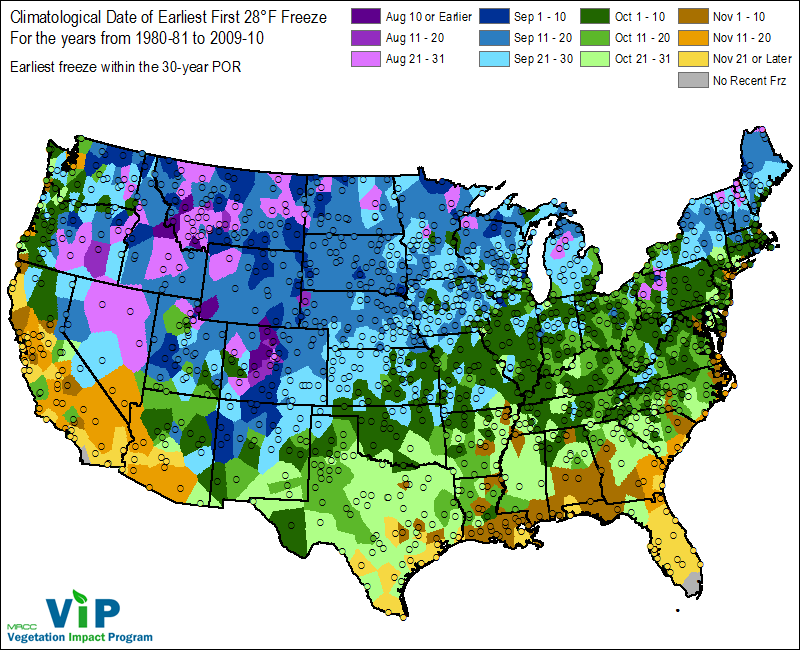
Fig. 9. Climatological Date of the Earliest First 28°F freeze for the United States
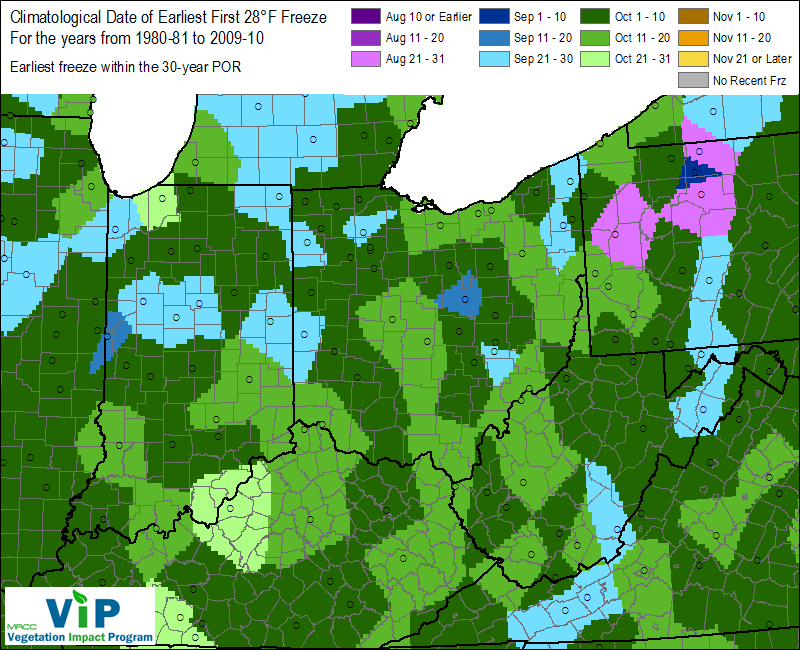
Fig. 10. Climatological Date of the Earliest First 28°F freeze for the r
mm, did the 6 to 10 day just go hot and drier ? Yes 1974 we had 40/40/40 corn......nasty wet, no test weight, no yield. Scooped that crap out of grain truck that had a broken hoist.......seems like yesterday
I think I read some where it takes on average 50 days from tassel to black layer
Around here we still have corn with no tassels
Some of this is corn in wet spots which probably would not yield much any way
But we do have some whole fields not in tassel
I have also noticed a lot of corn which is/was very uneven to tassel
Not so much in the row but where water slowed development
I am also seeing fields that just look very uneven, even though they are in tassel
It always amazes me that a 4' plant will tassel
Given the general uneven crop I am not expecting a big yield, on average "here"
If a corn plant is stunted in any way, then yield is lost. More so on wet, compacted soil than heat stress. The plant is bred for heat stress but wet soil, not so much, if any. Plant breeders assume the farmer can control the planting in dry soil, bur not the weather or heat stress. So they breed for heat stress.
As a rule of thumb, June planted corn has a shallow kernel
No idea why, unless it is the genetics, as something has to give in order to mature in less days, when planted out side it's adapted zone
However, northern corn has a longer day, light and longer heat period some days, but not always, compared to "here"
That is why a variety taken out of the adapted zone will not perform as well as full season varieties, due mostly to genetics adapted for a zone
So around "here"
Any corn not showing tassel needs until Nov, or almost,. to black layer
That includes water damage, late planted you name it
The June planted will surprise me if it is a normal yield
That leaves a very small portion that will yield to full potential
We have been getting spotty rains
I think a larger than normal area in the USA is also in the spotty rain fall kind of weather, with some high yielding soil in Ind, Ill and Ohio getting hit with spotty rain.
And just to keep it interesting, the northern corn has too much water. Some place it must be just right for good yields.
I think Mich. is in about the same kind of yield potential as we are
All things considered, I an very certain we do not end up with a very large carry over going into end of 2020, before new crop is harvested
Just watching USDA and there programs etc, some thing tells me they already know this corn crop will be much less than expected
How much do we grow is any bodies guess but less it will be
I have aan idea a frost is the least of our worries except for corn that is not in tassel
I expect there are a number of acres scattered through out the corn belt, still with out a tassel
Will frost wait until Nov for those acres???
Thanks wayne and mcfarm,
Yes, the 8-14 day went hot and dry finally.
"Wednesday Morning: Wednesday: NWS should be warming the East up much more...........cooler West. Big rains now mainly in the early parts of the 6-10 day, possibly drying up in the 8-14 day."
We have some major cold coming down from Canada in around a week, that bears watching.
That pattern is not amplified enough to tap the air cold enough, in N.Canada to bring it all the way south, across the US border right now.
Also, there has been only one big freeze in history this early in the year(1974), so it's extraordinarily rare.. It's takes quite awhile at this time of year for the shorter days in Canada to gradually cool temperatures in order to generate subfreezing temperatures that don't get modified so much headed south that it makes a freeze impossible in the US.
Moist soils also decrease the chance for sub freezing temperatures as they can humidify the dry air in the lowest layer enough to make a difference of up to 10 degrees vs dry soils with clear skies and calm winds and a very dry air mass.
I'm guessing some upper 30's in some of the colder spots right now, which would not do any damage. There would be alot of clouds with this chilly pattern which will cause daytime temps to be much cooler vs average than night time temps.
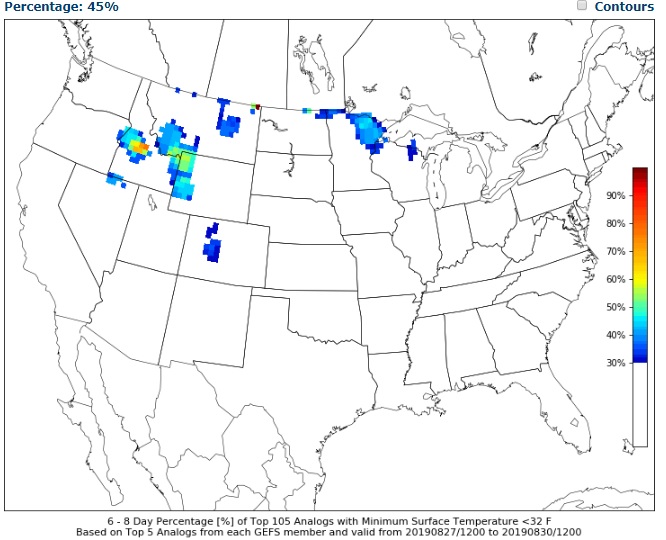
Here are the top 105 analogs using the GFS Ensembles for the upcoming cool snap. The lighter blue shows a 45% chance of sub freezing temperatures in parts of NE Minnesota.
Wow. Thanks Grant!
Where do you get that product from?
http://www.eas.slu.edu/CIPS/ANALOG/analog.php
Now if someone would do one for the EURO. If I knew more about computing I would try. This sight has help tremendously when it comes to long range forecasting. It also helps short range with SVR and winter forecasting. I love analogs!
This is great. Thanks very much.
Looks like that was from the ensemble run almost 24 hours ago, 0z 8/22/19 and it only comes out once a day. It should be updated early tomorrow morning.
I'll have to check to see when that happens.
The 0z and 6z GFS ensembles were colder than the last 2 runs, 12z, 18z for that air mass.
However, the outlier 18z operational......last run has an extreme shot of frigid air(for August) that brings the 522 thickness line down to south/central Ontario or around 400 miles north of Lake Superior in around 11 days.
This is unlikely based on it being the outlier right now but it would result near record cold for Ontario for the first few days in Sept.
This would put air plenty cold enough for a freeze within striking distance (5-600 miles)of hitting parts of the Plains and Midwest, if the flow pattern cooperated farther south.......but by day 11, the pattern in the US is not as favorable to transport cold farther south the way it is several days previous to that, starting early next week.
This is the result of an extreme amplification of a chunk of northern stream energy that drops south from N.Canada, starting a couple of days before that(end of August).
So what we would need, is this huge piece of northern stream energy to come south from Canada around 5 days earlier.........by early/middle of next week. At that time, the cold could be picked up and driven farther south by a pattern much more favorable in S.Canada, well into the US for cold to penetrate deeply.
By day 11, the flow pattern/jet stream along the border has become zonal and cold from Canada will not be able to plunge as far south as it can, let's say on days 5-8.
This is what the 500 mb pattern looked like on September 1, 1974 for the earliest freeze in history that affected the Cornbelt.
Deep upper level low centered around the Hudson Bay and extended to the US border.
https://www.esrl.noaa.gov/psd/data/composites/hour/


These were the temperatures early the mornings of September 1, 2, and 3rd of 1974 in Kelvin.
273 K = 0 deg. C = 32 deg. F
Interesting to see how much cold air there was(For Sept. 1st) from Siberia, across the Arctic, south thru Canada, then into the northern tier of the US......which comes south and moderates a bit on Sept. 2, 3 and 4.
https://www.esrl.noaa.gov/psd/data/composites/hour/
We should also note from this and the previous 500 mb map, how EXTREME the pattern was for the planet. This defined the global cooling years of the 1970's. While it was extremely cold on our part of the planet, it was just as extremely HOT in Europe and Asia. We have been sold on the climate crisis causing more extreme weather but with regards to temperatures that is absolutely NOT true. Yes, we are half of a deg C warmer since then but much of that warming has been to the coldest places and the meridional temperature gradient has DECREASED since then, so there is less temperature contrast on our planet which in many realms causing LESS extreme weather.
wxgrant, WxFollower and other weather savy folks will look at these maps below and think "Holy Cow, I can't remember seeing an extreme global temperature map like these below!!!"
Their memories would be correct too. Since the internet has existed there have been ZERO weather maps that looked like those below. Not one day. I know because I'v researched. Because climate change has DECREASED the extreme temperature disparity/differential around the planet. Part of this has been caused by the physics of greenhouse gas warming, concentrated in the coldest places/highest latitudes, especially during the coldest times of year/Winter.
Maps for Sept 1,2,3,4 1974 below.


That is impressive.
I think the coldest spots will mainly be in the low 40's right now(and those will probably be north of the main belt). So 10 degrees too warm.
Just too early in the year and the air mass not nearly cold enough/pattern not extreme enough, like 1974.

Next Friday mornings lows only get as cold as the mid-40's along the Canadian border, into ND. It's likely that if skies clear out, that temperatures may get a bit lower than that in the colder places, even a few hundred miles farther south-possibly but there is no serious threat for a damaging frost with the air mass coming in a week from now.
The air cold enough for a freeze will only make it as far south as the area just south of the Southern Hudson Bay Area.......maybe central Manitoba to central Ontario close to freezing.
See updated frost risk and more here. Also I added Sept 4, 1974 to the maps above: