
June 11th......time ticks by faster and faster!!! Do something to make somebody feel loved today! Then, after observing the positive results, make a good habit out of it!
Scroll down and enjoy the latest comprehensive weather to the max...... occurring because of the natural physical laws in our atmosphere.
Forecast is starting to warm up in week 2 as expected but still no major heat in the forecast!! Rains pick up again late this week!! Starting S.Plains then marching east into the S.Cornbelt to S.Ohio Valley, a bit south of the area that had the heavy rains in May. .....continuing into early week 2.
No intense heat but warming up, starting late this week and continuing thru week 2.
Update: 12z models were quite a bit warmer than yesterday at this time.
Here are the latest hazards across the country.
Purple/Pink/blue on land is cold/Winter weather. Brown is wind, Green is flooding. Gray is fog. Reddish is a red flag advisory.
Go to the link below, then hit the location/county on the map for details.
https://www.spc.noaa.gov/ Go to "hazards"


Wind map Press down on this on the left with your cursor!


Current Jet Stream

| Low Temperatures Tomorrow Morning |

Hot West but on the cool side Midwest to East.
Temperature colors on the maps below still need to be adjusted down to cooler shades.


Highs for days 3-7:
Cool start, then warming to around average. Hot out West.

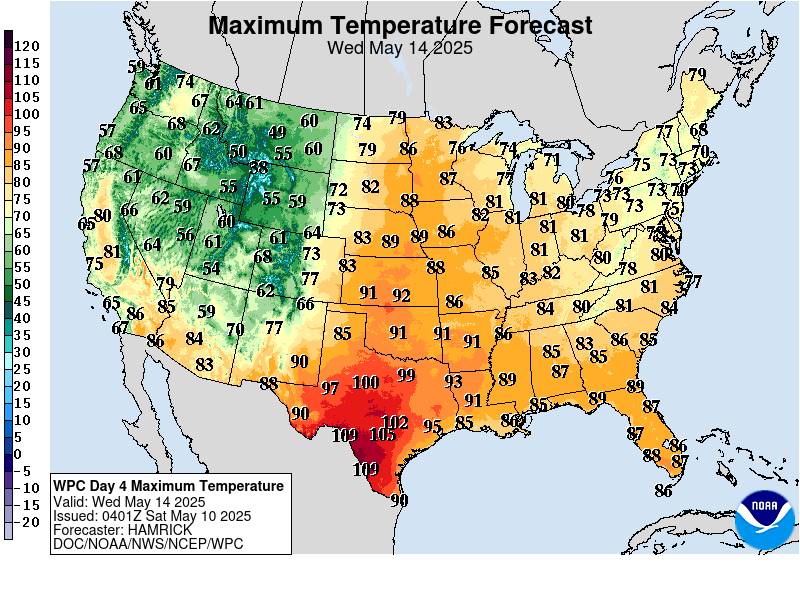


Most of the country on the cool side to start...........except hot West. Then warming closer to average by this weekend.
https://www.wpc.ncep.noaa.gov/medr/medr_mean.shtml
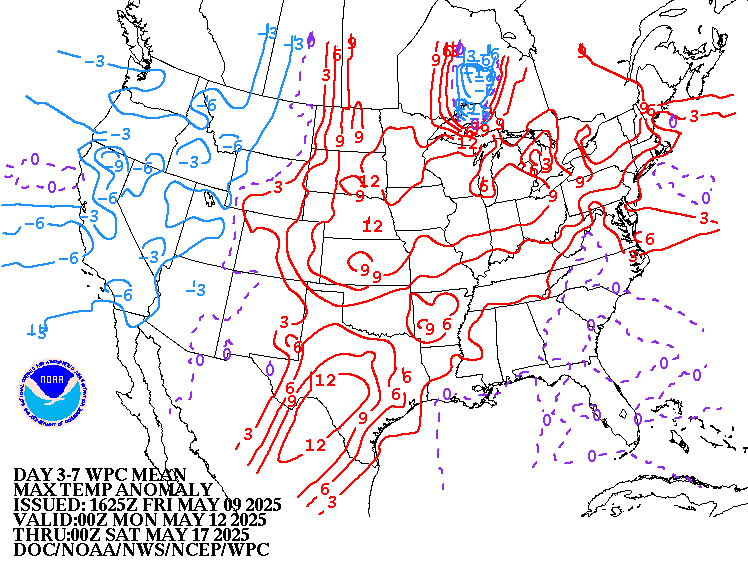
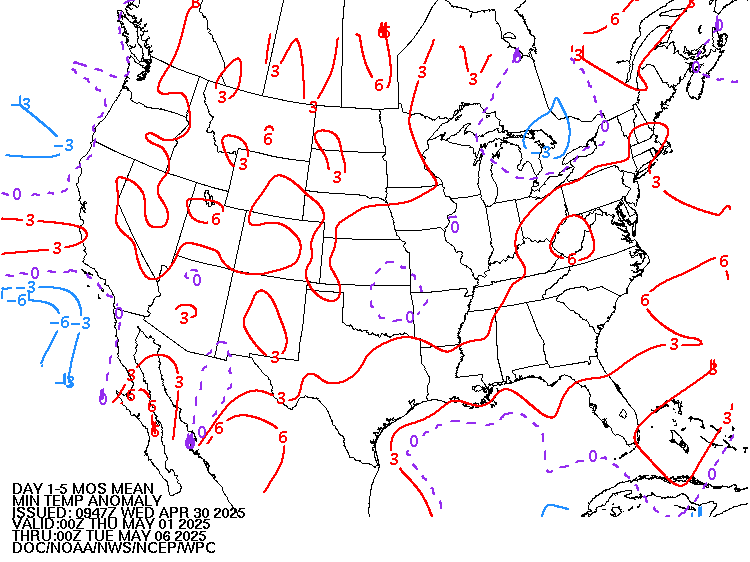
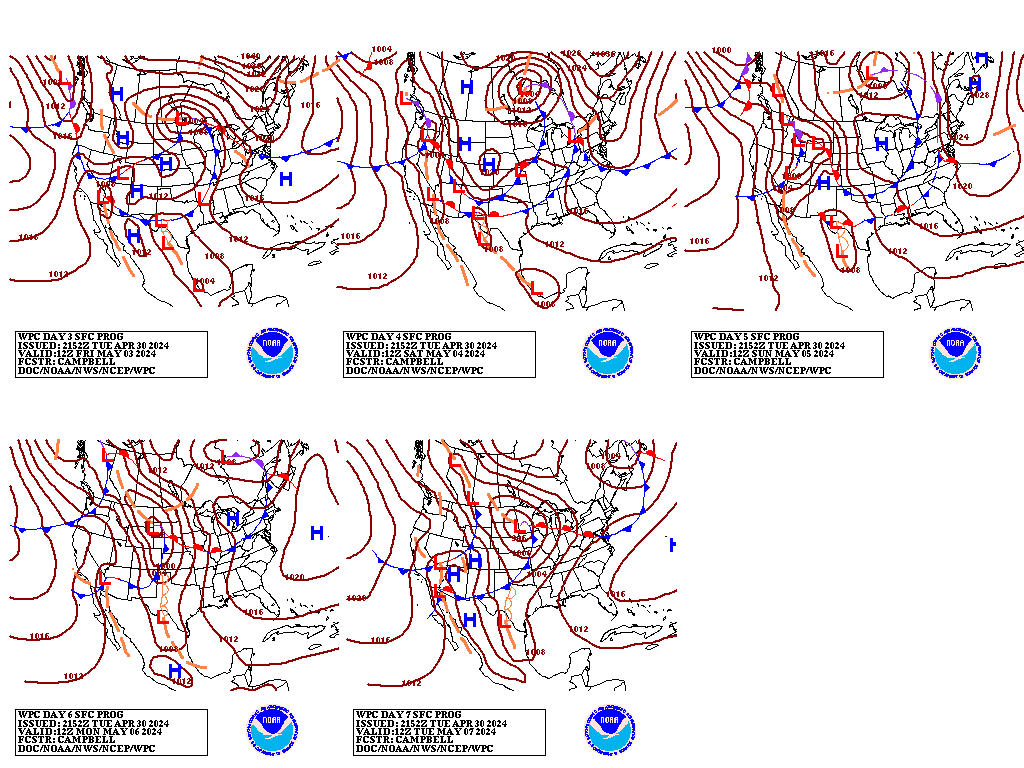
Weather maps for days 3-7 below
Reinforcing cold front in the middle of the week with very cool temps and waning high pressure to start this period.
Wet southern stream system this weekend............heavy rains pick up again S.Plains to southwest Cornbelt late this week and march eastward, continuing this weekend and more early next week.....a bit farther south from the heavy May rains.
Liquid equivalent precip forecasts for the next 7 days are below.
Scattered rains with Midwest cold front.........then, the next southern stream big rain maker shows up in the S.Plains at the end of this week, into the sw Cornbelt.......moving east to the S. Ohio Valley by this weekend.
I believe that much of this area will be south of the wettest areas in May.
Day 1 below:
http://www.wpc.ncep.noaa.gov/qpf/fill_94qwbg.gif?1526306199054

Day 2 below:
http://www.wpc.ncep.noaa.gov/qpf/fill_98qwbg.gif?1528293750112

Day 3 below
http://www.wpc.ncep.noaa.gov/qpf/fill_99qwbg.gif?1528293842764

Days 4-5 below:
http://www.wpc.ncep.noaa.gov/qpf/95ep48iwbg_fill.gif?1526306162

Days 6-7 below:
http://www.wpc.ncep.noaa.gov/qpf/97ep48iwbg_fill.gif?1526306162

7 Day Total precipitation below:
http://www.wpc.ncep.noaa.govcdx /qpf/p168i.gif?1530796126

Last 24 hour precip top map
Last 7 day precip below that
https://www.wunderground.com/maps/precipitation/daily

Isolated Excessive Rainfall threat today Southeast.
Rains pick up at the end of the week in the S.Plains with some excessive rainfall risk then.
Mesoscale Precipitation Discussions
Current Day 1 Forecast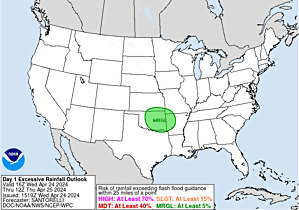 Valid 12Z 04/22/19 - 12Z 04/23/19 |
Day 1 Threat Area in Text Format
| Day 2 and Day 3 Forecasts |
Current Day 2 Forecast Valid 12Z 04/23/19 - 12Z 04/24/19 |
Day 2 Threat Area in Text Format
Current Day 3 Forecast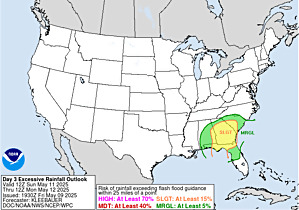 |
Slight risk for a severe storm Plains today.
Current Dew Points
Widespread dry air in place!!!

Latest radar loop
http://www.nws.noaa.gov/radar_tab.php


| (3400x1700 pixels - 2.2mb) Go to: Most Recent Image |

Go to: Most Recent Image
You can go to this link to see precipitation totals from recent time periods:
https://water.weather.gov/precip/
Go to precipitation, then scroll down to pick a time frame. Hit states to get the borders to see locations better. Under products, you can hit "observed" or "Percent of normal"
+++++++++++++++++++++++++++++++++++++++++++++++
Precipitation compared to average for the last 7, 14, 30 and 60 days.
The Cornbelt has been drying out and planting has been catching up.
Usually not updated for previous day until late the next day.
https://www.atmos.illinois.edu/~snodgrss/Ag_Wx.html


Soilmoisture anomaly:
These maps sometimes take a day to catch up to incorporate the latest data(the bottom map is only updated once a week).
Most of the cornbelt has REALLY dried out, with a great deal of planting done in the last week...which will continue for several more days.
https://www.cpc.ncep.noaa.gov/products/Soilmst_Monitoring/US/Soilmst/Soilmst.shtml#


Surprise, surprise, surprise!! Currently, there is 0% of the Cornbelt/Midwest with drought. There is no place even slightly dry there. It has been dry(and very warm/hot) in the Southeast though which has some drought. The Southeast drought has really increased AGAIN on the June 6 update!!!! However, there was some nice drought relief recently that should show up on the next update.
The map below is updated on Thursdays.
The market will be STILL be keying on precip forecasts for planting concerns for the next couple of weeks.
https://droughtmonitor.unl.edu/

The top map is the Canadian ensemble average, the maps below are the individual members that make up the average at the end of week 2.
+++++++++++++++++++++++++++++++++++++++++
Each member is like the parent, Canadian model operational model.......with a slight tweek/variation in parameters. Since we know the equations to represent the physics of the atmosphere in the models are not perfect, its useful to vary some of the equations that are uncertain(can make a difference) to see if it effects the outcome and how.
The average of all these variations(ensembles) often yields a better tool for forecasting. It's always more consistent. The individual operational model, like each individual ensemble member can vary greatly from run to run.........and represent an extreme end of the spectrum at times. The ensemble average of all the members, because it averages the extremes.............from opposite ends of the spectrum.........changes much less from run to run.
End of week 2....................0z ensembles:
Analysis starting from a week ago, ending with today:
Last week+ of analysis, starting with the day farthest in the past. This is an end of week 2 forecast!
Last Friday: Still the deep trough along or off the West Coast to possibly the Gulf of Alaska(not as deep today) and the downstream ridging, building into the SouthCentral US(Plains). Weak trough along the East Coast.
Saturday: Like yesterday. Upper level trough just off the West Coast and downstream ridge, possibly a significant heat ridge on some solutions. Rains could shut down under any upper level high downstream and could increase around the periphery from a strong Pacific jet stream implied from the flow coming under the deep West Coast area trough. Not a clear indication of where heaviest rains might or where it will be dry but temperatures look to be warmer than average over almost all of the US.
Sunday: The ensemble mean is more zonal today. There are variations/solutions with opposite extremes that help to offset each other but the mean is not amplified.
Monday: A little more troughing in the Midwest to Northeast on this model, so cooler there today. Still zonal flow for the mean and a weak(er) trough along the West Coast. A positive anomaly in NW Canada.
Tuesday: SIGNIFICANT changes here late in week 2 vs yesterday on this model.....and only this model. Upper level ridge building in the South/Southeast and points northwestward adds alot of heat to the forecast. Strong jet stream tracking out of the Pacific COULD lead to heavy rains around the periphery of the upper level heat ridge.
Wednesday: Similar to yesterday but with less ridging in the South and Southeast............which is what the other........much cooler models have had.
Thursday: Wide spread in solutions. Trough just off the West Coast should be watched for connection to potential increase in heavy rains later in week 2.
Friday: Hardly much change from yesterday but ridging in the Southeast that popped up on Tuesday, continues to go away on this model. Still a trough just off the West Coast. Not a hot pattern. Not a dry pattern.
Saturday: Looking cooler than yesterday on this model with a more pronounced northern stream upper level low Southeast Canada that extends south. Especially in combo with the upper level ridge in NW Canada to Alaska connection. Still a trough along or just off the West Coast. Will an upper level ridge build in the far south and a zone of heavy rains along the periphery of the ridge emerge?
Sunday: Upper level trough along the West Coast, which will modulate the jet stream aimed towards the midsection. Ridge to the south will determine where organized storm events form...........around the periphery. Much warmer in the Midwest/East than yesterday on this model with the northern stream influence not there on as many solutions.
Monday: Strong zonal flow on the mean below in the northern half of the country. Will a heat ridge build south of that(southern 1/3rd)? This model, contrasting to the others actually looks cooler at the end of week 2 with a deeper trough in the East.
Tuesday: More heat ridge building in the Plains on this model today.
360h GZ 500 forecast valid on Jun 26, 2019 00 UTC
0Z GFS Ensembles at 2 weeks:
Analysis, starting with the oldest, ending with the most recent:
Last Friday: Still a great deal of variation with solutions. Best agreement might be upper level ridge in the Plains and upper level low somewhere in the vicinity of the PAC Northwest.
Saturday: Watching the West Coast trough/low and strong Pacific jet stream associated with that to tell us whats coming for mid June and beyond. Temperatures look quite warm over much of the country with no northern stream interactions.
Sunday: Trough along the West Coast less significant as well as down stream ridging less. Trough in the Northeast significant on half the solutions.
Monday: Not very decisive.
Tuesday: Not as significant with the heat ridge in the Southeast as the Canadian ensembles. A big spread in solutions.
Wednesday: Could it turn wet again late in week 2? No major heat even though a few try to build a heat ridge in the south to southeast.
Thursday: Looks pretty wet later in week 2. The 12z run was WARMER.
Friday: Widespread in solutions, especially with regards to the northern stream.
Saturday: A bit cooler today with the northern stream. Watching for the potential to turn wet again.
Sunday: The pick up in rains will actually be late in week 1 and this is a end of week 2 solution............which looks drier but low confidence. Slightly warmer than yesterday at this time frame...........but Saturday was cooler than Friday. There really is nothing that stands out below as remarkable.
Monday: Best chance for a heat ridge is in the deep South. A good case can still be made for below temps in the northern 1/3 to 1/2. The temperature contrast and decent jet stream in between gives high confidence above normal rain signal.
Tuesday: Also more heat ridge building.......location, location, location ???

GFS Ensemble mean(average of all the individual solutions above). The first map is a mid/upper level map. The 2nd one is a temperatures map at around 1 mile above the surface. These are anomalies(difference compared to average). The daily analysis starts with the oldest and ends with the latest.
Last Thursday: Positive anomaly in the N.Plains has weakened. Negative anomaly along the West Coast. Great uncertainty but not as dry overall vs the last few days.
Friday: Weak positive anomaly in the center of the country.........stronger at higher latitudes(Canada). Weak negative anomaly along the West Coast, stronger one in Southeast Canada which mean cool in the Northeast.
Saturday: The decent negative anomaly in Southeast Canada has filled in..........so that takes out the northern stream component and makes this high confidence for warmer than average. Negative anomaly along the West Coast is now more significant. This will help to modulate the jet streams location and determine where down stream ridging might be, along with the new zone for rains setting up around the periphery of the potential ridge.
Sunday: A bit of a negative anomaly againt in Southeast Canada might bring cooler air to the Northeast and middle of the country. The rest of the US has had previous anomalies filled in.
Monday: Slight negative anomalies in Southeast Canada, if they grow would be a source of cool air. Negative anomaly along the southern West Coast could steer wet weather and a jet stream towards the Plains.
Tuesday: Huge positive anomaly today in N/C Canada (and smaller one off the Pacific NW) is actually favorable for cooler air below it into the central and Northeastern US.
Wednesday: Notable/strong positive anomaly in Canada with a modest one in Southeast Canada will likely be a source of northern stream cool air. Another modest negative anomaly from the Southwest US towards the C.Plains(with a trough along the southern West Coast........oh,oh, this could represent the makings of more heavy rains..IF another heat ridge builds in the Southeast.
Thursday: Big positive anomaly in N.Canada back to Siberia. Modest negative anomaly Midwest to Northeast and off the Pacific Northwest coast. Favorable for cool in the middle to Northeast and wet.
The 12z run was WARMER!
Friday: Still the positive anomaly in N.Canada and around the Gulf of Alaska/Northeast Pacific. and a modest negative anomaly, one from the northern stream in Southeast Canada(cool air link?) another in the Southwest from the southern stream(potential for rains returning?)
Saturday: Northern stream positive anomaly north Canada to Alaska to Northeast Pacific connects downstream to negative anomaly that has shifted farther southwest into the US today.......N.Plains/Upper Midwest to Southeast Canada...................so a cooler solution.
Sunday. Weaker positive anomaly from NW Canada to the Northeast Pacific. Another slight positive anomaly in the deep south, then an elongated, lengthy west to east negative anomaly in between going from the Southwest across the entire country to the East Coast. That will be associated with the storm track and jet stream.
Monday: The high latitude anomaly is washing out a bit more but still connects with delivering cooler air downstream. Positive anomaly in the deep south supports upper level ridging. Elongated negative anomaly across the northern 1/3rd will be associated with our jet stream and storm track.......and wet weather, which will also feature cool temperatures.
Tuesday: Negative anomaly sealed off in the Pac Northwest today with upper level heights rising downstream...........ridge building, so we are warmer in the central US(not as cool as recently) and to the south. Weak negative anomaly MidAtlantic, so maybe some cool forcing.
NCEP Ensemble t = 360 hour forecast
Latest, updated graph/forecast for AO and NAO here, including an explanation of how to interpret them.
Previous analysis, with the latest day at the bottom for late week 2 period.
Last Friday: AO, NAO, PNA all a smidgeon less than 0. Nothing to write on a forum about.
Saturday: All 3 are slightly negative again. Nothing they can tell us, other than nothing extreme and chilly weather is unlikely.
Sunday: All 3 near to just less than 0. Nothing except to suggest less chance for anything extreme.
Monday: AO, NAO and PNA all slightly negative............nothing to read from these indices other than lessening the risk for an extreme pattern.
Tuesday: A change. AO and NAO now more negative and PNA positive would suggest cooler air from high latitudes has a better path towards middle latitudes in the middle of the country............but there is great uncertainty.
Wednesday: AO is slightly negative again with a pretty negative NAO and slightly positive PNA means COOL is very likely.
Thursday: AO slight negative. NAO moderatly negative, PNA positive. Favors widespread cool in the middle to eastern US.
Friday: Negative AO and NAO suggest cool air. PNA a tad positive.
Saturday: Negative AO, especially negative NAO(means high confidence cool signal) and near 0 PNA.
Sunday: Pretty big changes. AO climbs back to near 0. NAO much higher than previous days and climbs towards zero at the end of the period. For sure this SUGGESTS that the cold forcing from the northern stream will be subsiding. PNA is solidly positive.
Monday: AO and NAO near zero(from recent negative that was connected to cool temps-so no longer a cool influence). PNA is positive, still a cool influence for the Midwest and East.
Tuesday: All close enough to 0 to not be huge. However, recently they were favorable for cool temps and this means that influence will be easing...........which suggests warmer at the least.
National Weather Service 6-10 day, 8-14 day outlooks.
Updated this afternoon.
Heat will be in the deep south(along the Gulf Coast), the northern part of the country the coolest.
Widespread above average rains in between!
Tuesday morning: Still looks wet over much of the country but the changes, I feel will start filling in the areas of below normal temps in the middle of the country and expanding the areas of above temps.
Tues PM comment. The heat does expand slightly in the south from yesterday and the NWS takes the above temps well up the East Coast. However, they remain very cool in the middle of the country. Widespread heavy rains with a few excessive events will be the most noteworthy weather during the 6-10 day period. The areas most likely to get hit is shown below these maps.
Temperature Probability
| the 8-14 day outlooks ArchivesAnalogsLines-Only FormatGIS Data | |
Temperature Probability | |
 | |
From Craig Solberg:

Simply amazing; past 12 months the wettest on record for the Nation and EASILY the wettest on record for the Corn Belt. Precipitation 8.53" above normal for 1902/03 in the Corn Belt simply PALES in comparison to our most recent 12 month period...an incredible 13.88" above normal


Craig Solberg @CraigSolberg Jun 7
Whatever the corn planting progress number is on Monday...this is what it will compare to:

Previous discussion:
Re: Re: Re: Re: Re: Re: Re: Re: Re: Re: Re: grains
By metmike - June 1, 2019, 7:22 p.m.
To mcfarm who lives in Indianapolis:
Here are the rains the next 9 days, most of them from next weeks system.
It would be one thing if they fell quickly in one day........and we had alot of run off .......which is bad enough. However, falling over a 3-5 day period will maximize soil saturation, even on high ground.
But there is one hope. Look at the sharp cut off I mentioned earlier. Chicago and Detroit may get ZERO rain from this event, while you get numerous inches of rain. IF this system were to track 300 miles farther south, then you would get ZERO rain and areas south of you would get the heavy stuff.
The system is still several days away and the track is not certain. It looks bad for you on most solutions but some of them look good for you.
++++++++++++++++++++++++++++++++++++++++++++++
Re: Re: Re: Re: Weather Sunday
By pll - June 2, 2019, 11:10 a.m.
Planting got back going here Saturday I think a good chunk of ground here in ECIL will get planted before next rain comes except for the real wet fields
++++++++++++++++++++++++++++++
Re: Re: Re: Re: Re: Weather Sunday
By metmike - June 2, 2019, 12:26 p.m.
Thanks pll!
+++++++++++++++++++++++++++++
By metmike - June 3, 2019, 1:02 p.m.
12Z GFS MUCH warmer and more CDD's with heat ridge in the East.....might be an outlier.
By WxFollower - June 3, 2019, 1:34 p.m.
12Z GEFS said it is an outlier. NG back down on that from what I can tell.
+++++++++++++++++++++++++++++++++++
By metmike - June 3, 2019, 1:36 p.m.
Absolutely agree Larry!
Here's what that outlier,12z operational GFS looked like:
Actually, it's very similar to the Summer of 1993! Again, an outlier at this point. The Canadian ensembles moved slightly in that direction and with an upper level trough along the West Coast, there is the potential for amplification similar to this last GFS operational model("potential" is often the reason for outlier solutions, when they over amplify a feature)
The outlier late week 2 pattern features a huge heat ridge in the East and jet stream configuration very similar to 1993.
++++++++++++++++++++++++++++++++++++++++++++++++++++++++++++++++++
Re: Re: Re: Re: Re: Weather Monday
By metmike - June 3, 2019, 3:28 p.m.
The 12z Euro is an outlier in the complete opposite direction. It has a huge heat ridge from the West Coast, across the Rockies to the N.Plains that completely shuts down all of the rain, except for heavy rains in the Southeast over the drought areas, where it would be welcome.
The GFS had the heat ridge in the East, exactly where the EURO has an upper level trough and very cool temps with hot HUMID air streaming north feeding into strong jet coming out of an upper level trough, exactly where the Euro has an upper level ridge.
+++++++++++++++++++++++++++++++++++++++++++++++++++++++
Re: Re: Re: Re: Weather Thusday
By mcfarmer - June 6, 2019, 1:11 p.m.
Perfect corn weather here.
+++++++++++++++++++++++++++++
Thanks mcfarmer. I know that you sold some corn earlier on one of our spikes higher. We could make new highs later this Summer but you have to feel pretty dang good about your crop in IA right now. What country is that.?
+++++++++++++++++++++++++
By wglassfo - June 7, 2019, 7:03 p.m.
Our local weather forcast shows 30% chance of rain on June 9 increasing to 80% on June 10 [Great Lakes]
June 10 is the cut off date anybody will plant corn and have any hope of missing frost. Assuming normal to good growing conditions, that is still taking a chance on frost and the latest we have ever planted corn. One customer has bu sold and not enough planted to fill contracts, thus the worry.
We planted beans today on the only dry ground we had
So: To make it interesting
We have 200 plus acres that everybody wants planted on June 9 before the June 10 rain
Even more frustrating they want to start at 12 o'clock noon, June 9 to let the soil dry as much as possible
This is scattered over 4 plots of ground 15 miles apart with one plot only 10 acres but the closest to our home farm. The largest is 100 acres of touch and go clay ground but our sweet corn customer. Our most important customer with 700 acres of total custom work
No way can we please everybody as it takes time to move from farm to farm
If we miss June 10 rain then everybody is happy but with the recent rains, every 3 days, nobody wans to be left out
Our last rain was Wednesday
I have no idea if that 200 acres will be dry but the phone lit up today.
++++++++++++++
By metmike - June 7, 2019, 11:16 p.m.
Thanks Wayne.
I hope you miss the rain but chances start increasing for you late on June 9th and look pretty likely on June 10th.
The map below is at the end of the day June 9th with 24 hour rains that day, followed by the end of June 10th with 24 hour rains...............looks bad on June 10th, probably starting the night before.........but things can change.
Here we go again!!!!! This is the week 2 part of the forecast. Heavy rains will start just prior to this.
The stronger the ridge is to the East, the greater the chances for this to turn into an amplified, blocking pattern vs a heat ridge from TX across the Gulf States with an active jet stream along the periphery featuring clusters of heavy rain producing storms every time a wave moves thru.
