It's a Great May 19th!!! Do something to make somebody feel loved today! Then, after observing the positive results, make a good habit out of it!
Scroll down and enjoy the latest comprehensive weather to the max...... occurring because of the natural physical laws in our atmosphere.
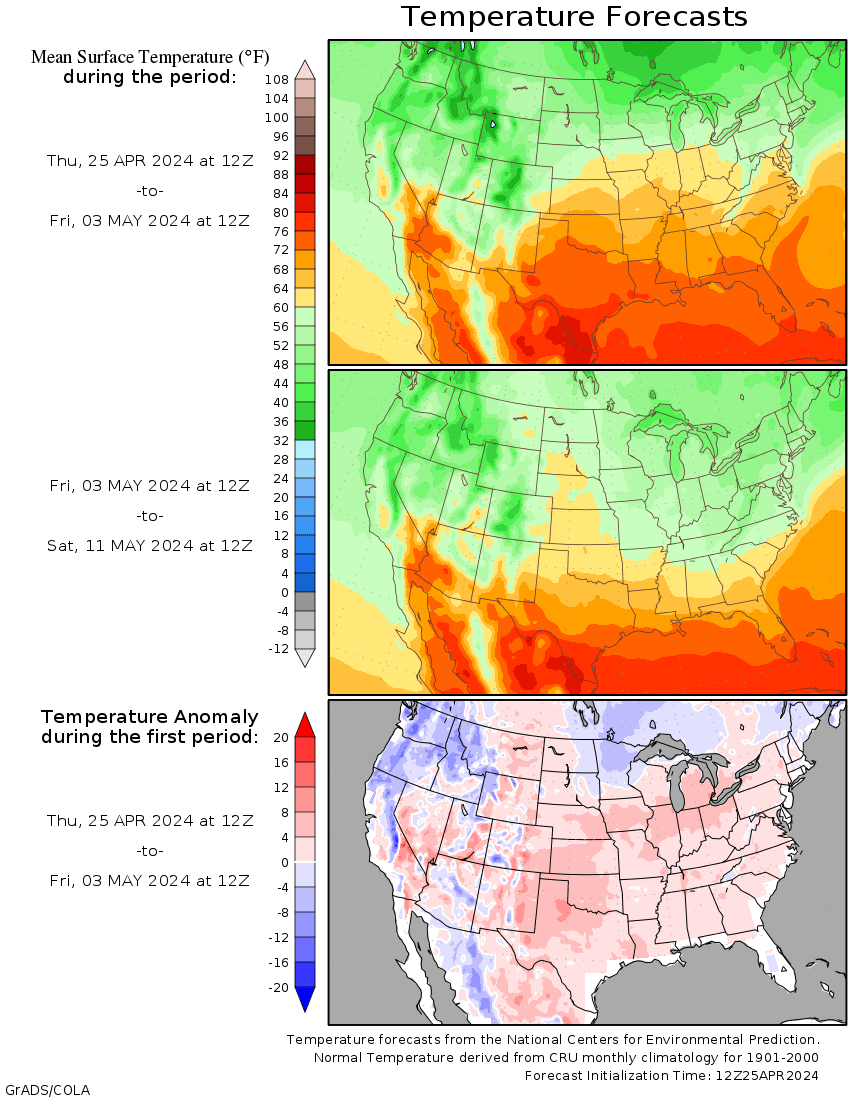
Heat ridge in the Southeast(near 100 degree heat far Southeast this week) The core of the heat ridge is tenacious. .
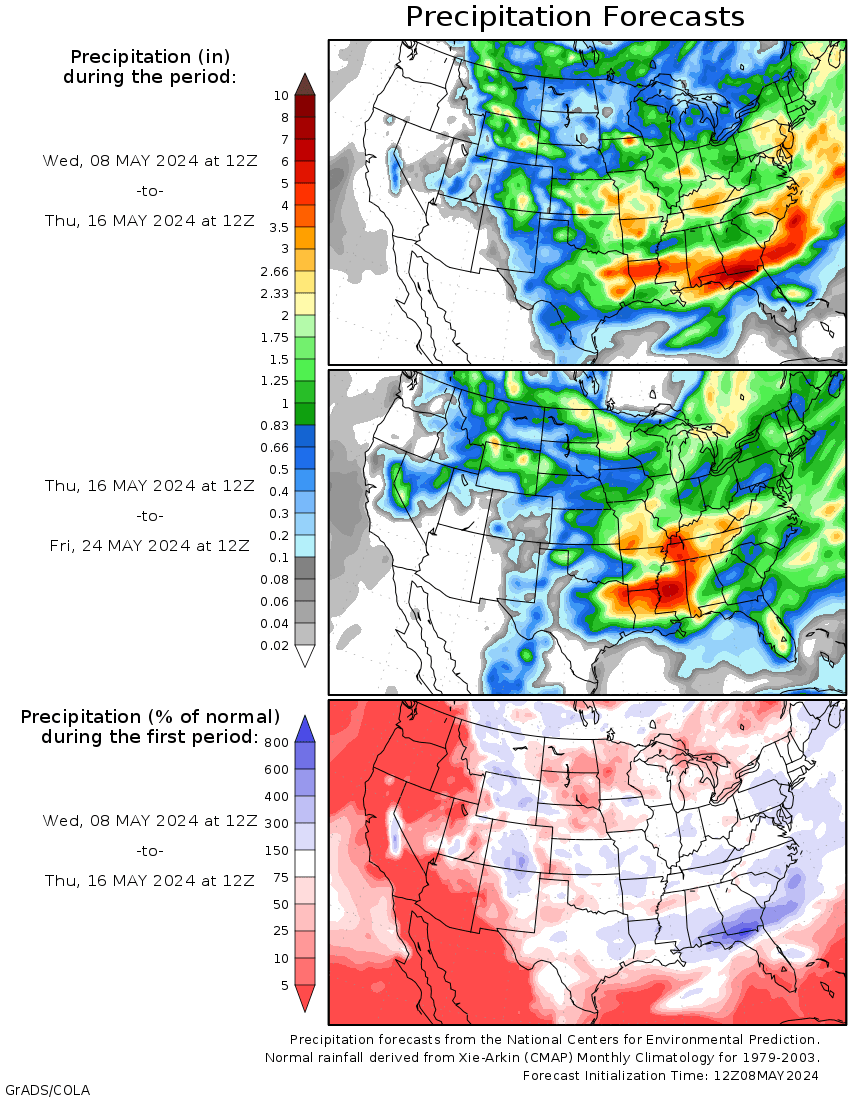
Stormy and wet weather ahead. Up to a foot of rain in the next 2 weeks in some spots around the northwest periphery of the heat ridge...........s.IA to e.KS to n.OK/TX, favored for highest totals. Least amounts in the Eastern Cornbelt(not that much this week, along with heat)
Here are the latest hazards across the country.
Purple/Pink/blue on land is cold/Winter weather. Brown is wind, Green is flooding. Gray is fog. Reddish is a red flag advisory.
Go to the link below, then hit the location/county on the map for details.
https://www.spc.noaa.gov/ Go to "hazards"


Wind map Press down on this on the left with your cursor!


Current Jet Stream

| Low Temperatures Tomorrow Morning |

Heat hits the East Coast. First 90+ of the season in many places there. Cooler in the Midwest.
Temperature colors on the maps below still need to be adjusted down to cooler shades.


Highs for days 3-7:
Major heat wave in the Southeast. 100 late next week, lasting several days. Close to all time May records! Some of that heat expands out into the Eastern Cornbelt, briefly just north of there. Cool N.PLains and westward.


Red warm anomalies southeast to Eastern Cornbelt(HOT far Southeast), cold blue anomalies N.Plains to Southwest.
Lots of weather action in between( very unwanted rains).
https://www.wpc.ncep.noaa.gov/medr/medr_mean.shtml


Weather maps for days 3-7 below
New potent thermal boundary/front sets up that acts as a focus for waves of heavy thunderstorms.............around the west/northwest periphery of the intense heat ridge, especially Western Cornbelt back to the Plains . Blistering heat in the Southeast.
Heat ridge may expand at times next week with very warm air surging north in the S. Midwest to Eastern Cornbelt.

Last 24 hour precip top map
Last 7 day precip below that
https://www.wunderground.com/maps/precipitation/daily


Liquid equivalent precip forecasts for the next 7 days are below.
Hefty totals!! Places from s. Iowa to Kansas to n. OK/TX WILL see the most rain(6+ inches this week). Eastern Cornbelt gets much less rain and may actually dry out with heat.
Day 1 below:
http://www.wpc.ncep.noaa.gov/qpf/fill_94qwbg.gif?1526306199054

Day 2 below:
http://www.wpc.ncep.noaa.gov/qpf/fill_98qwbg.gif?1528293750112

Day 3 below
http://www.wpc.ncep.noaa.gov/qpf/fill_99qwbg.gif?1528293842764

Days 4-5 below:
http://www.wpc.ncep.noaa.gov/qpf/95ep48iwbg_fill.gif?1526306162

Days 6-7 below:
http://www.wpc.ncep.noaa.gov/qpf/97ep48iwbg_fill.gif?1526306162

7 Day Total precipitation below:
http://www.wpc.ncep.noaa.govcdx /qpf/p168i.gif?1530796126

Excessive Rainfall Forecasts-highest threat WCB to C/S Plains this week!!
Mesoscale Precipitation Discussions
Current Day 1 Forecast Valid 12Z 04/22/19 - 12Z 04/23/19 |
Day 1 Threat Area in Text Format
| Day 2 and Day 3 Forecasts |
Current Day 2 Forecast Valid 12Z 04/23/19 - 12Z 04/24/19 |
Day 2 Threat Area in Text Format
Current Day 3 Forecast |
Severe Storm risk-moving around-highest Plains to Western Cornbelt.
Current Day 1 Outlook | Forecaster: Thompson/Squitieri Issued: 20/1624Z Valid: 20/1630Z - 21/1200Z Forecast Risk of Severe Storms: No Svr Tstms |
Current Day 2 Outlook | Forecaster: Broyles Issued: 20/0546Z Valid: 21/1200Z - 22/1200Z Forecast Risk of Severe Storms: Marginal Risk |
Current Day 3 Outlook | Forecaster: Broyles Issued: 20/0711Z Valid: 22/1200Z - 23/1200Z Forecast Risk of Severe Storms: Marginal Risk |
Current Day 4-8 Outlook |
Current Dew Points
Decent moisture feeding north from the Gulf.

Latest radar loop
http://www.nws.noaa.gov/radar_tab.php


| (3400x1700 pixels - 2.2mb) Go to: Most Recent Image |

Go to: Most Recent Image
You can go to this link to see precipitation totals from recent time periods:
https://water.weather.gov/precip/
Go to precipitation, then scroll down to pick a time frame. Hit states to get the borders to see locations better. Under products, you can hit "observed" or "Percent of normal"
+++++++++++++++++++++++++++++++++++++++++++++++
Precipitation compared to average for the last 7, 14, 30 and 60 days.
The Cornbelt has had way too much rain. We will be drying out(but not completely dry) for the next several days adding in some heat. Stormy weather returns late week.
Usually not updated for previous day until late the next day.
https://www.atmos.illinois.edu/~snodgrss/Ag_Wx.html


Soilmoisture anomaly:
These maps sometimes take a day to catch up to incorporate the latest data(the bottom map is only updated once a week).
Some places have dried out enough to plant but its still too wet in other places. Heat in the forecast, especially Eastern Cornbelt will help drying but more big rains are on the way, mainly for the west and central belt.
https://www.cpc.ncep.noaa.gov/products/Soilmst_Monitoring/US/Soilmst/Soilmst.shtml#
![]()


Currently, there is 0% of the Cornbelt/Midwest with drought. There is no place even slightly dry there. It has been dry(and very warm) in the Southeast though which has some drought. The Southeast drought will be expanding/worsening during the next week.
The map below is updated on Thursdays.
The market will be keying on precip forecasts for planting concerns for the next month.
https://droughtmonitor.unl.edu/

The ideal time frame for planting corn is now. The market is scrutinizing the 2 week forecasts every day.
This operational GFS model product is updated every 12 hours. The GFS is updated every 6 hour but this product is only updated for the 0Z and 12Z run. This is just 1 run, from 1 model. The week 2 portion is often volatile/changeable.
The top map is the Canadian ensemble average, the maps below are the individual members that make up the average at the end of week 2.
+++++++++++++++++++++++++++++++++++++++++
Each member is like the parent, Canadian model operational model.......with a slight tweek/variation in parameters. Since we know the equations to represent the physics of the atmosphere in the models are not perfect, its useful to vary some of the equations that are uncertain(can make a difference) to see if it effects the outcome and how.
The average of all these variations(ensembles) often yields a better tool for forecasting. It's always more consistent. The individual operational model, like each individual ensemble member can vary greatly from run to run.........and represent an extreme end of the spectrum at times. The ensemble average of all the members, because it averages the extremes.............from opposite ends of the spectrum.........changes much less from run to run.
End of week 2....................0z ensembles:
Analysis starting from a week ago, ending with today:
Last week+ of analysis, starting with the day farthest in the past. This is an end of week 2 forecast!
Last Saturday: Extreme variations and spread in the individual members yielding completely opposite solutions. This makes the mean of low less value because the majority DON'T show that particular pattern........they show something on one side or the other of the mean. So, possibly one extreme camp will be correct and the other will morph in that direction the next few days???? It's a result of the big battle between the long lived northern stream and southern stream flows, with amplification in week 2 and position of the large scale features at that time determining which one might win out. The Canadian model actually has more northern stream today (but still not a majority) vs the GFS below, which is the opposite of their positions yesterday. Only a minority have the big heat ridge building that is much more prevalent on the GFS.
Sunday: Heat ridge solutions in the southeastern 1/3rd (to larger) of the country rule today. How will the Pacific jet stream interact? Will it erode the heat ridge? Break the northern half down? Ride the periphery with the main ridge holding? Is the heat ridge that develops in week 1 just going to just be transient?
Monday: Pattern change time? Tons of uncertainty. How strong will a heat ridge be in the south and where will it locate? Powerful jet from the Pacific. Where will it track? The northern stream will be shifting around too. Potential for heavy rains around the periphery of a heat ridge with the large scale features lined up right.
Tuesday: Wide spread/disparity.
Wednesday: Vast majority have the heat ridge in the Southeast, with hot/and dry over the Southern 1/3 of the country. Deep trough or upper level low along the West Coast and strong jet stream aimed towards the middle of the country, over the top of the ridge acting to trigger active weather.
Thursday: Around half of the members keep the huge heat ridge going in the Southeast. Half break it down. They will be one of the keys to determine where the strong Pacific jet stream coming in will travel. Potential for a lot of rain when it encounters warm humid air being pumped in by the heat ridge.
Friday: Majority keep the heat ridge going in the Southeast. Very strong jet stream coming from the Pacific.
Saturday: Canadian ensembles shift the Southeast heat ridge farther to the west. Still a strong jet stream across the country, with possibly more zonal, progressive (but active) flow if the blocking heat ridge is displaced from its long lived home in the Southeast.
Sunday: Some solutions keep the long lasting heat ridge in the Southeast alive...........others, obliterate it.
360h GZ 500 forecast valid on Jun 03, 2019 00 UTC


0Z GFS Ensembles at 2 weeks:
Analysis, starting with the oldest, ending with the most recent:
Last Saturday: Over half the members have a heat ridge somewhere between the S.Plains to Southeast, with a northern stream that gets bumped northeast and almost out of the picture, especially compared to yesterday. Stay tuned for changes.
Sunday: Individual solutions for the end of week 2 are as polarized as our political parties (-:
Monday: Will there be a heat ridge left from earlier and where might the location be? The Southeast is favored....slightly.
Tuesday: Heat ridge more bullish today.
Wednesday: Heat ridge in the Southeast a bit less bullish today at the end of 2 weeks........on this model, with much more cooling spreading east across the northern tier.
Thursday: Heat ridge in the Southeast still pretty impressive with active weather around its perimeter. Will it erode from the north?
Friday: How strong and how long for the tenacious heat ridge in the Southeast?
Saturday: Will the heat ridge move? Will the jet stream migrate north? Is a pattern change coming up? This is possible.
Sunday: Demise of the long lived Southeast heat ridge on the vast majority late week 2.

GFS Ensemble mean(average of all the individual solutions above). The first map is a mid/upper level map. The 2nd one is a temperatures map at around 1 mile above the surface. These are anomalies(difference compared to average). The daily analysis starts with the oldest and ends with the latest.
Last Saturday: The long lived northern stream couplet of positive anomalies in the high latitudes coupled downstream to negative anomalies in Southeast Canada/Northeast US may be getting disrupted. At the very least, the growing positive southern stream anomaly in the middle of the country may deflect northern stream influence to the north. This is a result of a building heat ridge. Still a negative southern stream anomaly in the Southwest (trough of low pressure), coupled with the down stream upper level ridge/positive anomaly, under that right conditions can lead to excessive rains around the periphery of the ridge( especially if it sets up in the Southeast) or could shut down the rains underneath it for much of the Cornbelt if it sets up farther northwest.
Sunday: Long lived northern stream influence looks to be fading and migrating north as a building positive anomaly takes over in the Eastern half of the US and brings heat(except maybe the far Northeast). How the negative anomaly in the west interacts with the upper level high is uncertain with regards to exact location of the large scale features but confidence is high for heat in a large area(dry under the center of the heat ridge) and wet around the periphery.
Monday: Anomalies in the US don't help much, mainly because the contrasting individual solutions offset each other when averaged out. When you have this, you have uncertainty.
Tuesday: Positive anomaly from building heat ridge eastern half of the country.
Wednesday: Still the positive anomaly from the heat ridge in the Southeast part of the country but less pronounced today.
Thursday: Still positive anomaly in the East, negative anomaly in the West. This spells warmth east, chilly west. Wet for much in between(dry Southeast).
Friday; Key negative anomaly in the Southwest which will aim the jet stream downstream. Where it gets aimed will be determined by the location of the heat ridge in the Southeast, where there are still modest positive anomalies.
Saturday: Modest position anomaly shifts west of Southeast, still decent negative anomaly in the West, a bit farther north now and potentially leading to the jet stream shifting north.
Sunday: Positive anomaly shifting to the Plains out of the Southeast. Still the negative anomaly along the West Coast that will be associated with Pacific jet stream energy.
NCEP Ensemble t = 360 hour forecast 
Latest, updated graph/forecast for AO and NAO here, including an explanation of how to interpret them.
Previous analysis, with the latest day at the bottom for late week 2 period.
Last Saturday: Still negative AO with the high latitudes not changing a great deal but NAO increases a bit. Mid latitudes could be changing, with potential for more warming from the south in a manner that these indices are not designed to capture well(since they are NORTHERN stream flow indicators). PNA a tad positive.
Sunday: AO and NAO increasing to almost 0 near the end of week 2(after being solidly negative for a couple of weeks)...........suggesting a pattern change that takes out the northern stream influence that has been around for quite some time. PNA near 0.
Monday: AO and NAO increasing. PNA decreasing. Pattern change?
Tuesday: AO and NAO increasing but stay a bit negative. PNA plunging to negative.
Wednesday: AO increases back to near 0. NAO, PNA slightly negative. Nothing strong to key on as indicators.
Thursday: AO, NAO, PNA all slightly negative.
Friday: AO increases to near 0. NAO and PNA slightly negative.
Saturday: The same as yesterday. It's getting to the warm season when these indices are not much help anyway.
Sunday: A0 up to 0, NAO and PNA a bit negative.
National Weather Service 6-10 day, 8-14 day outlooks.
Latest morning thoughts, starting with the oldest down to the newest:
Last Wednesday: Looking to see how much rain returns in the later period(from the west) and heat building again in the Southeast.
Thursday: How long will the dry weather in the 6-10 day hold on to the Eastern Cornbelt? Temps should start warming in the 8-14 day.
Friday: Wetter in the west into the Plains, drier in the Eastern Cornbelt/East. Temperatures uncertain trend.
Saturday: Should be pretty wet again but this is dependent on where a potential heat ridge sets up. The GFS products have been pretty gung ho on the heat ridge the past 24 hours vs the European model but todays extended NWS products should continue to turn up the heat in the eastern half, while staying cool West.
Sunday: Look for heat to increase and be dominant in the eastern half. Cool in the west. More reain west, less east.
Monday: For sure heat Southeast half/cool Northwest in the 6-10 day and more rains northwest, less East. Regardless of what the 8-14 day shows today, I wouldn't put much faith in it.
Tuesday: Look for the heat to build!
Wednesday: Same theme. Huge heat in the Southeast half, chilly Western half. Wet western 2/3rds, dry eastern 1/3rd. Latest maps spread more cooling east across the northern tier but may not show up in the NWS extended this afternoon.
Thursday: Very close to Wednesday.
Friday: A new day, the same outlooks. Hot/dry Southeast/very warm outward. Cool West. Very wet in between.
Saturday: Could be seeing some shifts after today in these outlooks (8-14 day) but probably not this afternoon yet.
Sunday: Should start seeing these outlooks cool down(less heat) the Southeast, starting with the 8-14 day.
Temperature Probability | |
Precipitation Probability | |
| the 8-14 day outlooks ArchivesAnalogsLines-Only FormatGIS Data | |
Temperature Probability | |
 | |
Craig Solberg @CraigSolberg 1h1 hour ago
Last 11 months for the Corn Belt...wettest on record (2016 ranks as number two followed by 1994, 1973, and 2011)

Craig Solberg @CraigSolberg 1h1 hour ago
Like March...PDSI for April in the Corn Belt highest ever Makes case that the Corn Belt is wetter than it has EVER been for this time of year (glass half empty)? Makes case the Corn Belt has the best soil moisture conditions ever going into a growing season (glass half full)?

Craig Solberg @CraigSolberg 19h19 hours ago
Historical national corn planting progress figures as of May 12 (since 1987)

CPC's monthly outlook for June 2019 shows cool in the Plains and wet there into the Western Corn Belt.


Previous discussion:
Re: Re: Re: Re: Weather Sunday
By bcb - May 12, 2019, 12:26 p.m.
I'll call the corn market higher tonight. IL. is dead with planting progress.
Remember S.D and N.D. was going to plant 1.6 mil acres more of corn than last yr. too.
Trade will watch weather real close now that were at the May 15th date.
PP acres here we come
+++++++++++++++++++++++++
By metmike - May 13, 2019, 11:23 a.m.
Sorry bcb,
I didn't see this post because it was wedged in between my weather maps yesterday.
We added alot of heat to the forecast on Sunday for fast drying and rains hold off long enough for many areas to catch up planting.........as the market looks ahead.
Planting progress number tonight will be bullish though, reflecting your observations. However, the market will see 80's for several days in IL, starting later this week allowing producers to finally do some planting.
Good point on the Dakotas. This is where the new zone of heavy rains could set up........to the Upper Midwest, next weekend. That would turn corn bullish again and may already be supporting us off the lows on Monday Morning.
++++++++++++++++++++++++++++++++++++++++++++++
Re: Re: Re: Re: Weather Monday
By metmike - May 13, 2019, 5:12 p.m.
Planting number on corn at just 30% did come in bullish vs 35% expectations:
https://www.marketforum.com/forum/topic/30094/
+++++++++++++++++++++++++++++++++++++++
Re: Re: Re: Re: Weather Wednesday
By metmike - May 15, 2019, 2:06 p.m.
The extremely wet GFS operational models overnight(that spike corn higher on Tuesday Night), in the late morning 12z run on Wednesday, shifted the heaviest rains northwest, mostly out of IL, except for the very far northwest and dropped 2 week totals a bit there. This led to the sell off in corn Wednesday late morning/early afternoon.
Re: Re: Re: Re: Weather Thursday
By mcfarm - May 16, 2019, 6:25 p.m.
just an update on today's fiasco....weather guy says 20% tomorrow then cleat thru sat...this is it...this is our window to plant the entire crop....1 hour ago a non predicted storm with tennis ball size hell and rain with intensity I have not seen maybe forever...nearly and inch in 2o minutes, still raining....what a great window to plant in with the so called "heavy stuff" coming next week...been thru some tough ones but this planting season has been miserable
++++++++++++++++++++++++++++++++++++++++++++++++++++
Re: Re: Re: Re: Re: Weather Thursday
By metmike - May 16, 2019, 8:04 p.m.
Unfortunately, I was thinking about you late yesterday and today when this wave along the approaching warm front showed up and added rains for today to the ECB mcfarm.
Here are the last 4 runs of the GFS operational model below, starting with the most recent one that finished at 6pm. The ones below that each, go back 6 hours in time.
The bright pink is 10 inches of rain. You can see the area keeps moving around with each run. The last one has pulled back a bit to the west, the huge rains in IN/IN on the mega bullish run from 6 hours ago but its still more bullish than the run 12 hours ago and about the same or slightly more than the run 18 hours ago.
The European model is nothing close to being this wet.
Even though I think the heat ridge may expand, I also think these rain totals below will be close..........around the periphery of the heat ridge.
The amount of heat and humidity coming up on the backside will be enormous, along with a heck of a jet stream and chances for a stalled front with waves/impulses along it.
Every ingredient for a widespread excessive rain signal that remains in the same vicinity for numerous days because of the blocking heat ridge.............which is where the real threat is..............the same areas getting bombed several times. A foot of rain would not surprise me in some spots.
+++++++++++++++++++++++++++++++++++++++++++++++++++
By WxFollower - May 17, 2019, 3:41 p.m.
The GFS and Euro suites have been consistent on predicting near all-time record May hottest for much of the SE US on several days late next week into early the following week of upper 90s to low 100s! Drought areas there will likely expand and get more intense.
++++++++++++++++++++++++++++++++++++++++++++++++++++++++++++
By metmike - May 17, 2019, 4:40 p.m.
Thanks Larry!
Intense heat and the currently dry soils will help the air to heat up even more, targeting 100 degrees in the hot spots later next week.
+++++++++++++++++++++++++++++++++++++++++++++++++++++++
monsoon type rains here again today
https://radar.weather.gov/radar_lite.php?product=NCR&rid=IND&loop=yes round 2 is at my door step for today....severe warnings now out
mcfarm,
These storms are moving fast and will be thru in a flash.
How much rain did you get earlier. Your NWS reported .19.
I got .61.
We've really dried out down here. I haven't been around to check but am sure there's a lot of planting done on high ground and probably elsewhere.
it is raining now....again. multiple warnings is what they say...up to 1.5 inches this afternnonn
We only got .2 today but we have only had 2 days planting and none fit like you would like it really id say 20% done here ECILL
Thanks pll and mcfarm!
https://radar.weather.gov/radar.php?rid=IND&product=NCR&overlay=11101111&loop=yes
our latest spring shower
The NWS service in Indy reported .22 with that one along with the .19 earlier in the day.
Hopefully that will be it for a couple of days.
When this front comes back as a warm front, most of the rains will be to the west but its possible they could be in Indiana.........just impossible to know.
If we can get that warm front shoved to the Michigan border, you would be in some heat and dry weather later this week. This heat ridge is definitively going to expand north later this week though into the ECB, high confidence. Thursday and Friday, I wouldn't be surprised to see 90 for you mcfarm, along with a pretty decent sw wind, especially Friday.