Initial statement on May 13: The weather has been too wet for planting, especially affecting the corn market, since corn is planted first. #2 corn producing state Illinois is the farthest behind right now. The delay in planting and forecast for more rain caused corn prices to go up in late April but the market, at the start of last week was seeing a pattern change to drier, which would lead to planting catching up is many places this month. This put pressure on prices(in tandem with the bearish China news, then the bearish USDA report).
Planting progress for corn came in at just 30% on Monday afternoon, well below market expectations of 35% and the 3rd slowest ever. With another big weather system coming in late this week into early next week with big storms the market is focusing on additional delays..........even while a heat ridge builds in ahead of that system. The week 2 part of the forecast may feature us drying out again in many locations and a heat ridge in, at least the Southeast belt. Will storms continue along the periphery of the heat ridge?
Sunday Weather: Warmer!
https://www.marketforum.com/forum/topic/29970/
Monday Weather:
https://www.marketforum.com/forum/topic/30066/
Tuesday Weather: Heat ridge more impressive-storms late week with unwanted rain
https://www.marketforum.com/forum/topic/30177/
Wednesday: Heat ridge breaks down towards the end of week 2-heavy rain forecasts late this week into early/mid next week.
https://www.marketforum.com/forum/topic/30239/
Weather Thursday:
https://www.marketforum.com/forum/topic/30279/
Friday Weather: Heavy rains next week around a big Heat ridge in the Southeast.
https://www.marketforum.com/forum/topic/30354/
Saturday Weather:
https://www.marketforum.com/forum/topic/30434/
Sunday Weather: Excessive rains still coming
https://www.marketforum.com/forum/topic/30501/
Monday Weather: Excessive rains this week(Plains/WCB but changes down the road.........maybe
https://www.marketforum.com/forum/topic/30583/
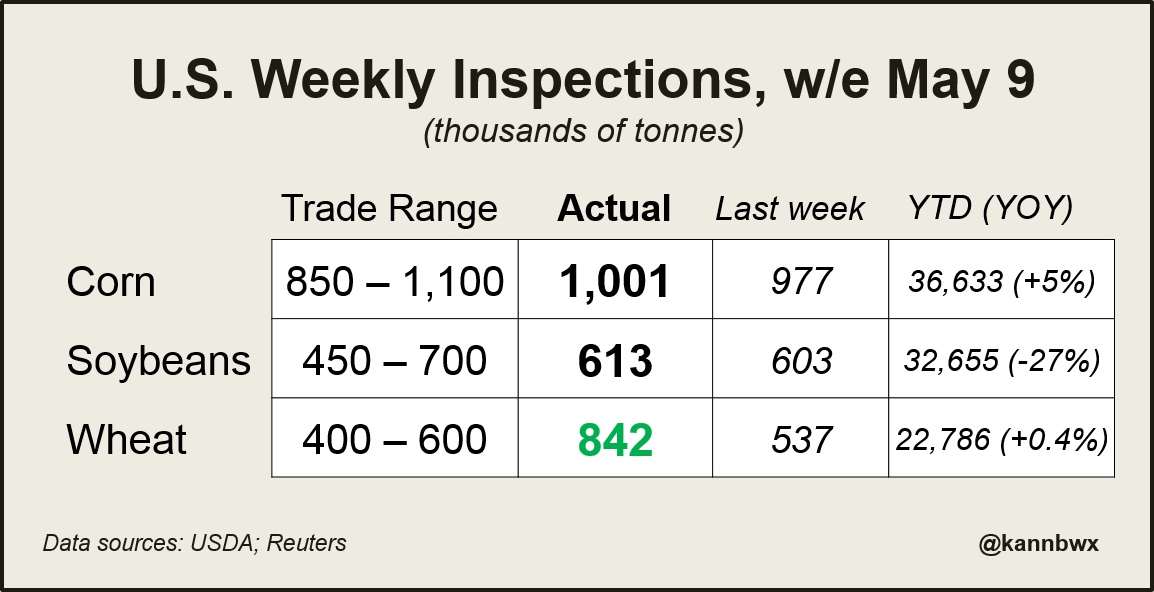
Export inspections. Corn and beans not so good. Wheat was excellent.
https://www.ams.usda.gov/mnreports/wa_gr101.txt
Last week's U.S. #wheat inspections were the largest since Sept. 2016 and incl. 399k tonnes HRW and 210kt HRS. Some 272k tonnes of #soybeans were shipped to #China. #Corn inspections are now up 5% over last year, but they were up 7% last week (gap is closing).
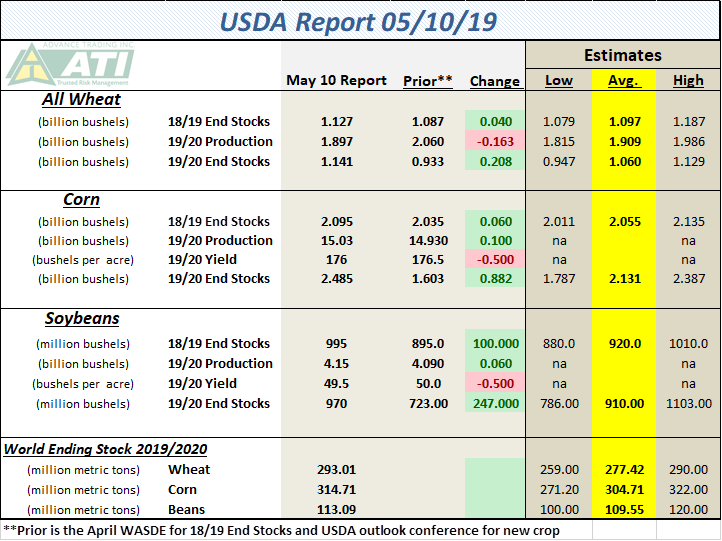
USDA SUPPLY & DEMAND REVIEW May 10, 2019
https://www.cmegroup.com/trading/agricultural/files/ht_charts/snd_cbt.pdf
CORN: The May USDA Supply & Demand report for corn was considered bearish with US 2018-19 corn ending stocks coming in at 2.095 billion bushels versus the average estimate of 2.061 billion bushels (range 1.985-2.21 billion range) and compared to 2.035 billion in April. 2018-19 World ending stocks came in at 325.94 million tonnes versus the average estimate of 315.3 million tonnes (313.0-318.2 million range) and compared to 314.01 million in April. The new crop 2019-20 US ending stocks came in at 2.485 billion bushels in a range 1.694-2.506. The 2019-20 World ending stocks were estimated at 314.71 million tonnes versis an expected range of 271.2 to 329.0 million tonnes. Brazil's corn production came in at 100 million tonnes versus the average estimate of 96.7 million tonnes (95.0-98.0 million range) and compared to the April estimate of 96.0 million tonnes. Argentina's corn production came in at 49 million tonnes versus the average estimate of 48.0 million tonnes (46.5-50.0 million range) and compared to 48.0 million in April. PRICE OUTLOOK: The much larger than expected South America production helped to cause a bearish report with December corn moving down to new contract lows. World ending stocks at 325.94 million tonnes came in well outside of the range of estimates for 313.0-318.2 million tonnes. A break to the 365 1/2 level appears to have priced in a very negative outlook and there will be many factors which could develop to shift the balance sheet more positive. Consider buying December near 365 1/2. The downside target for July corn is at 344
This was from a week ago. We will have a crop planting progress update this afternoon.
Top 5 Slowest Corn Planting Years since 1991- As of May 5th Only IA, MO, and NE do not fall in the top 5 slowest IN, SD, and MN are slower than the 1993 pace US #Corn at 23% is 4th slowest in past 29 years #plant19


AgriSource Inc @agrisource May 2
We have been receiving some questions on historical Prevent Plant acreage. Since 1997, the US has seen prevent plant acreage as low as 1.239 mln acres in 2012, to as high as 9.6 mln acres in 2011. The last 3 years have averaged 1.9 to 3.4 mln acres that went unplanted. #plant19

Karen BraunVerified account @kannbwx
USDA's grains circular offered a better outlook for #corn than soybeans: "Global consumption continues to outpace production driven by higher feed use, particularly for growth in poultry production. Corn for non-feed use also expands, primarily driven by growth in #China."


Karen BraunVerified account @kannbwx
Money managers hit an all-time combined grains & oilseeds net short of 700,460 fut+opt contracts in week ended May 7. April 30  May 7, # fut+opt contracts:
#Corn -306,699 -282,327
#Soybeans -148,526 -160,553 (record)
CBOT #wheat -83,502 -82,146
Meal -15,599 -33,135

Crop progress numbers:
https://release.nass.usda.gov/reports/prog2019.txt
Less planted corn than expected(by the market). Almost tied with 2013 as the slowest planting in the last 2 decades.
U.S. planting progress, May 12:
#Corn 30% (23% last week, 66% average, trade guess 35%)
#Soybeans 9% (6% last week, 29% avg, trade guess 15%)
Spring #wheat 45% (22% last week, 67% avg, trade guess 35%)
Trade expectations for Crop Progress. Last year on May 12, #corn was 59% planted, #soybeans 32%, spring #wheat 54%. Five-year average for corn is 66%, soybeans 29%, spring wheat 67%.


Karen BraunVerified account @kannbwx 14m14 minutes ago
Notable delays, #corn:
Illinois 11% (5y avg 82%)
Indiana 6% (avg 57%)
Iowa 48% (76%)
Minn 21% (65%)
Ohio 4% (47%)
Nebraska 46% (72%)
N Dak 11% (43%)
S Dak 4% (54%)
Michigan 5% (34%)
Wisconsin 14% (46%)
Missouri 52% (87%)

Craig Solberg @CraigSolberg 19h19 hours ago
Historical national corn planting progress figures as of May 12 (since 1987)

Tue wx updated
Buying N july whead @ 4:20 and buying July corn at 3:48 ......
...... these are the times and days that make the day trader of grain complex commodities.....
..... like migratory waterfowl
Thanks SS!
U.S. #corn planting progress was seriously behind normal schedule on May 12 at just 30% complete, well behind the 5-year avg of 66%. But if conditions are right, farmers can plant quickly. Here are the 10 fastest planting weeks on record since 1980, by percent planted.

.... 3-92 - July. ... 5-th day of week CLOSE
metmike: Funds covered some of this position after the Tuesday end date of this report.
Karen BraunVerified account @kannbwx 21h21 hours ago
Week ended May 14 was the 5th week in a row that funds set a new combined net short in CBOT grain/oilseed fut+opt: 719,076 contracts.
May 7 May 14
:#Corn -282,327 -282,918
#Soybeans -160,553 -168,835 (record)
Corn producer -16,340 -4,516
Soy prod. +70,077 +66,862


mon wx updated
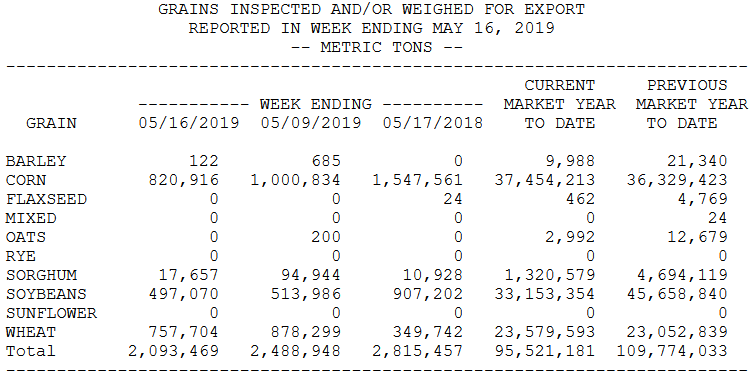
https://www.ams.usda.gov/mnreports/wa_gr101.txt
metmike: Exports good wheat, not so good S and C:
Darin D. Fessler @DDFalpha 21m21 minutes ago
Export Inspections (TMT):#corn
#soybeans
#wheat
#sorghum
#barley
Karen BraunVerified account @kannbwx 21m21 minutes ago
Table: Crop Progress Expectations 5 yr planting averages, May 19: #Corn 80%, #soybeans 47%, spring #wheat 80%. Slowest-ever May 19: corn 50% 1995; soy 12% 1983 Slowest May 19 post-2000: corn 68% 2009; soy 24% 2013#plant19