Great October 11th to you! Don't let another day slip by. Do something special for somebody to remember today! Seriously, don't just think about it for a moment......do it.
Temperatures in the Midwest have dropped over 30 degrees!
Scroll down and enjoy the latest comprehensive weather to the max!!
The latest rain forecasts for the next week are below. Advertised pattern change coming up.
However, a wave in the S.Plains, along with another reinforcing cold front will result in the last round of rains from the S.Plains to the S.Cornbelt with ..................then it's mostly clear sailing with the new dry pattern.
Day 1 below:
http://www.wpc.ncep.noaa.gov/qpf/fill_94qwbg.gif?1526306199054

Day 2 below:
http://www.wpc.ncep.noaa.gov/qpf/fill_98qwbg.gif?1528293750112

Day 3 below:
http://www.wpc.ncep.noaa.gov/qpf/fill_99qwbg.gif?1528293842764

Days 4-5 below:
http://www.wpc.ncep.noaa.gov/qpf/95ep48iwbg_fill.gif?1526306162

Days 6-7 below:
http://www.wpc.ncep.noaa.gov/qpf/97ep48iwbg_fill.gif?1526306162

7 Day Total precipitation below:
http://www.wpc.ncep.noaa.govcdx /qpf/p168i.gif?1530796126

Excessive Rain threat
Michael today. Then S.Plains over the weekend.
Current Day 1 Forecast
Day 1 Threat Area in Text Format
Current Day 2 Forecast |
Day 3 forecast below

Severe Storm Risk.
Michael in the Midatlantic today.
https://www.spc.noaa.gov/products/outlook/
Current Day 1 Outlook | |
Current Day 2 Outlook | |
Current Day 3 Outlook | |
Current Day 4-8 Outlook |
High Temperatures today and Friday
Chill has arrived. Temperatures are 30 deg. F cooler in many places compared to earlier this week!!!!


Highs for days 3-7:
The chilly air will feature temperatures 30+ degrees colder than recent days along the Ohio River.............and stay chilly thru this particular period.


How do these days 3-7 temperatures compare to average at this time of year?
The cold has taken over..........but warmth hangs on to the far southeast.

Low Temperature Departures:

Surface features for the same 3-7 day period:
Chilly Canadian high pressure in charge. Reinforcing cold front this weekend, and another one next week. Mostly dry weather as the atmosphere will be dried out.

Current Dew Points
Higher dew points being shunted southeast. Extremely dry air in the Plains/Midwest is surging southeast.

Latest radar loop.
Quiet except for the East Coast.
Remnants of Michael.
http://www.nws.noaa.gov/radar_tab.php


Satellite picture.
We can still see Michael.

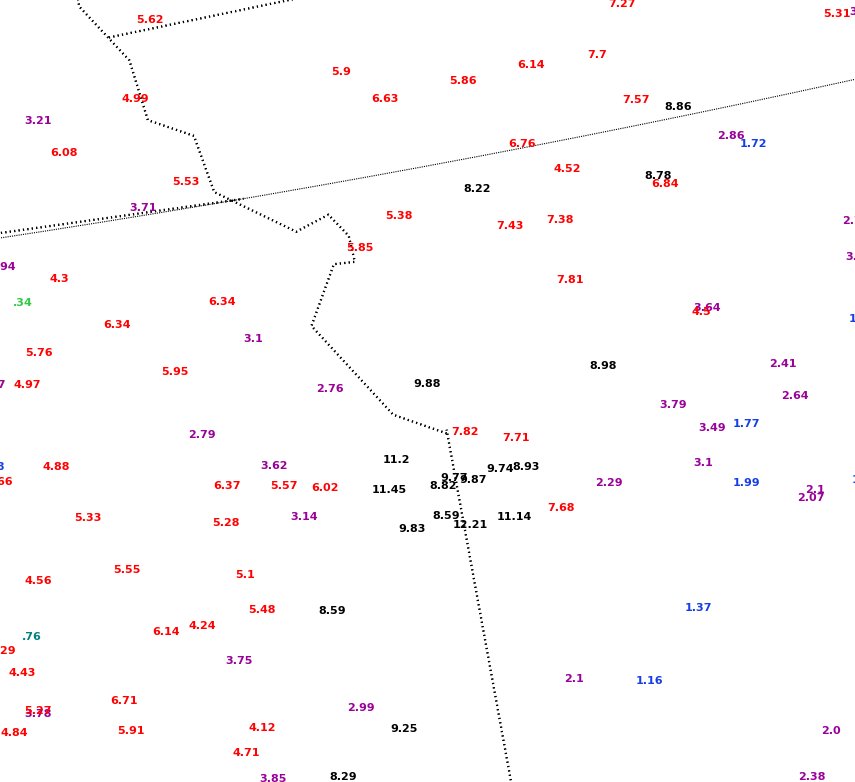
Rains the past 24 hours
Michael in the Southeast.
![]()
6-day rainfall totals through 7 AM CDT on October 10, centered on the Kansas City area An area that could not buy a rain all summer gets 6-12" in a six-day time frame...in October
You can go to this link to see rain totals from recent time periods:
https://water.weather.gov/precip/
Go to precipitation, then scroll down to pick a time frame. Hit states to get the borders to see locations better. Under products, you can hit "observed" or "Percent of normal"
Goodbye summer.....it was a good one.
Soil moisture anomaly:
Too wet in a large area. Drying has commenced in many areas!!!
The 2nd map gets updated once a week.


Rains compared to average for the last 7, 14, 30 and 60 days.
Usually not updated for previous day until late the next day.
Note how wet it's been over the past 60 days over eastern 2/3rds of the country!
https://www.atmos.illinois.edu/~snodgrss/Ag_Wx.html


The top map is the Canadian ensemble average, the maps below are the individual members that make up the average
End of week 2....................0Z ensembles from Thursday. 2 camps. One is more of a zonal, west to east flow, mild to warm temperatures. The other one has a ridge west/trough east and would feature chilly temperatures. Both are dry.
++++++++++++++++++++++++++++++++++++++++++++++++++++++++++++++
Each member is like the parent, Canadian model operational model.......with a slight tweek/variation in parameters. Since we know the equations to represent the physics of the atmosphere in the models are not perfect, its useful to vary some of the equations that are uncertain(can make a difference) to see if it effects the outcome and how.
The average of all these variations(ensembles) often yields a better tool for forecasting. It's always more consistent. The individual operational model, like each individual ensemble member can vary greatly from run to run.........and represent an extreme end of the spectrum at times. The ensemble average of all the members, because it averages the extremes.............from opposite ends of the spectrum............changes much less from run to run.
360h GZ 500 forecast valid on Oct 26, 2018 00 UTC


Temperature Anomalies from GFS ensembles(fairly reliable product) going out 2 weeks. These maps show the Northern Hemisphere. The map of the US is front center. Look for the state borders in white.
Today: The cold blast is here!.
Very warm air to the southeast is being scoured out.
In 5+ days:
Cold well entrenched.........except for far southeast.
In 10+ days: Cool air surge has run its course?? Not so fast. Possibility of additional cold shots from ridge west/trough east pattern. Very warm West........how far east will the warmth travel?
Day 15: Upper level ridge West with warm air. How much upper level troughing will there be downstream with cool air?
The low skill, longer range CFS model for weeks 3-4.
Strong Upper level ridge in Alaska/NW Canada/West Coast. Cool temperatures downstream in the Midwest/East. Similar to the last 2 days.
Very Dry weather in the Midwest to accelerate harvest.........like the last 2 days.
Heating degree days(from cold weather) have replaced cooling degree days(from hot weather) at this time of year.
Check in tomorrow to read something different............."low skill" (-:

Precip below:

National Weather Service 6-10 day, 8-14 day outlooks.
Will be updated early this afternoon. Dry pattern!!!!
Temps should be warm West and cool Midwest/East. Not as cool moving from the 6-10 day to the 8-14 day.
Temperature Probability | |
Precipitation Probability | |
| the 8-14 day outlooks ArchivesAnalogsLines-Only FormatGIS Data | |
Temperature Probability | |
Extreme weather days 3-7:
Widespread cold Plains/Midwest..........which is what we traded earlier this week. Yeah, that's snow in W.Kansas.
1 last round of heavy rains TX to TN early in this period.

Re: Re: Re: Re: Natural Gas Thursday
Natural gas may have been rescued today by a much colder late morning 12z GFS.
gfs_namer_384_200_wnd_ht | gfs_namer_384_500_vort_ht |
gfs_namer_384_1000_500_thick | gfs_namer_384_850_temp_ht |
Over half of the GFS ensembles support this:
