It's that time of year again. Headed out in South Dakota this morning on my 13th #pftour26 Looking forward to seeing how corn and soybeans on this route compare to my observations from prior years.
Scouts on #pftour26 found South Dakota corn yield down 14.4% from last year's tour. USDA has yield down 12% yr/yr. Pod counts for soybeans were down 20% from last year's tour. USDA's forecast is down 13% yr/yr.
In Ohio, scouts on #pftour26 measured corn yield down 3% from last year's tour. But USDA has projected yield to rise 5% from 2025. Similar story in soybeans. Pod counts were down 7% from the 2025 tour, but USDA predicts yield will rise 9%.
Scouts on #pftour26 found Nebraska corn yield down 9% from last year's tour, the lowest since 2022. Pod counts for soybeans were down more than 9% on the year, a two-year low for the tour. USDA last week project Nebraska corn and soybean yields down 6% and 13%, respectively.
Average corn yields in Indiana on #pftour26 were down more than 5% from last year's tour, while soybean pod counts were down more than 4%. USDA predicts Indiana corn and bean yields will rise 1% and 4% y/y, respectively, a similar tour-vs-USDA disconnect as we saw in Ohio.
Scouts on #pftour26 found Illinois corn yield down nearly 8% on the year, the tour's lowest Illinois yield since 2019. USDA projects the state's yield to fall just 1% yr/yr. Soybean pod counts were down more than 3%, though USDA sees soybean yield up 7% from last year.

Average corn yields and soybean pod counts in western Iowa on #pftour26 were down from last year across the board. However, soybean pod counts were up from the three-year averages, and corn yields leaned in that same direction. Full Iowa state results will be out on Thursday.
Iowa corn yield samples on #pftour26 were down 2% from last year but up 1% from the three-year tour average. USDA has Iowa yield rising 3% on the year. Pod counts were down more than 1%, somewhat close to USDA's assumptions on soybean yield.
Corn yields in Minnesota on #pftour26 were down 2% from last year's record, and USDA also sees the state's yield down 2%. Soybean pod counts edged last year's state record, but USDA sees yield down 9% on the year. Will the northern, non-tour portion of MN pull down the average?
·
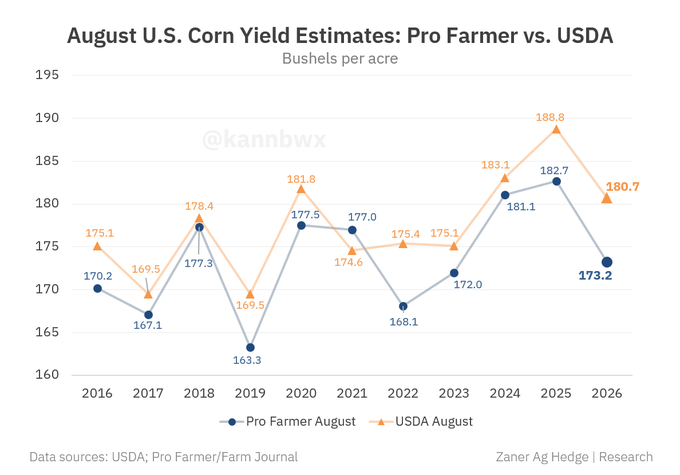
Pro Farmer projects U.S. corn yield at 173.2 bpa, well below USDA’s 180.7. PF corn yield has now come in below USDA in 16 of the last 20 Augusts. The 7.5-bushel PF-USDA shortfall is the largest for August in at least 20 years.
++++++++++++
·8-22-26, metmike: PF has only predicted a higher corn yield vs the USDA 1 time in 20 years, that being in 2021. So they get it right in the years when the USDA was too high and they get it wrong, sometimes REALLY WRONG when the USDA was not high enough in August but PF clearly had a serious bias for estimates that are TOO LOW.
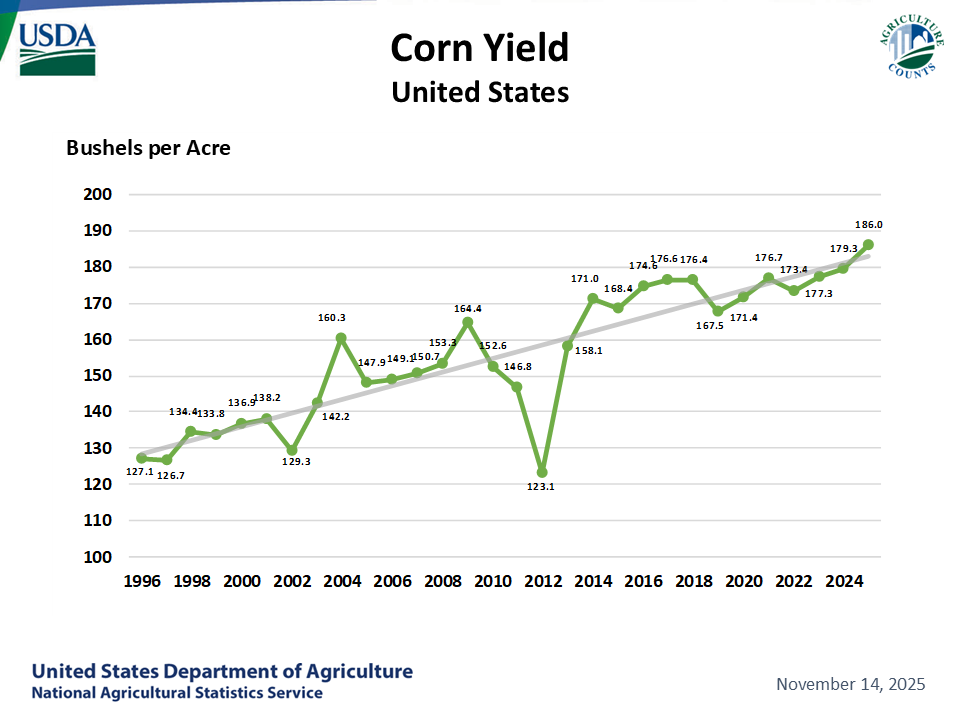
This was the FINAL corn yield the past 3 decades.
https://www.nass.usda.gov/Charts_and_Maps/Field_Crops/cornyld.php
I did a comparison between final USDA yields and PF yields below and got this.
Year PF forecast compared to final yield
2025 -3.8 bpa
2024 +1.8 bpa
2023 -5.3 bpa
2022 -5.3 bpa
2021 -.3 bpa
2020 -5.8 bpa
2019 -4.2 bpa
2018 -.9 bpa
2017 -8.9 bpa
2016 -1.8 bpa
In 6 out of the last 10 years above(60%), they were more than 3.5 bpa TOO LOW with their final yield estimate. 4 of those times(40%) they were more than 5 bpa TOO LOW.
This year, they are predicting a -7.5 bpa drop in yield compared to the August USDA. They probably have the trend DOWN correct but history and their huge bias for almost always being too low (90% of the time) with their corn yield suggests they are too low again.
Clearly, their crop scouts have a problem with underestimating corn yields!!!! With beans on the other hand they don't appear to have the same bias.
++++++++++++++
Pro Farmer projects U.S. soybean yield at 53.3 bpa, above USDA’s 52.7. PF soybean yield has topped USDA in just 8 of the last 20 Augusts. PF’s 53.3 is its second-highest yield forecast on record, behind 54.9 in 2024.
++++++++++++++++
8-22-26: metmike: 2 years ago, PF was +.7 bpa HIGHER than the USDA and had their highest/ MOST bearish projection in the last 10 years at 54.9 bpa.
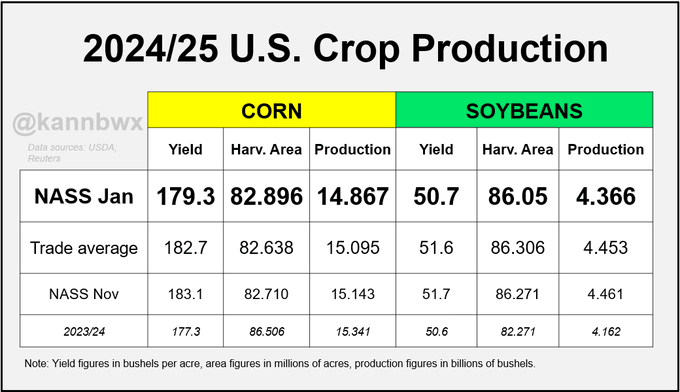
Turns out that the complete opposite happened. We had a dry finish to the growing season with the biggest revision DOWN for the soybean crop in history on the January 2025 USDA report and final yield of just 50.7, so PF was a whopping +4.2 bpa too high!!!!
Their yield forecasts above are just compared to the August crop report NOT the final yield, which is what matters the most. I would be MUCH MORE interested in seeing that metric to see if they got the trend/change in the right direction. In 2024, it was in the WRONG direction and wrong by a lot.
I would be very interested in hearing cutworm's perspective because I have not done a detailed analysis of ALL their work. My intentional cherry picking above was not meant to represent ALL their work, it was in fact intentional based only on the 1 year that stands out because it was such an anomalous outlier NOT a fair assessment of their 10 years above. It was meant only to demonstrate how a crop estimate this late in the season can still be off by 8% and in the WRONG direction.
To be fair, again, it was hot/dry for the last few weeks of the soybean pod filling in 2024 which took away yield AFTER PF did their crop estimate. Even the USDA struggled to get it right as late as the November 2024 crop report!
cutworm, bowyer, jim and others remember exactly because they were following it close!
++++++++++++++++++
By metmike - Aug. 11, 2026, 6:40 p.m.
cutworm,
You and I agree on most things when it comes to markets but on this one we are almost identical.
I still post our comments from late in the 2024 growing season during the flash drought about the crop being negatively impacted. The USDA didn't catch up to that until the January 2025 report!
By metmike - Jan. 10, 2025, noon
EXTREMELY BULLISH!!!!!!!!
+++++++++
By metmike - Jan. 10, 2025, 12:45 p.m.
+++++++++++++++++
USDA September 12, 2025/Grains
78 responses |
Started by metmike - Sept. 12, 2025, 4:01 p.m.
https://www.marketforum.com/forum/topic/114629/
++++++++++++
With that being the case, it's impossible to expect the USDA to dial in recent changes from changing conditions with accuracy.
They have more information than that rest of us and their weekly crop ratings/conditions seem to do a wonderful job at capturing changes from the previous week.
Re: Re: Re: Re: Re: Re: USDA January 10, 2025
By metmike - Jan. 10, 2025, 12:14 p.m.
U.S. harvested corn area came in above expectations but soybean acres came in below. Both crops saw yield reductions far larger than analysts predicted - both yields were below the range of analyst estimates.
I got this email this morning:
PRO FARMER Crop Tour keep underestimating Corn production >>> WHY???
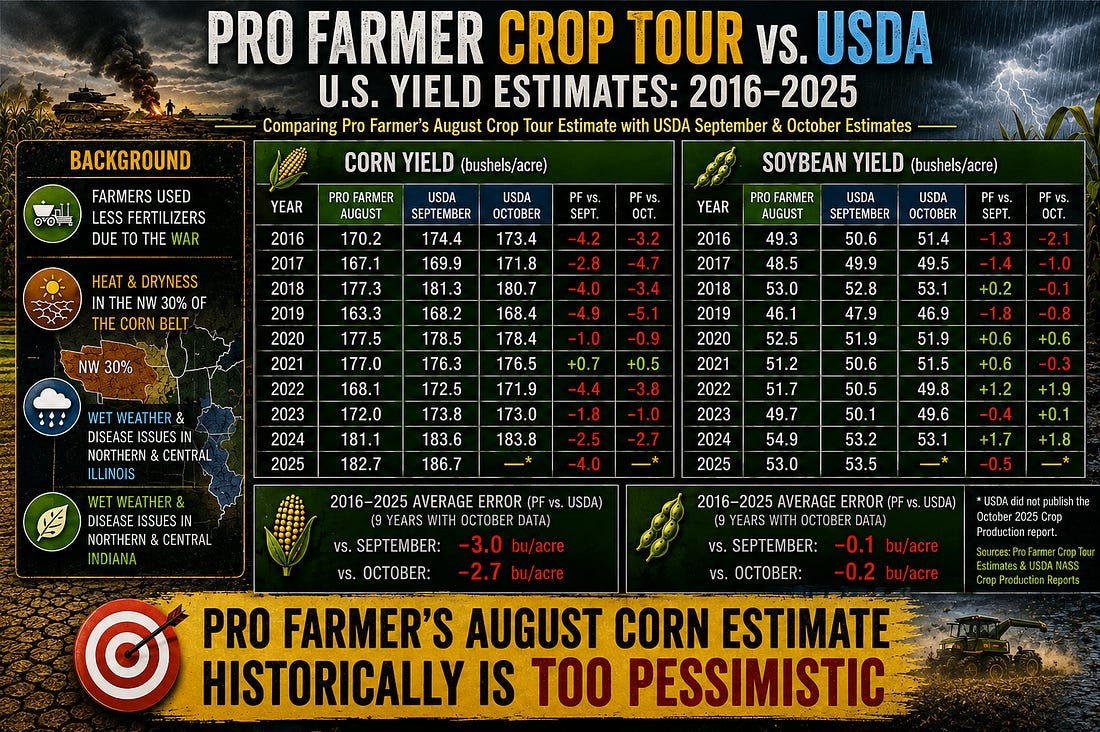

Every August, the Pro Farmer Crop Tour becomes something of an agricultural road trip, treasure hunt, and crop detective story rolled into one.
More than 100 scouts fan out across seven major Corn Belt states, stop at randomly selected fields, march into the crop and start counting ears, kernels, and soybean pods. The seven Tour states represent roughly 70% of U.S. corn and soybean production.
The resulting numbers can move markets.
But there is an interesting historical wrinkle that Climatelligence readers—and commodity traders—should understand:
Pro Farmer has had a persistent tendency to underestimate the final US corn yield. Its soybean estimates, while certainly not perfect, have generally been closer.
Jim Roemer’s comments on this issue:
 |
Looking at the last decade, the pattern is striking.
From 2016 through 2025, Pro Farmer’s national corn yield estimate came in below USDA’s eventual final yield in nine of ten years. The lone exception was 2024.
That doesn’t mean we should simply add four or five bushels to Pro Farmer every August. But it does mean traders should be careful about treating the Tour estimate as the final word on crop size. The historical record suggests it has often been better at telling us whether USDA may be too high or too low than telling us precisely where the final yield will land.
There are several good explanations.
Scouts estimate corn using ear population, grain length, kernel rows, and row spacing. That’s an excellent snapshot of the crop in the third week of August—but it’s still a snapshot.
Kernel depth and final grain weight aren’t completely known yet.
Think of it this way:
In favorable late summers, corn can finish surprisingly well. Good soil moisture, moderate temperatures, sunshine and a healthy plant can add kernel weight that wasn’t obvious when scouts walked through the field.
The routes are deliberately consistent so… this year’s observations can be compared with previous Tours. That’s one of the Tour’s greatest strengths—but it also means the sample isn’t identical to USDA’s eventual nationwide measurement.
Pro Farmer itself emphasizes this point. The organization says the most useful way to interpret Crop Tour is to compare this year’s Tour with previous Tours, rather than simply comparing its raw numbers with USDA. Pro Farmer has even developed historical adjustments because it knows certain states and routes tend to measure systematically high or low.
In Nebraska, for example, roughly 60% of corn is irrigated, while historically only about 40% of the Tour’s Nebraska samples have been irrigated. That’s exactly the kind of sampling difference that can create a persistent statistical bias.
 |
Here’s where things get interesting.
Instead, scouts count pods in a 3-by-3-foot square.
Because in August, two enormously important soybean yield variables remain unknown: seeds per pod and final seed weight. Pro Farmer therefore describes its pod count as measuring the size of the soybean crop’s “yield factory.”
That may actually prevent some false precision.
Rather than pretending that 1,400 pods automatically equals X bushels per acre, Pro Farmer can combine those pod counts with historical relationships, crop maturity, weather and other information when producing its national estimate.
And recent results illustrate the difference. From 2022–2025, Pro Farmer’s soybean estimate had an average absolute error of about 1.8 bushels per acre, versus roughly 4.1 bushels for corn. Its 2025 soybean estimate of 53.0 bu./acre landed exactly on USDA’s final 53.0.
Soybeans also have another characteristic that makes August forecasting fascinating:
A soybean plant can look spectacular in mid-August and still disappoint if hot, dry weather shrinks seed size or causes pods to abort.
Conversely, timely late-August rains can turn an average-looking field into an excellent crop. However, earlier this August, very wet weather from central and northern Illinois through Ohio has caused concerns about disease issues. Usually, “rain makes grain”, so the recent flooding rains in the central and eastern U.S. corn/soybean belt was highly unusual.
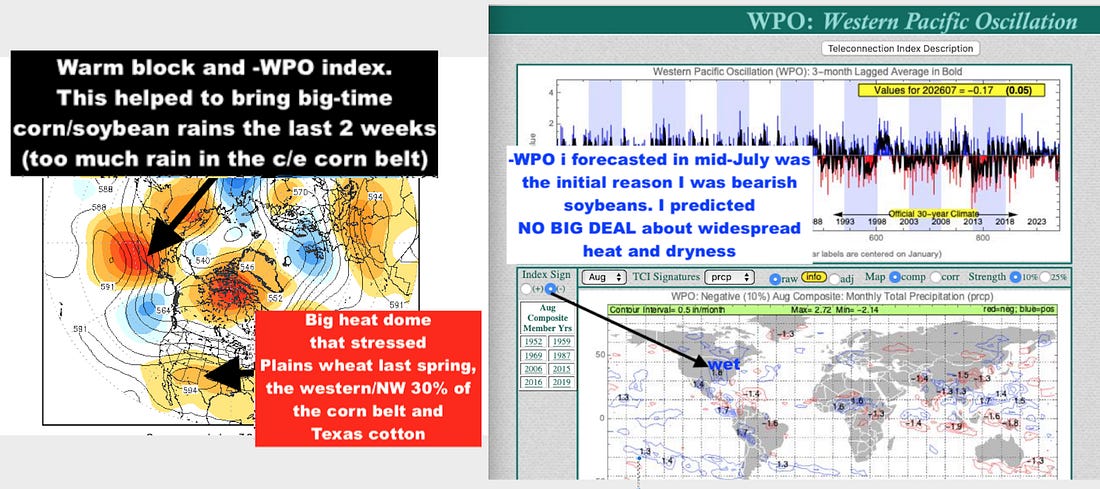
Notice, how… nearly month ago, when many meteoroloigists and grain analysts were calling for Midwest heat and dryness, our (Jim Roemer’s) ClimatePredict program predicted great August rains due to the combination of a teleconnection we call a negative Western Pacific Oscillation Index (-WPO), combined with El Niño. The good news for this week, a drier, cooler weather pattern will develop for 75% of the Midwest. This should still make for a large US soybean crop and potentially is NOT bullish.
PRO FARMER Crop Tour keep underestimating Corn production >>> WHY???THE TOUR ACTUALLY RAISES MORE QUESTIONS THAN IT ANSWERS!!!
by Scott MathewsEditor-in-Chief and Co-Producer of Climatelligence
Source: Jim Roemer - Meteorologist - Commodity Trading Advisor - Principal, Best Weather Inc. & Climate Predict - Publisher, Weather Wealth Newsletter and Co-Producer of ClimatelligenceEvery August, the Pro Farmer Crop Tour becomes something of an agricultural road trip, treasure hunt, and crop detective story rolled into one.More than 100 scouts fan out across seven major Corn Belt states, stop at randomly selected fields, march into the crop and start counting ears, kernels, and soybean pods. The seven Tour states represent roughly 70% of U.S. corn and soybean production. The resulting numbers can move markets. But there is an interesting historical wrinkle that Climatelligence readers—and commodity traders—should understand: Pro Farmer has had a persistent tendency to underestimate the final US corn yield. Its soybean estimates, while certainly not perfect, have generally been closer. Jim Roemer’s comments on this issue:
From 2016 through 2025, Pro Farmer’s national corn yield estimate came in below USDA’s eventual final yield in nine of ten years. The lone exception was 2024. Several misses weren’t small:
Why the corn bias?There are several good explanations.First, Pro Farmer is looking at corn before Mother Nature has finished making it.Scouts estimate corn using ear population, grain length, kernel rows, and row spacing. That’s an excellent snapshot of the crop in the third week of August—but it’s still a snapshot.Kernel depth and final grain weight aren’t completely known yet. Think of it this way: > Pro Farmer is trying to guess the final score while the game is still in the fourth quarter.In favorable late summers, corn can finish surprisingly well. Good soil moisture, moderate temperatures, sunshine and a healthy plant can add kernel weight that wasn’t obvious when scouts walked through the field.Second, the Tour doesn’t sample the entire Corn Belt.The routes are deliberately consistent so… this year’s observations can be compared with previous Tours. That’s one of the Tour’s greatest strengths—but it also means the sample isn’t identical to USDA’s eventual nationwide measurement.Pro Farmer itself emphasizes this point. The organization says the most useful way to interpret Crop Tour is to compare this year’s Tour with previous Tours, rather than simply comparing its raw numbers with USDA. Pro Farmer has even developed historical adjustments because it knows certain states and routes tend to measure systematically high or low. In Nebraska, for example, roughly 60% of corn is irrigated, while historically only about 40% of the Tour’s Nebraska samples have been irrigated. That’s exactly the kind of sampling difference that can create a persistent statistical bias.
The Crop Tour doesn’t actually estimate soybean yields in the field.Instead, scouts count pods in a 3-by-3-foot square.Why?Because in August, two enormously important soybean yield variables remain unknown: seeds per pod and final seed weight. Pro Farmer therefore describes its pod count as measuring the size of the soybean crop’s “yield factory.”That may actually prevent some false precision. Rather than pretending that 1,400 pods automatically equals X bushels per acre, Pro Farmer can combine those pod counts with historical relationships, crop maturity, weather and other information when producing its national estimate. And recent results illustrate the difference. From 2022–2025, Pro Farmer’s soybean estimate had an average absolute error of about 1.8 bushels per acre, versus roughly 4.1 bushels for corn. Its 2025 soybean estimate of 53.0 bu./acre landed exactly on USDA’s final 53.0. Soybeans also have another characteristic that makes August forecasting fascinating: August weather really matters.A soybean plant can look spectacular in mid-August and still disappoint if hot, dry weather shrinks seed size or causes pods to abort.Conversely, timely late-August rains can turn an average-looking field into an excellent crop. However, earlier this August, very wet weather from central and northern Illinois through Ohio has caused concerns about disease issues. Usually, “rain makes grain”, so the recent flooding rains in the central and eastern U.S. corn/soybean belt was highly unusual. Notice, how… nearly month ago, when many meteoroloigists and grain analysts were calling for Midwest heat and dryness, our (Jim Roemer’s) ClimatePredict program predicted great August rains due to the combination of a teleconnection we call a negative Western Pacific Oscillation Index (-WPO), combined with El Niño. The good news for this week, a drier, cooler weather pattern will develop for 75% of the Midwest. This should still make for a large US soybean crop and potentially is NOT bullish.
The 2026 crop has some legitimate problems. Dryness and heat affected portions of the western and northwestern Corn Belt, while excessive rainfall and flooding across parts of Illinois, Indiana and the eastern Midwest created concerns about nitrogen loss, disease and crop health. Remember too that many farmers may have not applied enough fertilizers last spring to their corn crop due to a hike in prices attributed to the Iran-U.S. war. Soybeans on the other hand do not need fertilization. Hence, their yields were not as adversely affected. Those problems shouldn’t be dismissed. But neither should history. The Pro Farmer Tour is extremely valuable—but its greatest value may be as a crop thermometer rather than a crystal ball. It tells us what scouts are seeing right now, along consistent routes, using consistent procedures. It can identify regional trouble that broad national statistics may overlook. But when Pro Farmer produces a surprisingly low corn number in August, history tells us to resist immediately burying the crop. Corn has repeatedly found a few extra bushels between the Tour and the combines. |
Let me comment on the source above. I only posted them because of their comments on the Pro Farmer corn estimates.
With regards to their UNJUSTIFIED bragging:
Notice, how… nearly month ago, when many meteoroloigists and grain analysts were calling for Midwest heat and dryness, our (Jim Roemer’s) ClimatePredict program predicted great August rains due to the combination of a teleconnection we call a negative Western Pacific Oscillation Index (-WPO), combined with El Niño. The good news for this week, a drier, cooler weather pattern will develop for 75% of the Midwest. This should still make for a large US soybean crop and potentially is NOT bullish.
++++++++++++++++
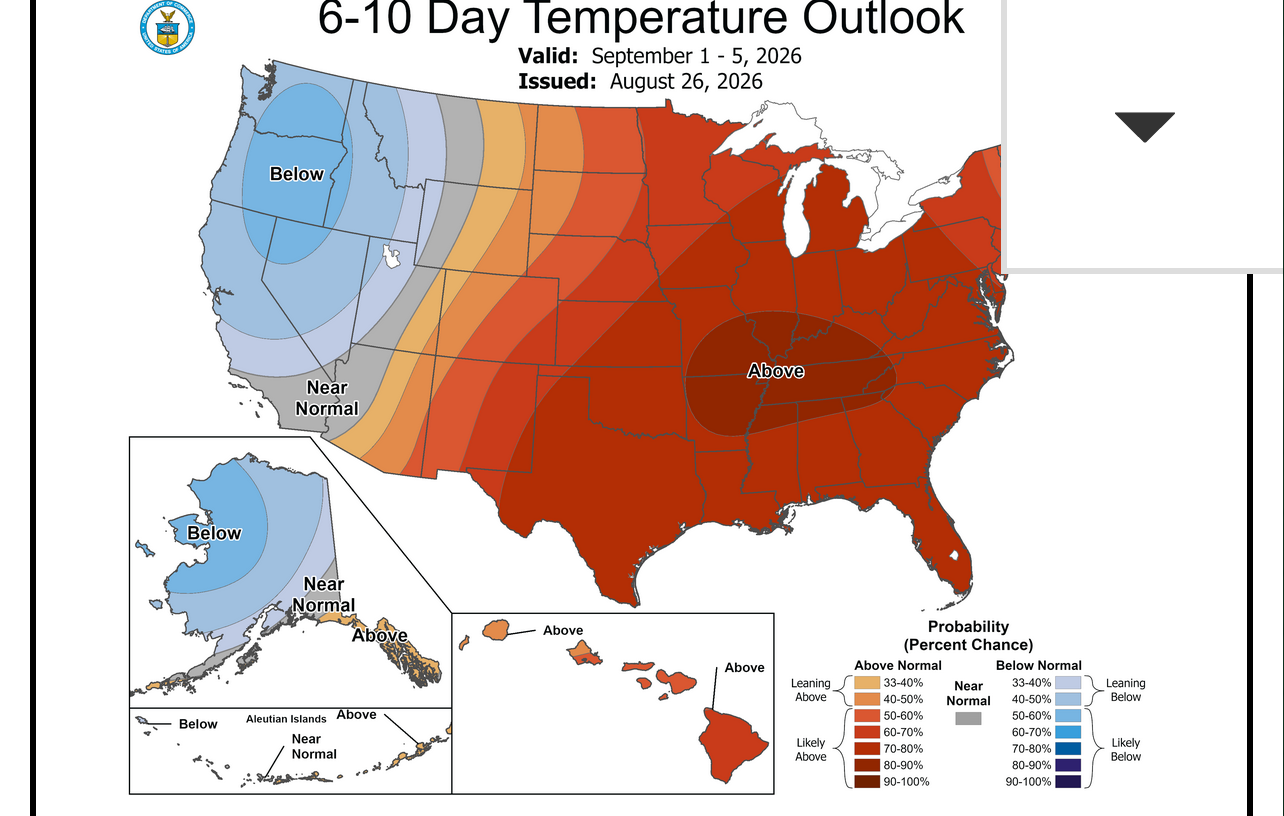
I would not call the near record heat we have coming up and this forecast below favorable for"a large US soybean crop" and there is nobody that believes this: "predicted great August rains".
Ask cutworm in southeast, IN what the impact of the great August rains was on his crop that was destroyed by the flooding from those rains!!
Personally, I would NOT use a service like this that twists a bad forecast into a great one to try to sell subscriptions.
https://www.cpc.ncep.noaa.gov/products/predictions/610day/