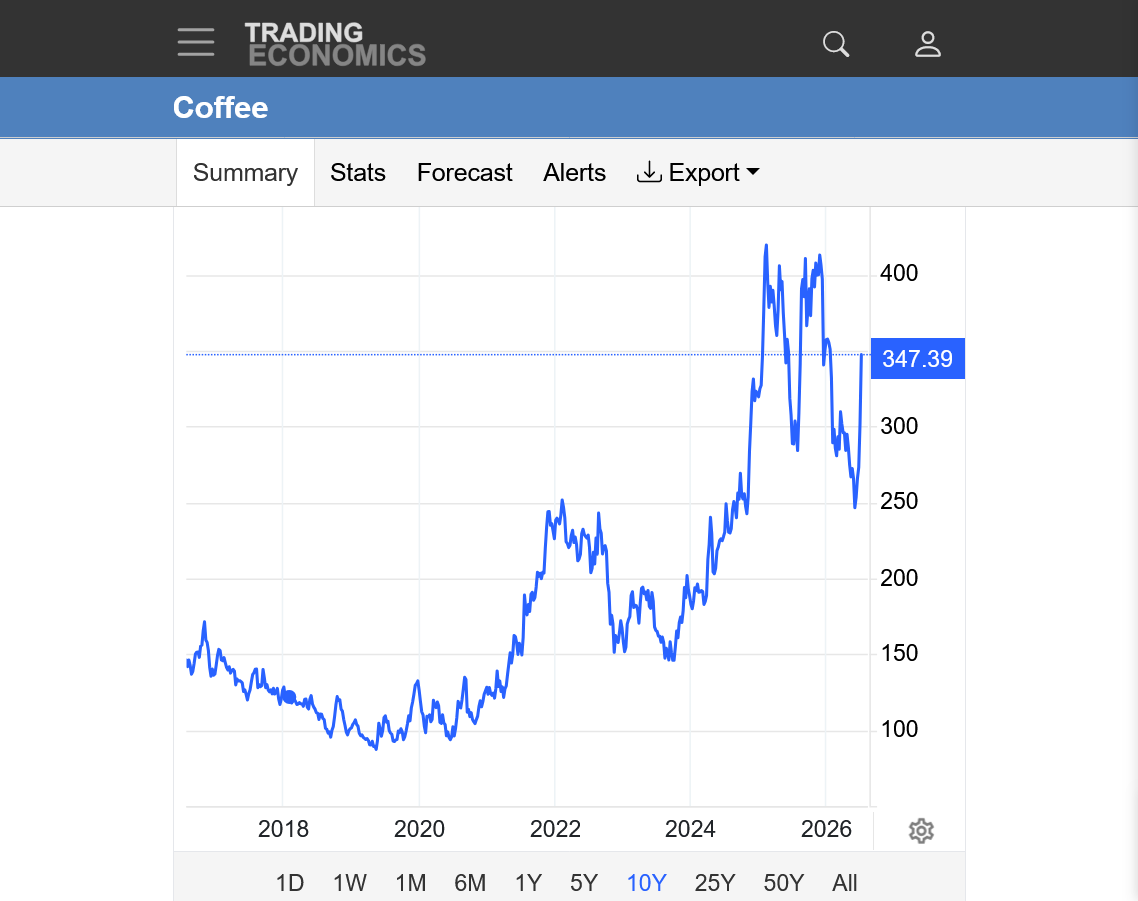
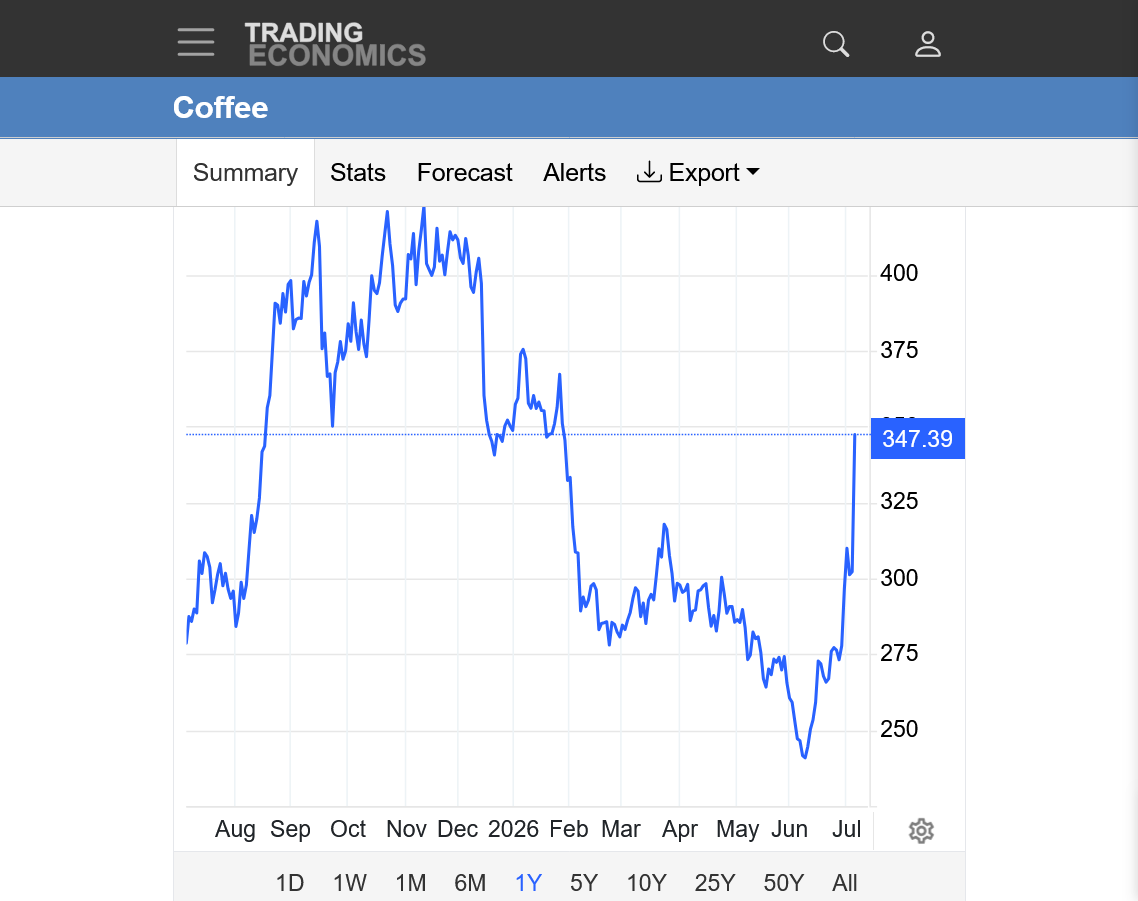
what is happening with coffee? up over 54 cents.
Great to meet you, knox10!
WOW!
You are exactly right and this is a great threat/post.
This is normally the dry season in Mineas Gerais and the surrounding areas. Perfect for harvesting the coffee crop that matured in late Spring.
This year's crop was supposed to be a big one and prices were making significant lows, in fact life of contract lows last month with the anticipation of those huge supplies hitting the market.
That price action is typical for markets. They make SEASONAL LOWS AHEAD OF the peak harvest in anticipation of the new crop supply hitting the markets
Then..........BOOM! Heavy rains fell. Initially delaying the harvest but now, apparently damaging the crop???
With the market having already bottomed with a spike, multi year low and expectation for a huge crop dialed in, I'll guess that speculators and others were ready to jump on the long side with bullish news.
https://tradingeconomics.com/commodity/coffee
1. 10 years
2. 1 year
3. 1 month
4. 1 week
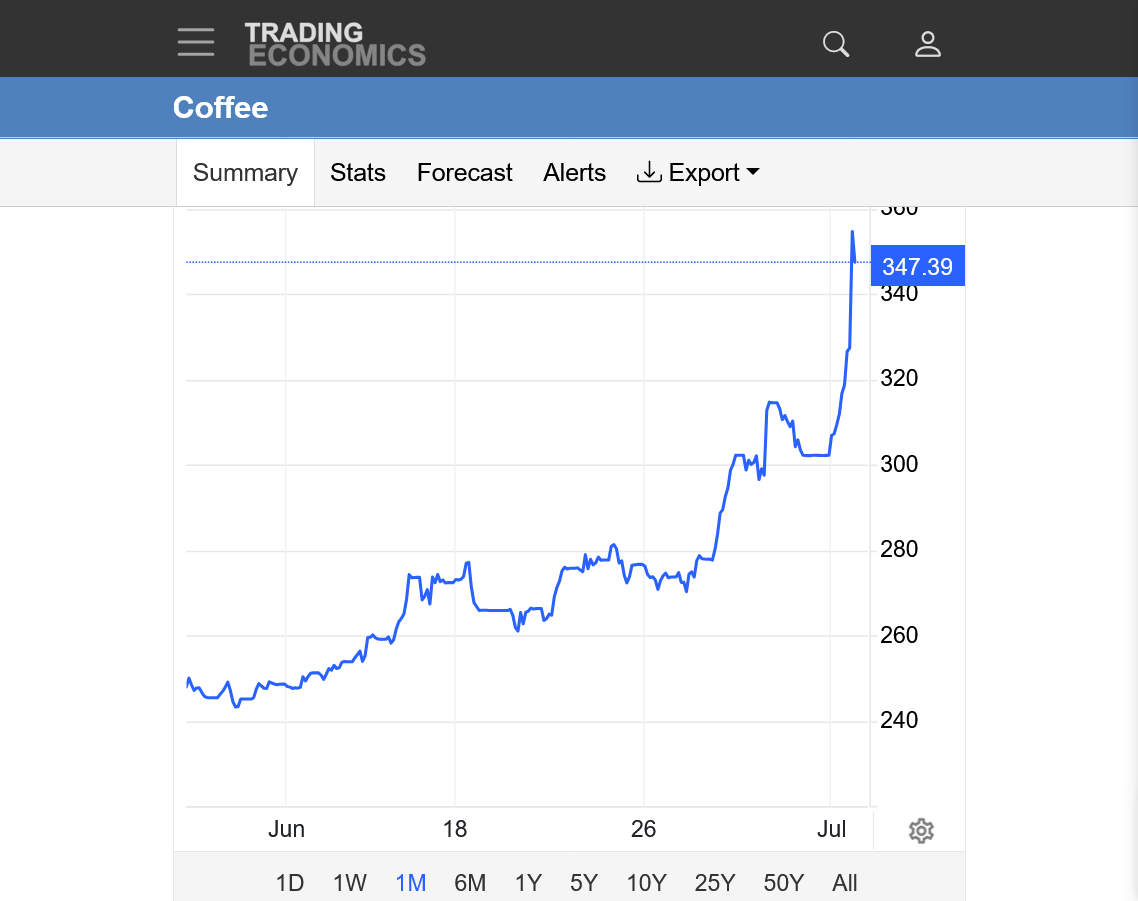
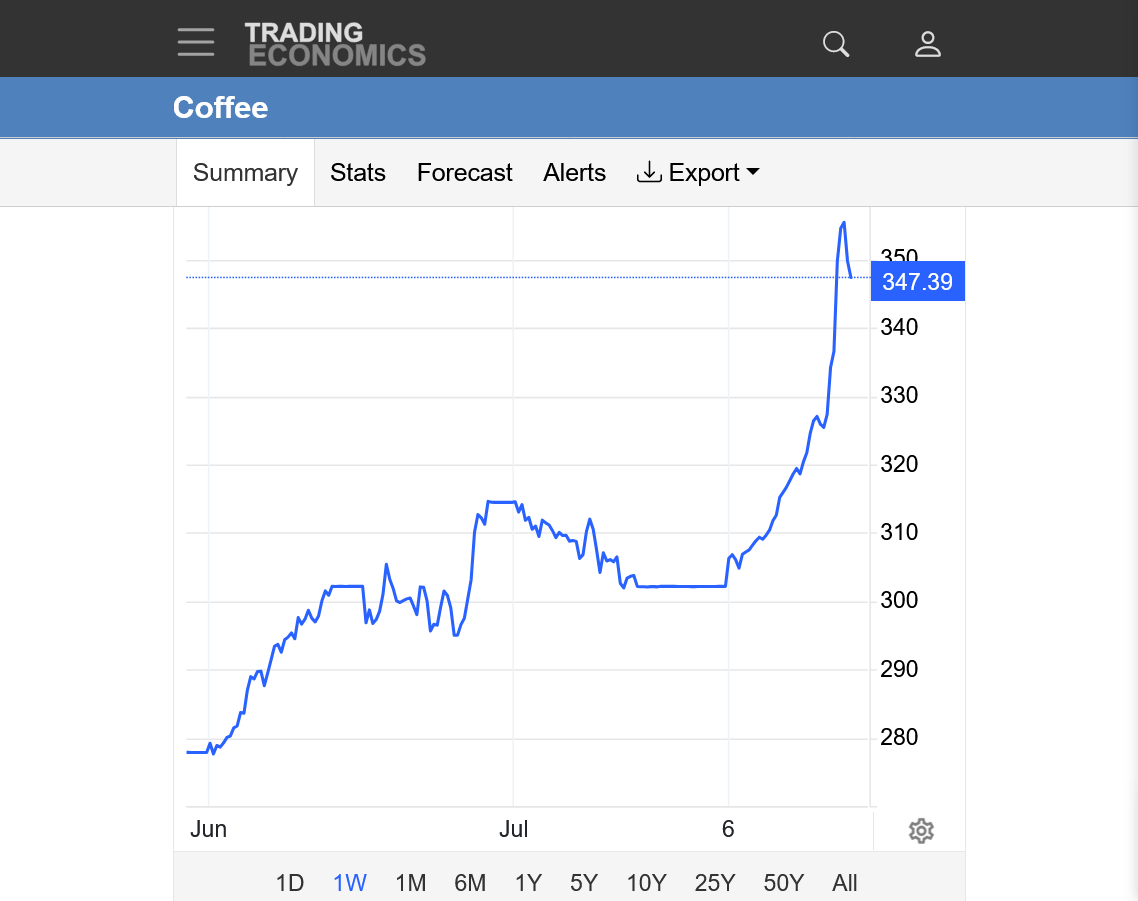
Wow!
We gave back most of the gains today!
https://tradingeconomics.com/commodity/coffee
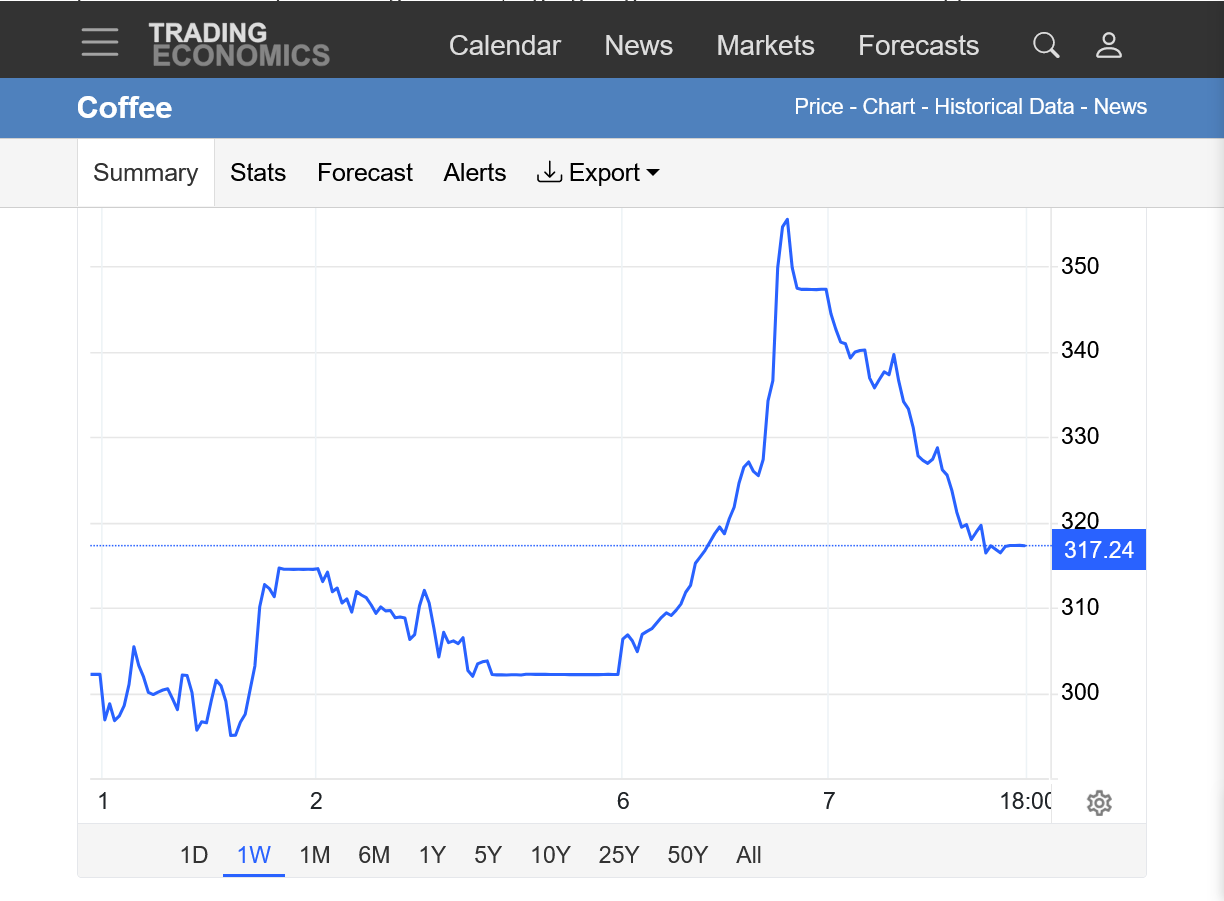
This was not from a freeze threat but it's how a freeze threat to coffee market can act......but never this magnitude in 2 days. This was easily a record.
+++++++++++++++++=
Below was from last month, when the market was not anticipating whatever caused this huge spike higher. Maybe everybody just got too bearish from the increasingly bearish news and the shorts were vulnerable on a price spike of yesterday's magnitude.
Yesterday's powerful move higher happened because there are no daily price limits for this type of coffee. This was a record.
++++++++++++++
This supports my theory but the magnitude of this extreme is shocking!
Appreciate you bringing it to our attention, knox10.
I've traded coffee numerous times in the past(freeze threats in the 90's/early 2000's) drought threats in recent decades and followed it for 3 decades. What makes it especially insane is that its coming in the midst of a predicted record harvest and big surplus in supplies. This is the sort of price volatility we expect when a market is going parabolic from price rationing in a severe shortage NOT a surplus!
A sudden burst of extreme price volatility in the coffee market has caught traders and analysts off-guard and left them bracing for more instability.
https://financialpost.com/pmn/business-pmn/wild-coffee-swings-usher-in-new-era-of-market-volatility
This was a recent coffee thread started last year. I'll use it to borrow some informative graphics and my previous research on coffee.
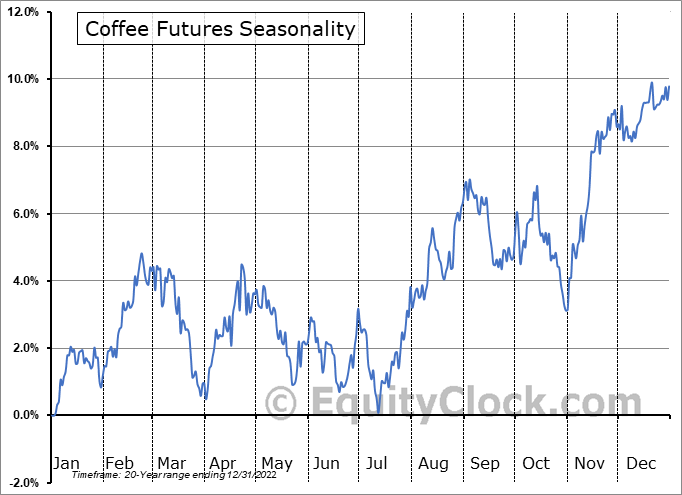
As mentioned previously, like with most crops, with coffee there is a well defined seasonal low ahead of or during harvest.
So our major, multi-year low in June was very consistent with what typically happens in most years with coffee prices.
With a record harvest predicted and big surplus, there was undoubtedly plenty of spec shorting that was built up after the double top above $4 at the end of last year.
Coffee dropped almost 50% between the December 2025 high and the spike low we just had in June. The COT would be interesting to see but one can guess that specs had created an unbalanced to the short side coffee market, vulnerable to short covering when the market hit the typical V bottom of harvest.
In this case, the expectations of record supplies that justified the building shorts suddenly had the rug pulled out from them when unusual June rains hit. I've not been following Brazil's weather so don't know if there really is major damage and this is nothing more than a delay in the harvest.
If all the shorts covered at once yesterday AT THE MARKET with nobody to sell to them, the price has no choice but to seek a level high enough to match the buy orders with sell orders.
I will guess that yesterday featured record smashing volume of mostly short covering(buyers) that couldn't find sellers close to the market. As it spiked to record smashing gains, no doubt shorts that were suddenly underwater and SHOCKED at the magnitude(considering their expectations of record supplies) were caught with their pants down and we saw waves of PANIC BUYING that provided fuel to positively reinforce the already unprecedented move up.
I would love to see the change in the positions of the specs before and after this as well as the volume and open interest stats. My guess is that open interest dropped with the massive spike higher as the large spec shorts got out.
The reason to suspect that, is how much of those gains were given up the very next day(today), suggesting this was not fundamentally justifiable right now in the minds of the Composite Man (totality of traders that ascertain the value/price).
When the short covering ran out of steam, the ammo for the record spike up was exhausted and traders understanding the actual intrinsic value of coffee on Tuesday were NOT buyers at the greatly inflated price on Monday.
In fact, those traders were SELLING on Tuesday because Monday's prices reflected a culmination of the unbalanced, unhealthy spec trade leaning the wrong way which got corrected in the most extreme manner in history in record fast time.
That's my take without having all the empirical data to prove it but using critical thinking and understanding of how markets work.
There are likely additional details that I don't know about. Regardless, this was the most insane 2 days of trading for coffee in its long history of trading!!!
https://charts.equityclock.com/coffee-futures-kc-seasonal-chart
Let's learn MUCH more and have some fun at the same time.
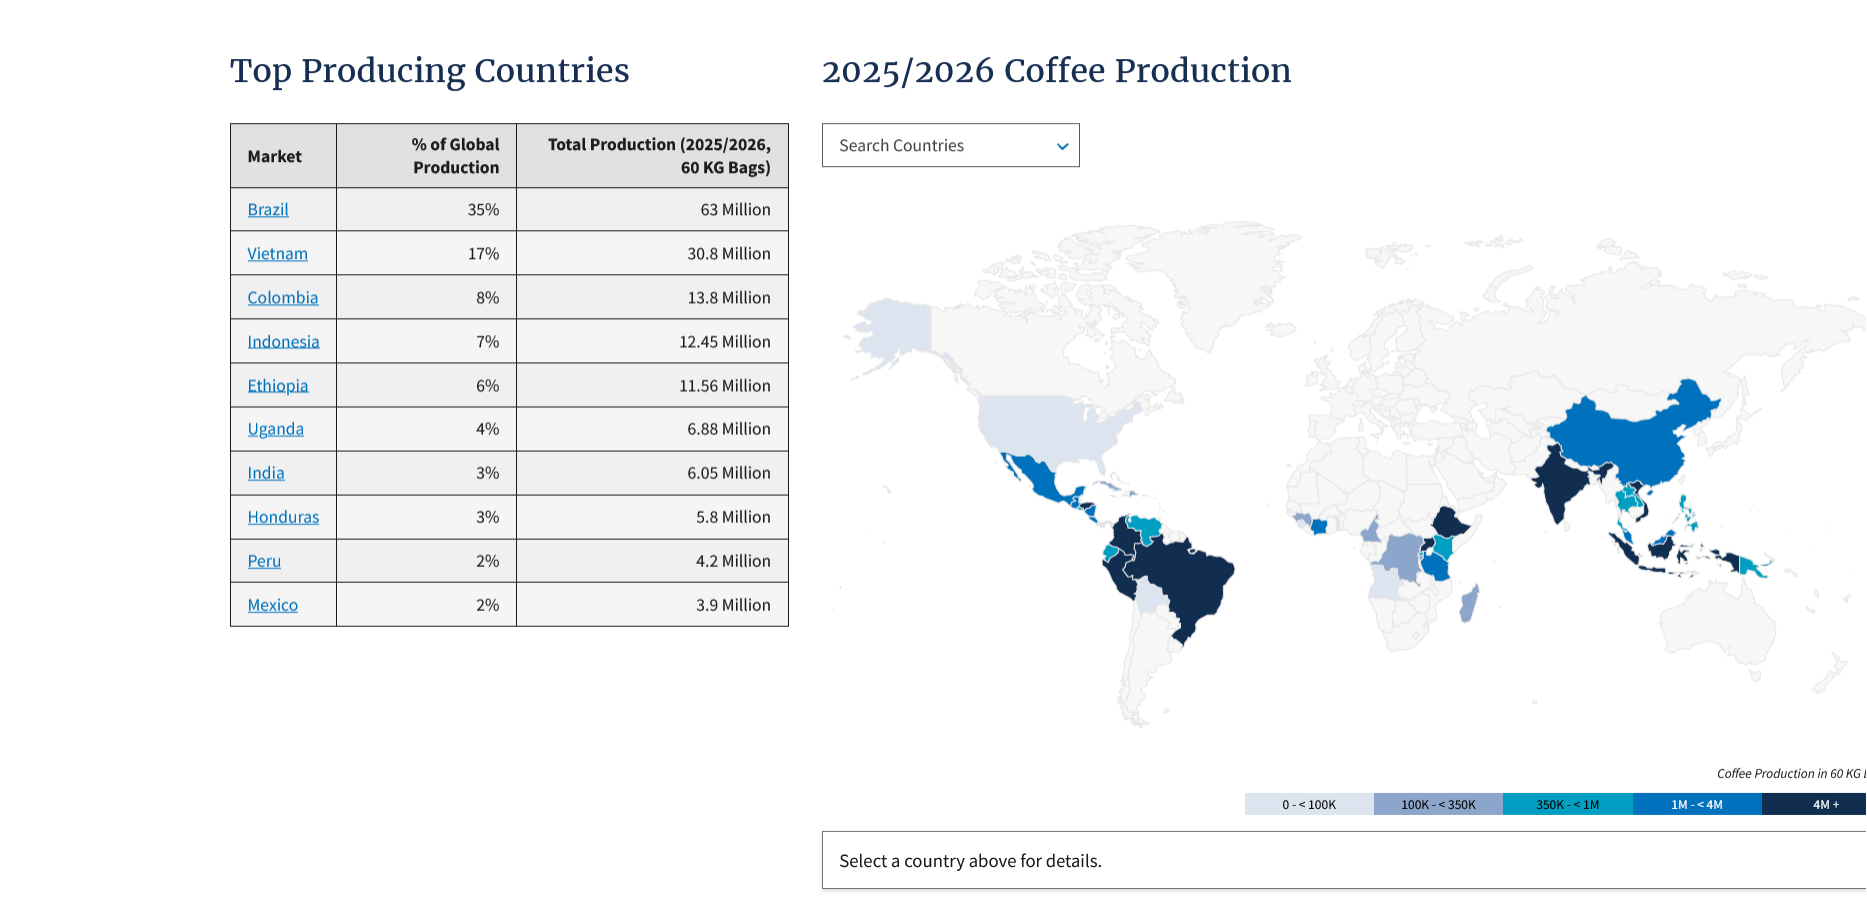
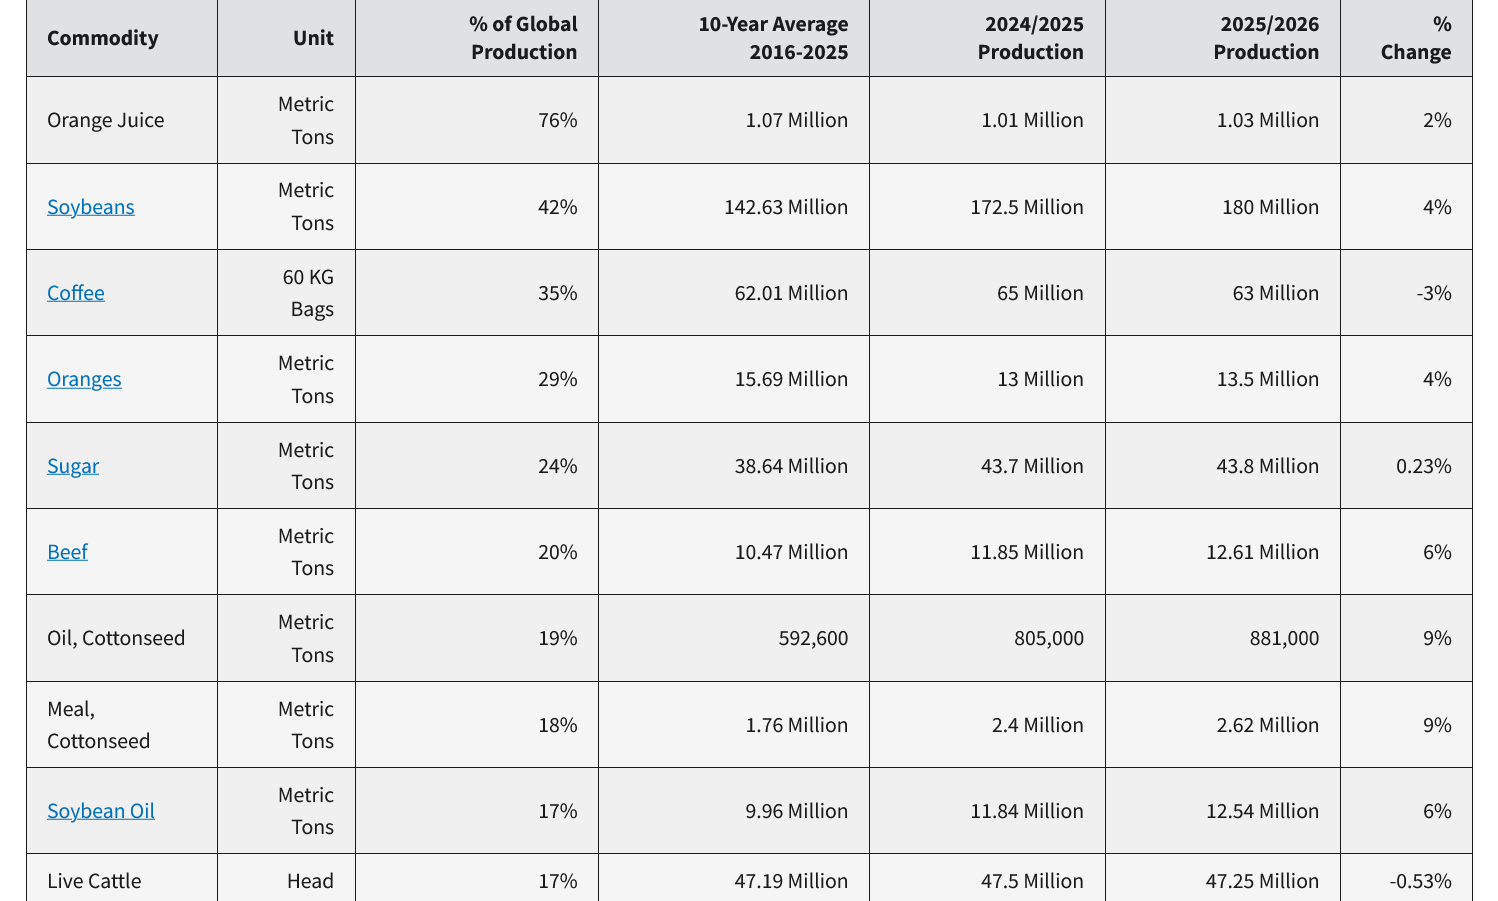
https://www.fas.usda.gov/data/production/br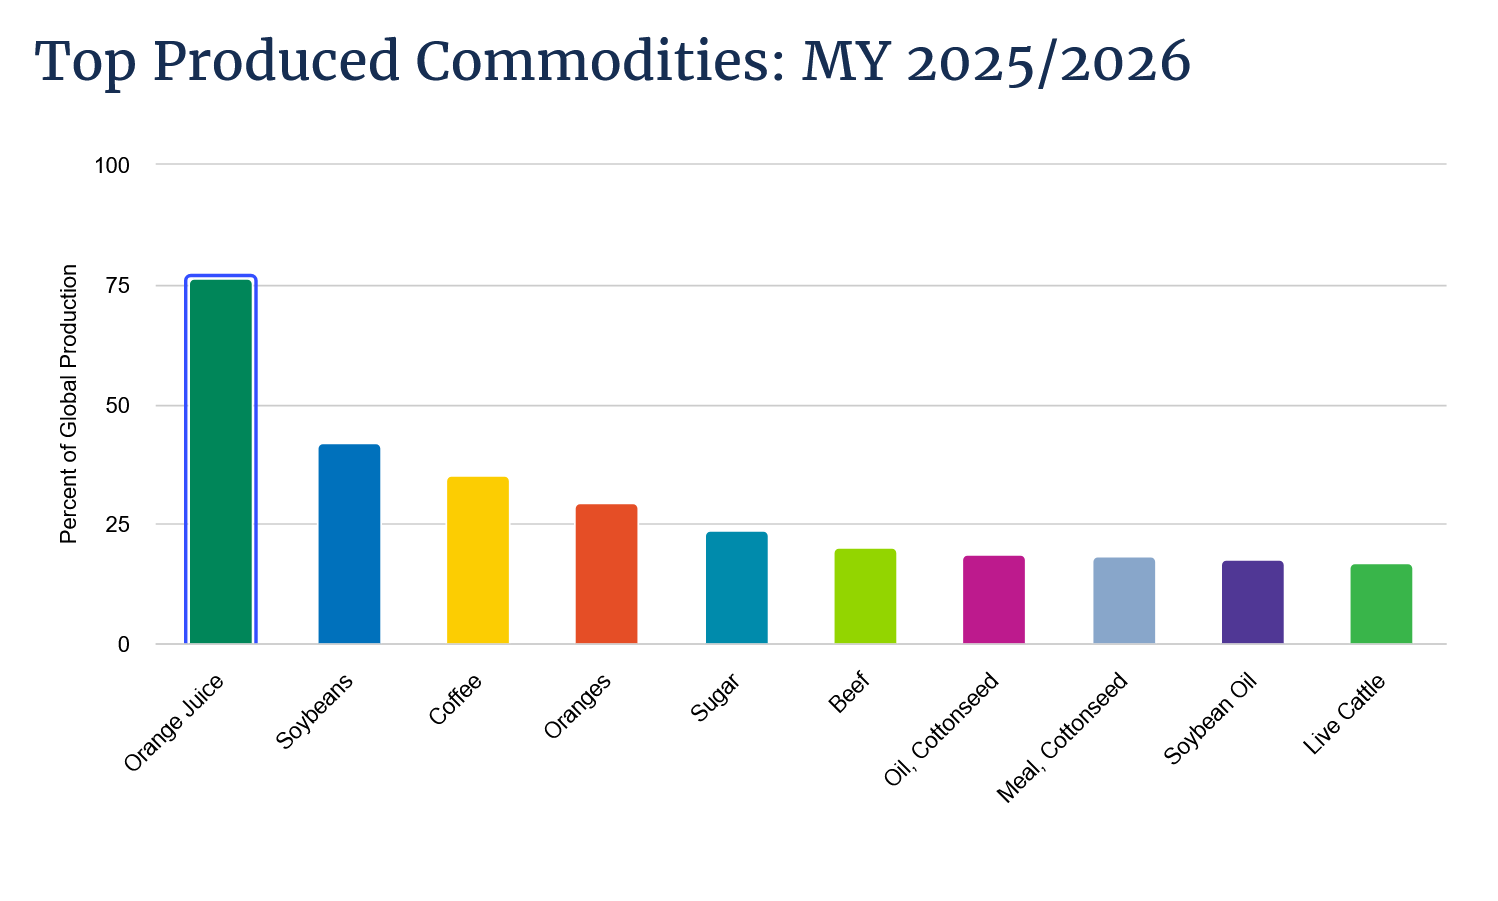
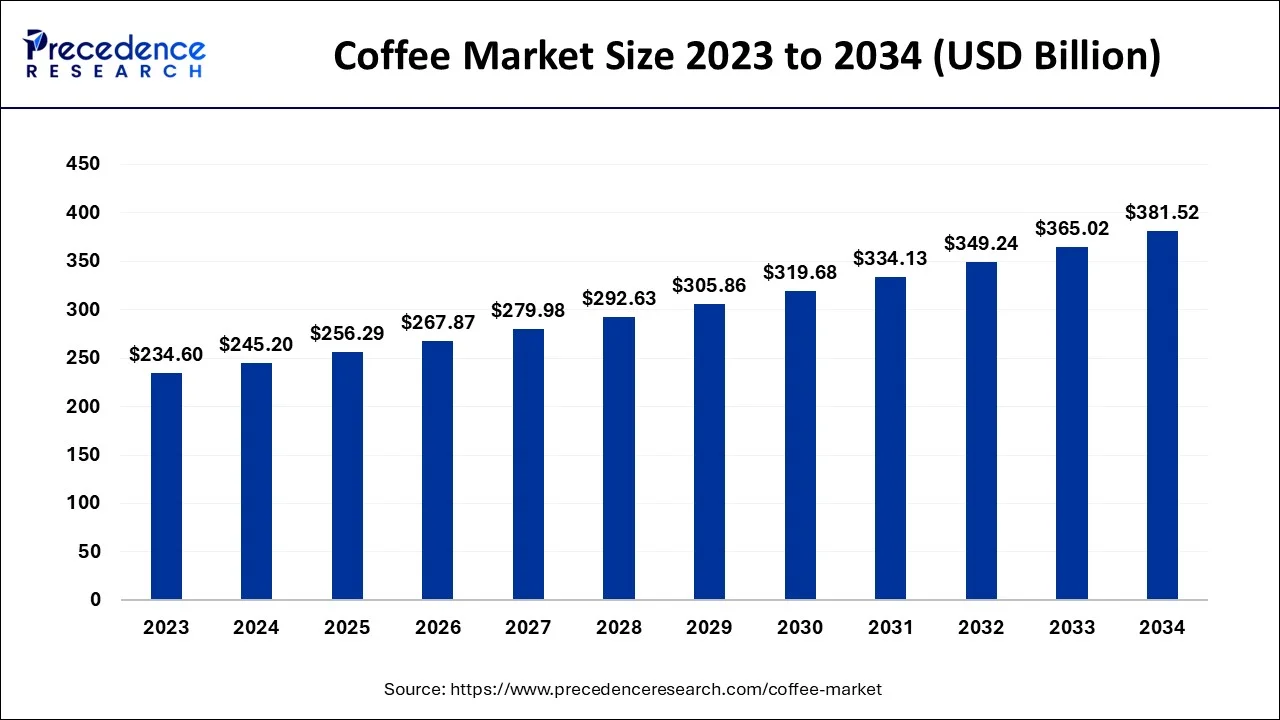
https://www.precedenceresearch.com/coffee-market
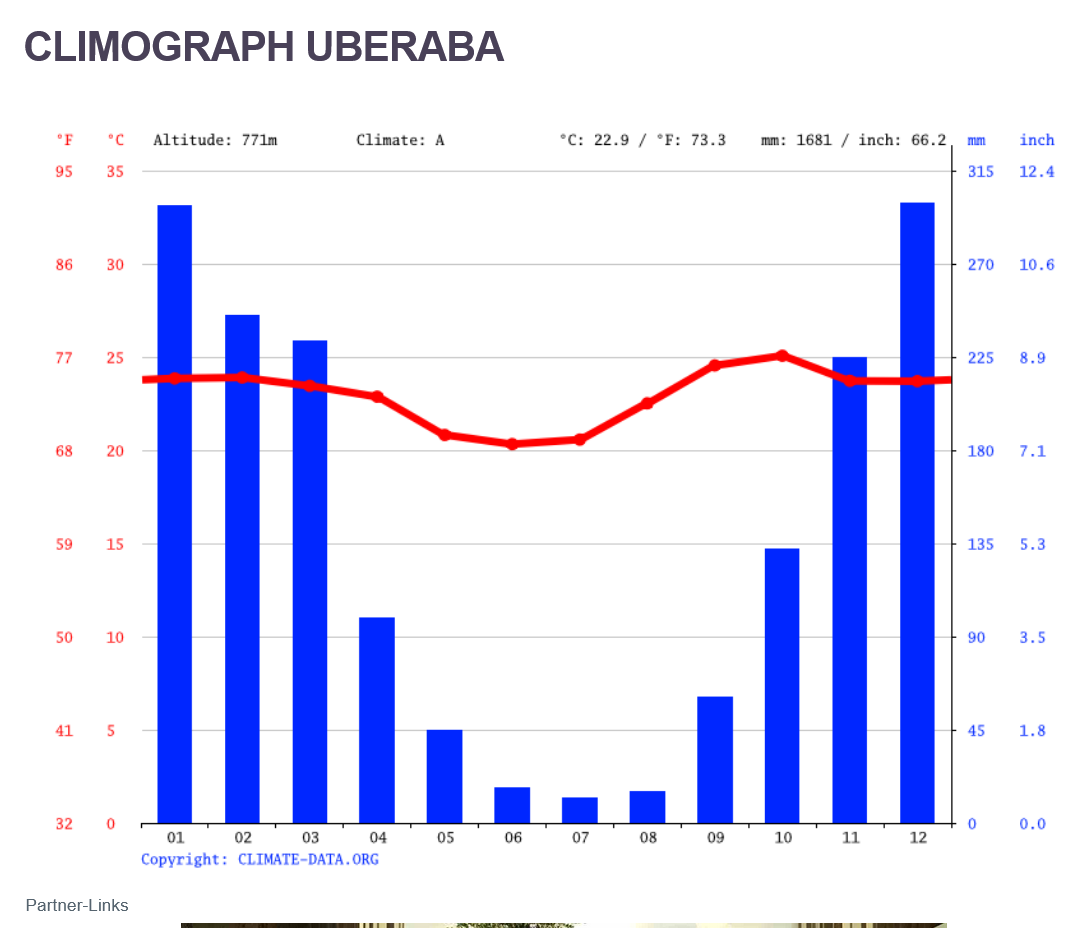
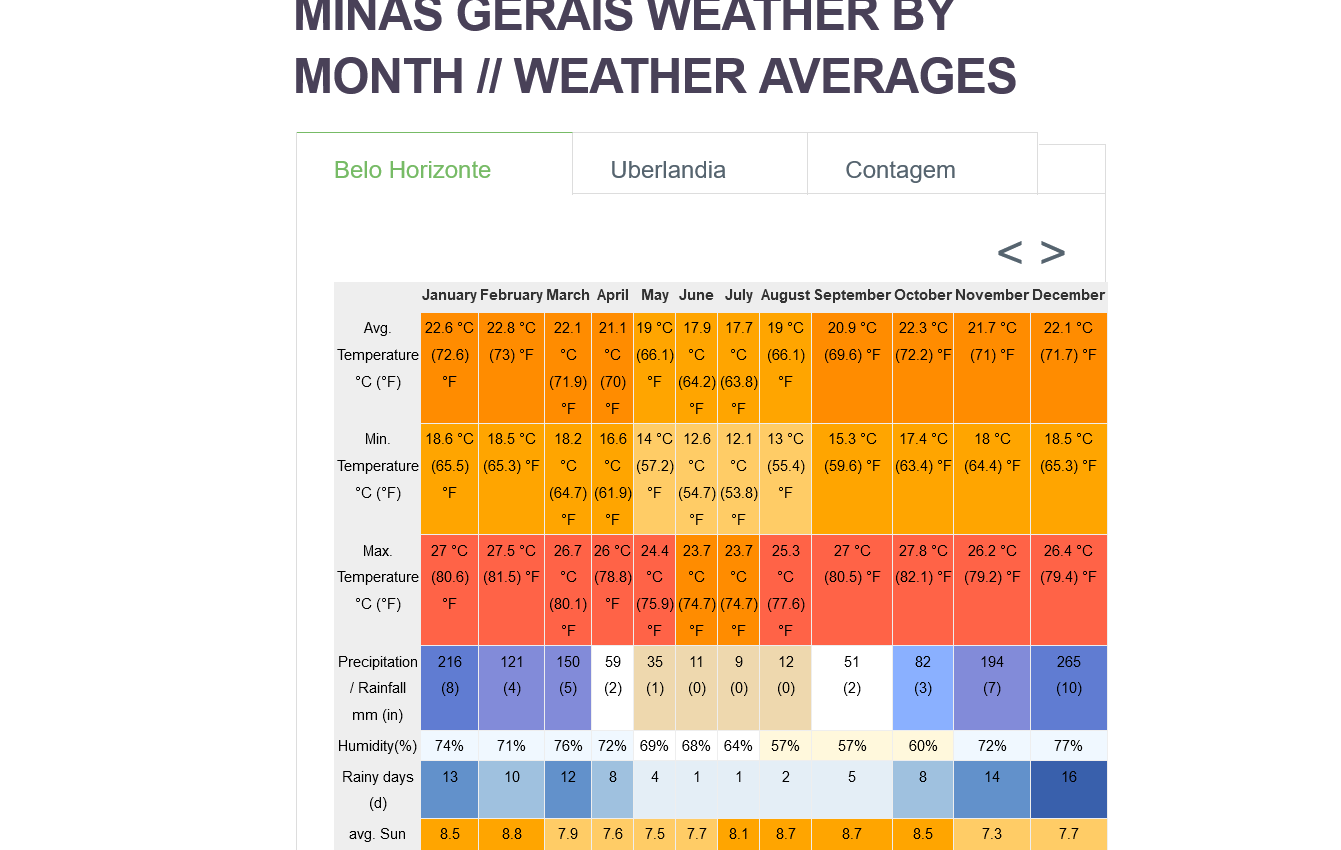
The tropical areas that grow coffee in Brazil have seasonal monsoon climates/weather.
During this time of year they have usually started their DRY season. It's Winter now and July in the Southern Hemisphere is like January in the Northern Hemisphere. Global warming has greatly reduced the risk of a freeze/frost but that can still happen in June-July and August (which is like Dec-Jan-Feb weather in the US).
Their wet season usually starts in October then really picks up in November. December/January are the wettest months, with nearly 12 inches/month!!! Then rains taper off in February and March.
https://en.climate-data.org/south-america/brazil/minas-gerais/uberaba-2878/#climate-graph
https://en.climate-data.org/south-america/brazil/minas-gerais-203/r/february-2/#monthly-weather-data
This is an incomplete list, only going thru 2000.
Coffee Frost and Drought History
https://www.coffeeresearch.org/market/frosthistory.htm
| Date | Severity (Damage) | Coffee Frost or Drought |
| 1902 (Late July/early August) | Devastating | F* |
| 1918 (June 24-26) | Severe | F* |
| 1942 (Late June/early July) | Severe | F* |
| 1943 | Moderate | F* |
| 1953 (July 4-5) | Severe | F* |
| 1955 (July 30-August 1) | Severe | slight F |
| 1957 | Severe | F* |
| 1962 (July 25-26) | Minor | F* |
| 1963 (August 5-6) | Moderate | F and D |
| 1965 | Minor | F* |
| 1966 (August 6) | Severe | slight F |
| 1967 (June 8) | Minor | F* |
| 1969 (July 9-10) | Moderate | F* |
| 1972 (July 8-9) | Moderate | F* |
| 1975 (July 17-19) | Very Severe | F* |
| 1978 (August 13-16) | Moderate | F* |
| 1979 (June 1) | Moderate | F* |
| 1981 (July 20-22) | Severe | F* |
| 1984 (August 25) | Minor | F* |
| 1985 (August-November) | Minor | D |
| 1988 | Minor | F* |
| 1994 (June 25-26 and July 9-10) | Severe/Very Severe | F and D |
| 1999 (August to November) | Severe (40% crop lost) | D |
| 2000 (July 17) | Moderate (est) | F* |
* In most cases frost or drought was not indicated by the source. Although only F is written in these cases it is likely a combination of the two forces that caused a devastating coffee crop.
Source: International Coffee Organization who also sourced the information from Reuters.
++++++++++++++++=
AI Overview

 black frosts". Significant coffee freezes in Brazil have historically occurred on the following dates and seasons:
 Don't believe the stories about climate change hurting crops, especially world wide, supposedly from the extreme weather, especially droughts.
Droughts were MUCH worse in the past, especially under global COOLING.
The increase in CO2 from 290 parts per million to the current 430 parts per million were the best thing that ever happened to most crops, especially coffee!!!!
AI Overview
Some of the worst droughts in history are defined by their devastating death tolls, massive geographical scales, and catastrophic societal collapses. Based on historical and paleoclimatic records, the ten most severe droughts and resulting famines include:
There have been several major droughts in the past 2 decades in Brazil. There could have a slight impact from super imposing 1 deg. C of warming on the atmosphere but the more extreme the weather/climate is, the more of it was caused by natural variation!
It really boils down to this, once again(Cliff Mass can be counted on as an elite source for using objective, authentic science)
https://cliffmass.blogspot.com/2016/03/the-golden-rule-of-climate-extremes.html
The GoldenRule
Considering the substantial confusion in the media about this critical issue, let me provide the GOLDENRULE OF CLIMATE EXTREMES. Here it is:
The more extreme a climate or weather record is, the greater the contribution of natural variability.
Or to put it a different way, the larger or more unusual an extreme, the higher proportion of the extreme is due to natural variability.
https://en.wikipedia.org/wiki/Coffee_production_in_Brazil
You should use this map when I post weather maps with forecasts for Brazil to see where coffee land is on the weather maps.
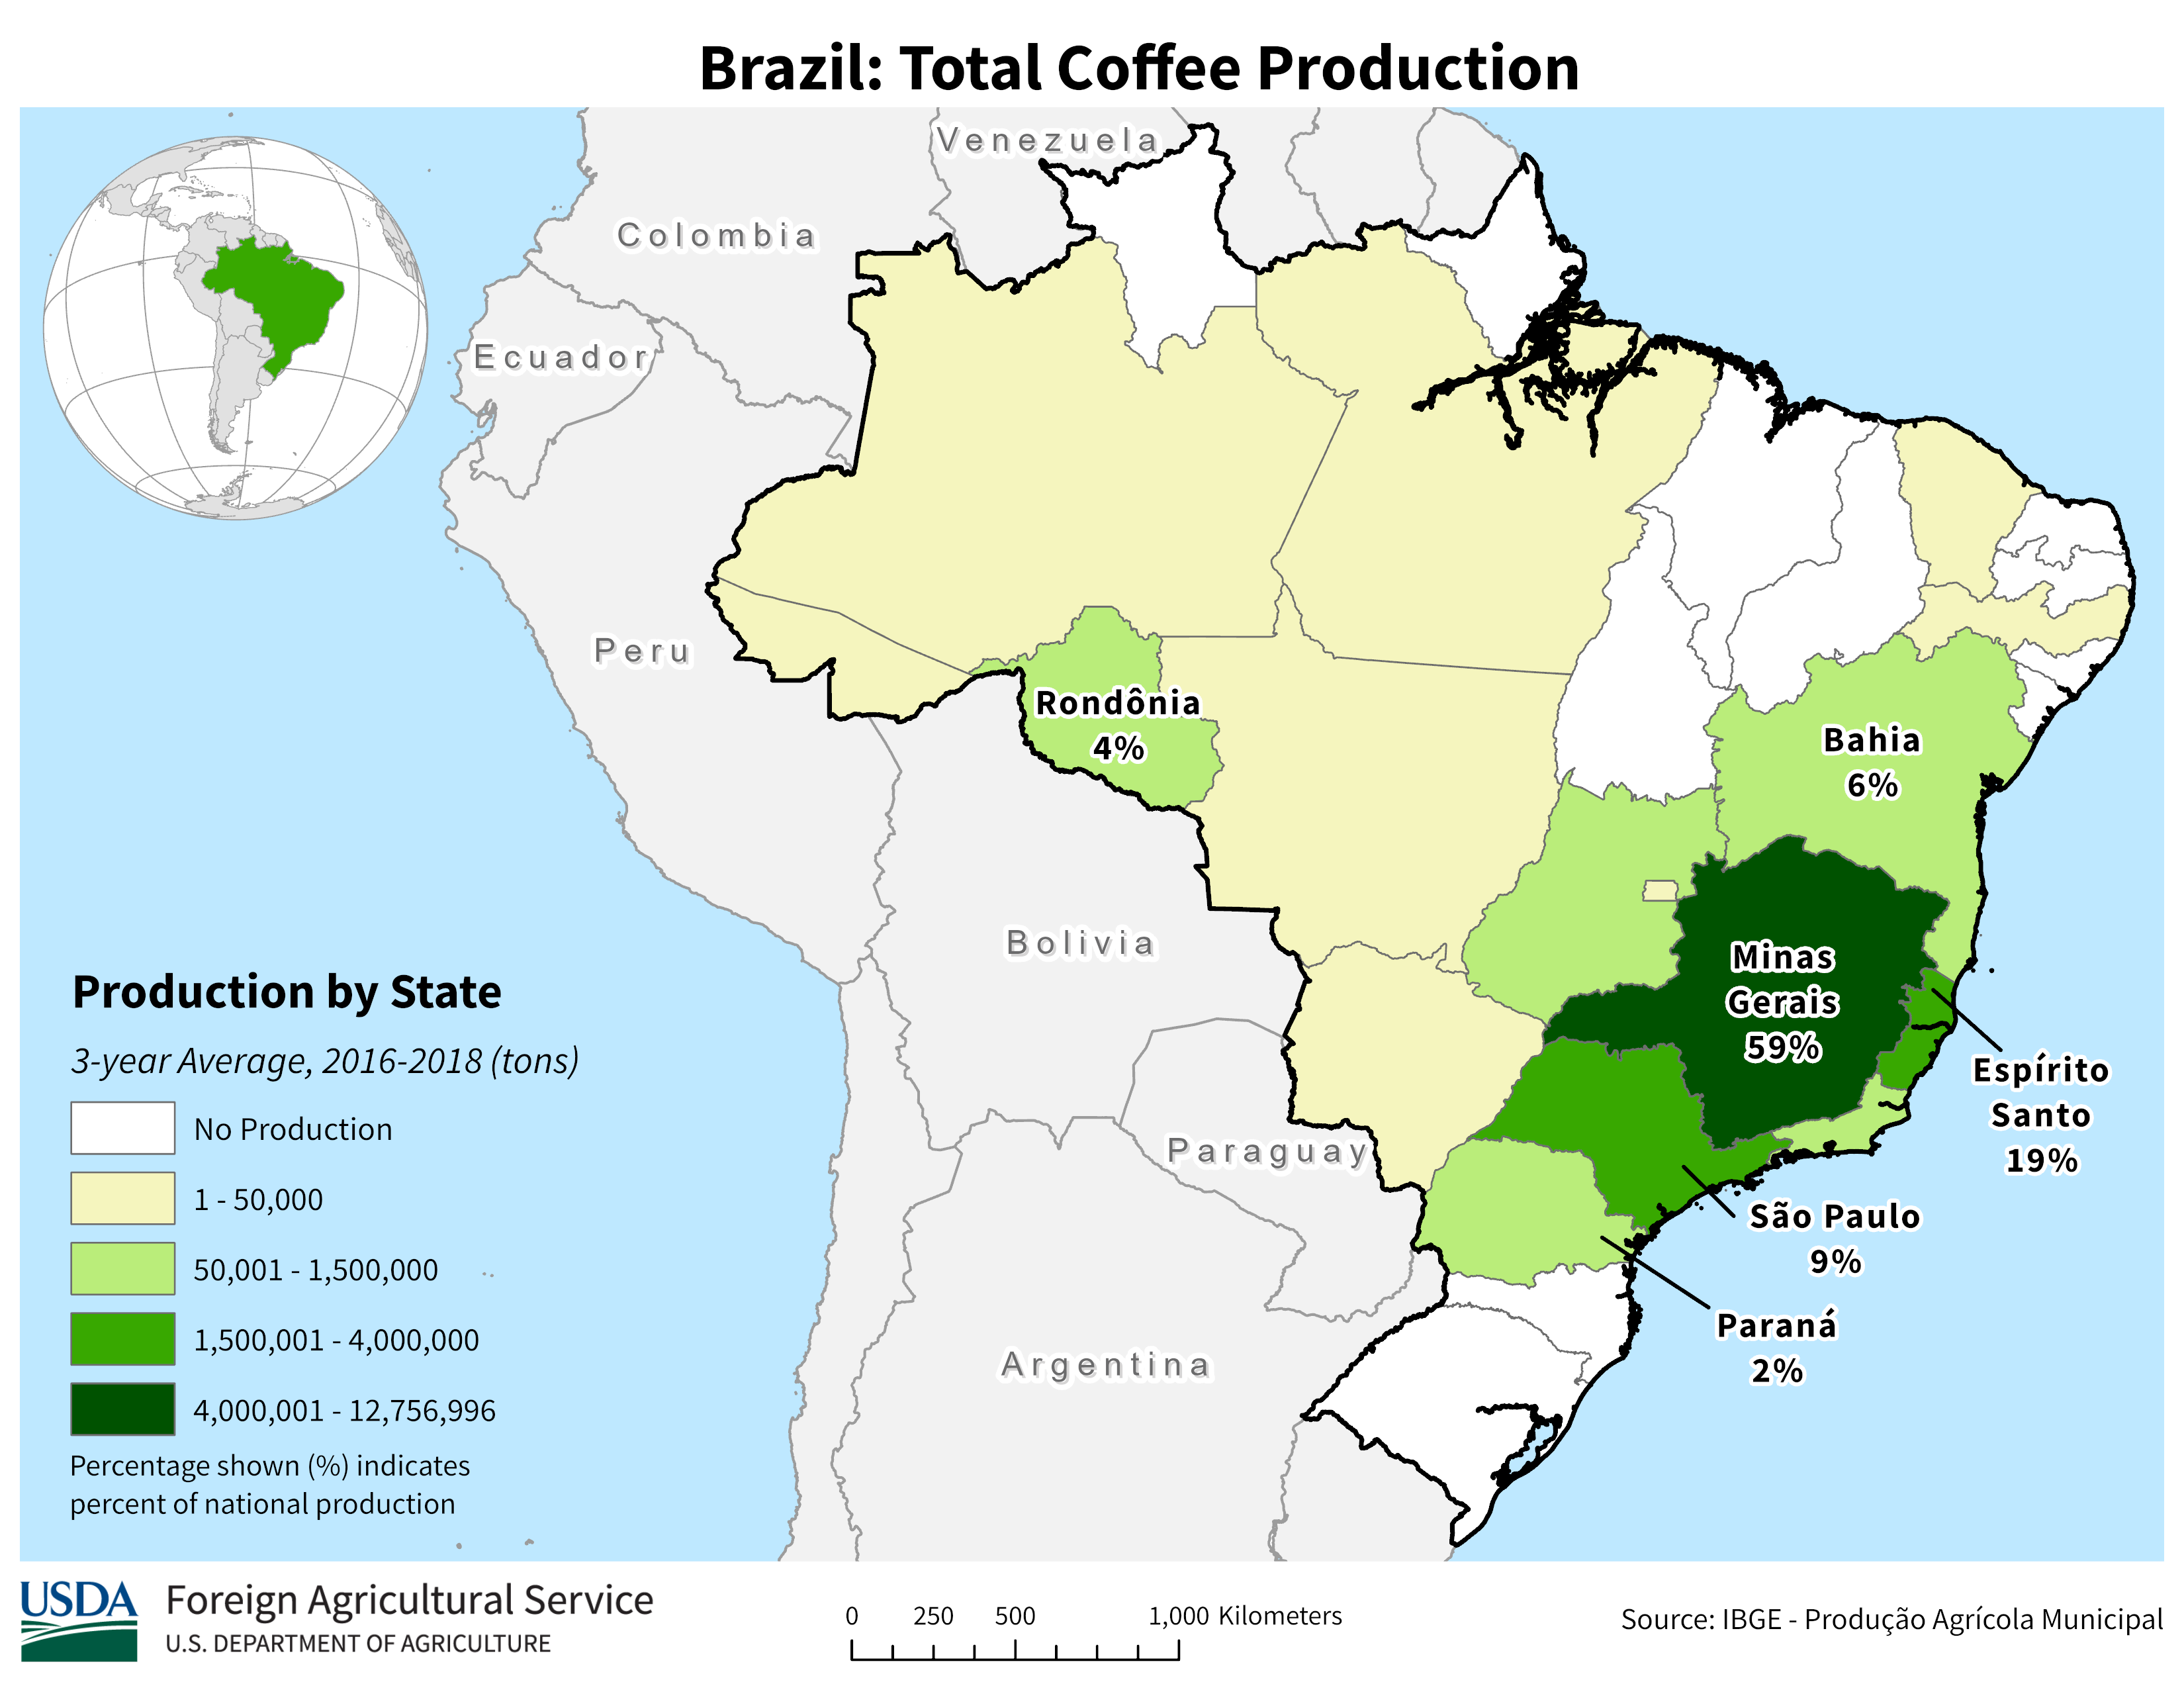
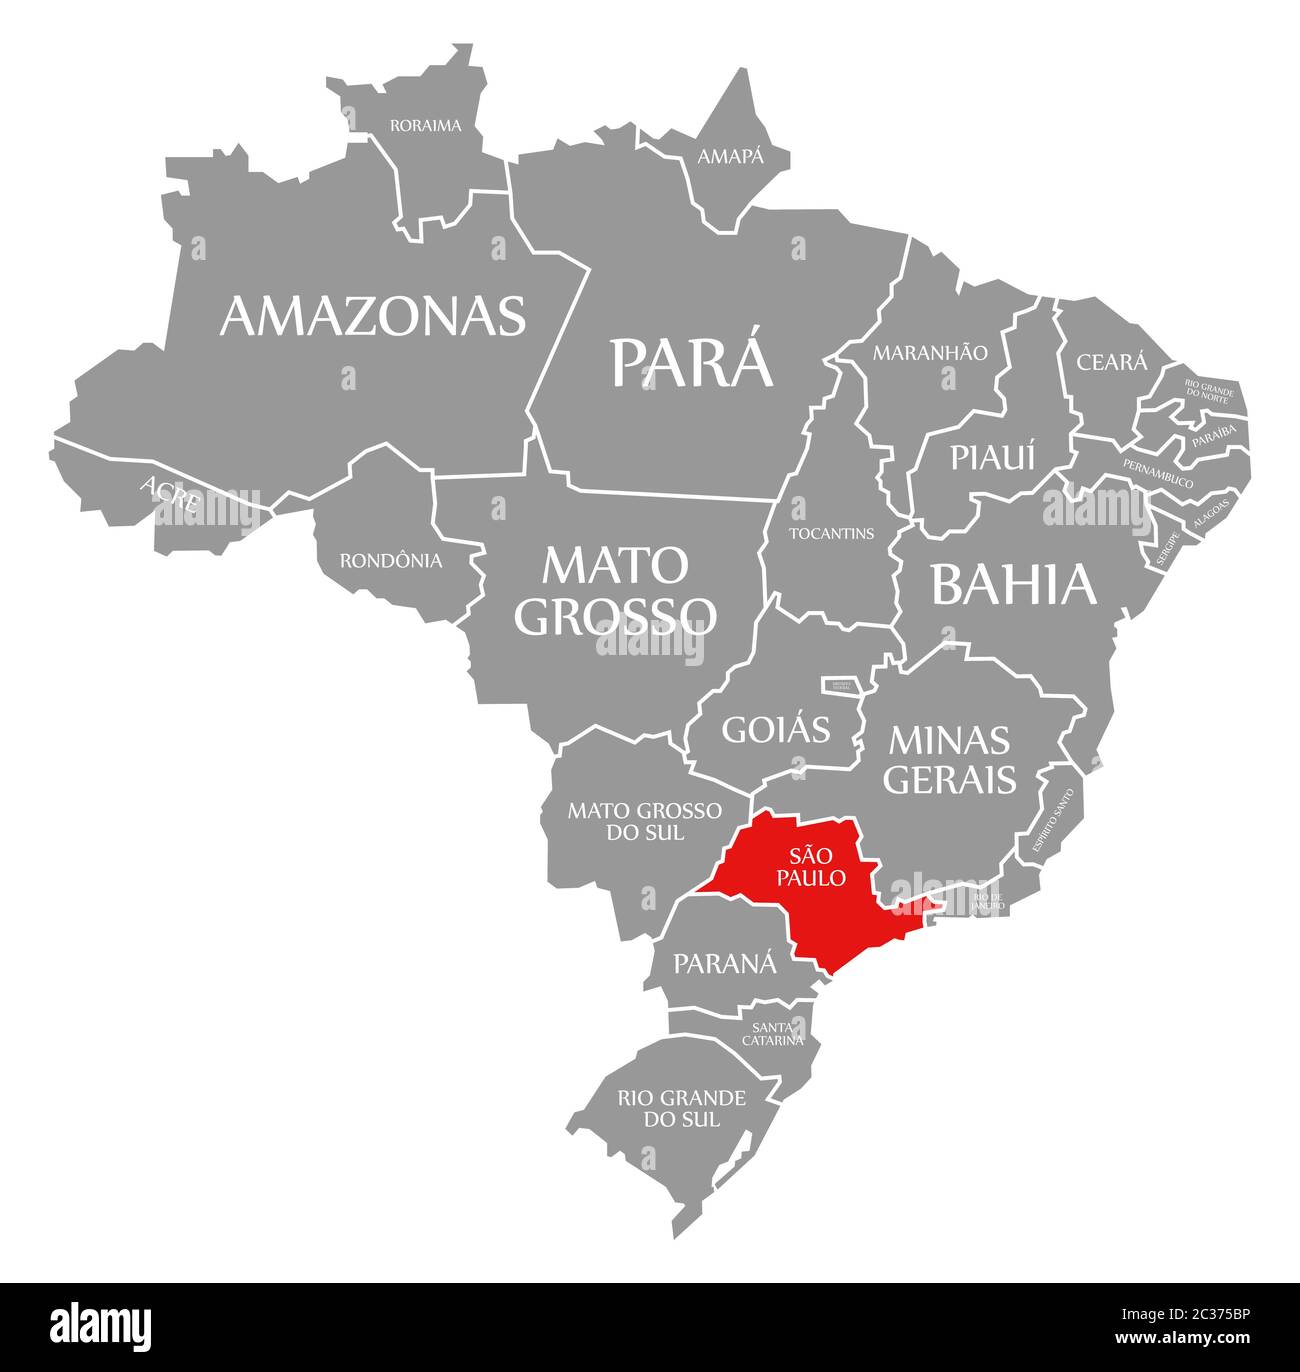
This is the place that has the VAST majority of the world's OJ production:
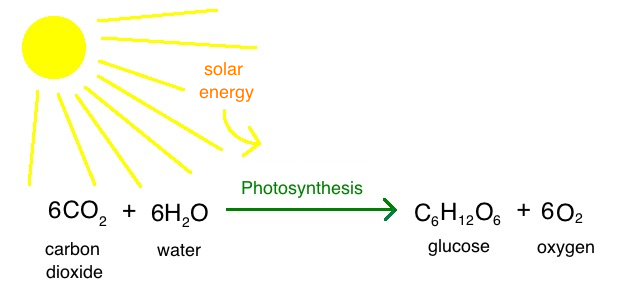
Now, lets learn a bit more and APPLY IT.
Greenhouses know more about growing plants than anybody. Here's a wonderful recent authentic plant science discussion from a greenhouse, chosen because Graphs and charts are pictures worth a thousand words.
This article was written by Oklahoma State University to educate greenhouse growers about CO2 enrichment on plants. The objective is completely independent of their opinion on climate change which is never mentioned or never implied.
Far too much mainstream research on this topic is married to an alarmist narrative and assumption that CO2 will lead to catastrophic global warming of the planet based on flawed global climate model simulations of the future atmosphere using mathematical equations that can’t accurately represent the impact of changes in factors like clouds and the massive greening of the planet from photosynthesis.
https://extension.okstate.edu/fact-sheets/greenhouse-carbon-dioxide-supplementation.html
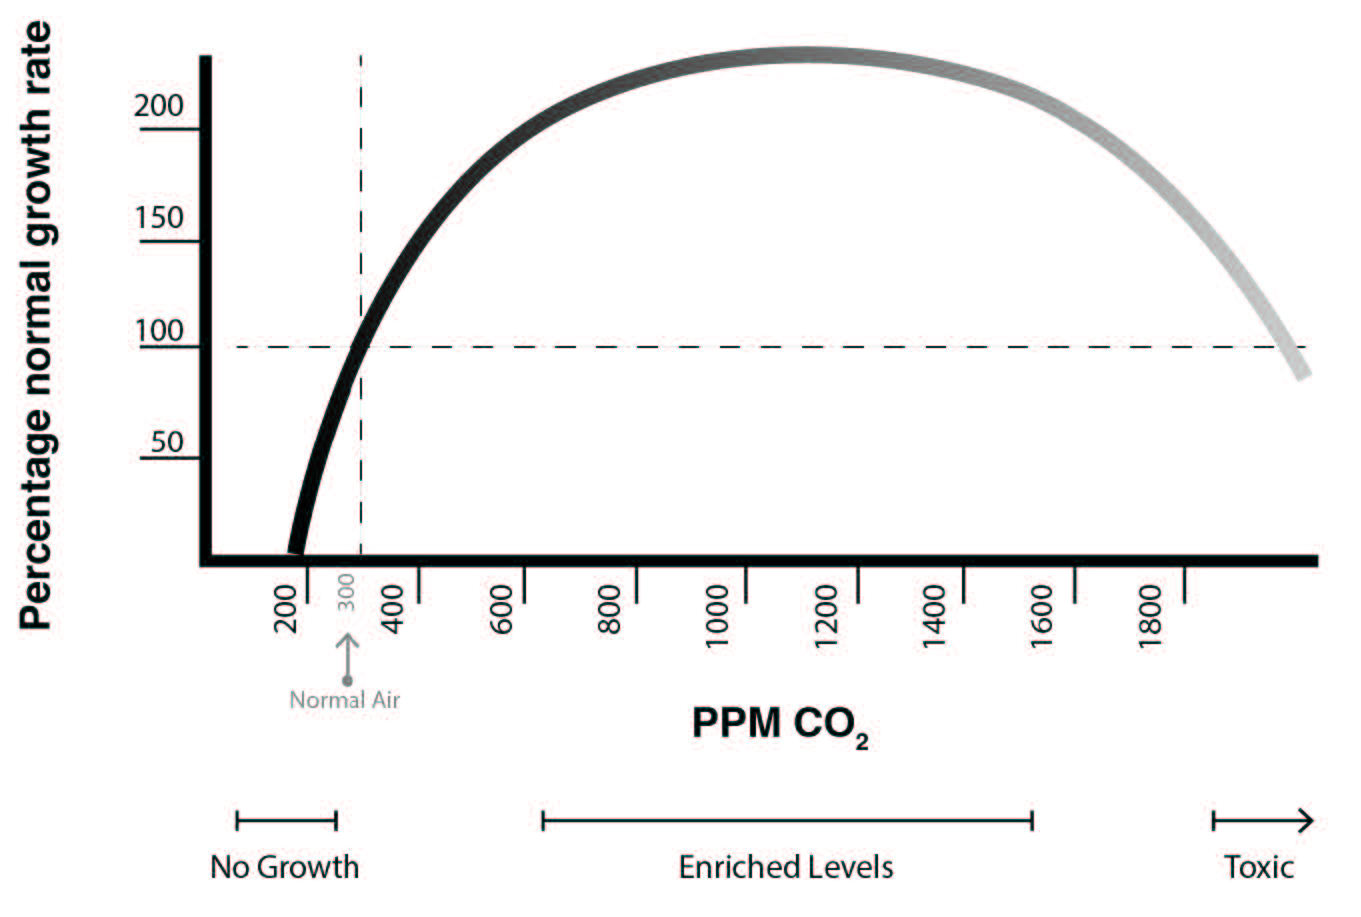
Several important things to note from this graph.
1. When CO2 gets just below 200 ppm, photosynthesis SHUTS DOWN. Look at the range above and think about where atmospheric CO2 was on this graph in the 1870's at just 290 ppm.on the far left!! If we had dropped just 100 ppm, (instead of increasing 135 ppm) none of us would be here. Our planet was in extreme CO2 starvation mode and at the steepest part of the curve where small changes have the biggest impact.
2. It's tough to line things up perfectly but let’s track along the path of the line from 290 ppm to 425 ppm. I get closer to a 70% change (80% to 150%) from 1870's to 2024. . Since this coincides to one of the steepest parts of the curve(low CO2) its actually a very reasonable value but lets just call it 60% to be safely conservative.
3. So the rate of increase in photosynthesis was probably more like +1% for every +3 ppm increase before the year 1900 and has slowed a bit in recent years to around +1% every +5 ppm and later this century will be more like +1% for every +7 ppm.
4. The rate of increase in growth starts flattening out with increasing CO2 and tops out at just over 1,000 ppm. I've been stating that 900 ppm is the optimal level to be conservative and it varies by plant. For wheat, numerous studies show it as just over 900 ppm.
+++++++++++++++++
This next graph is where we really learn something new that NEVER gets discussed but is extremely profound.
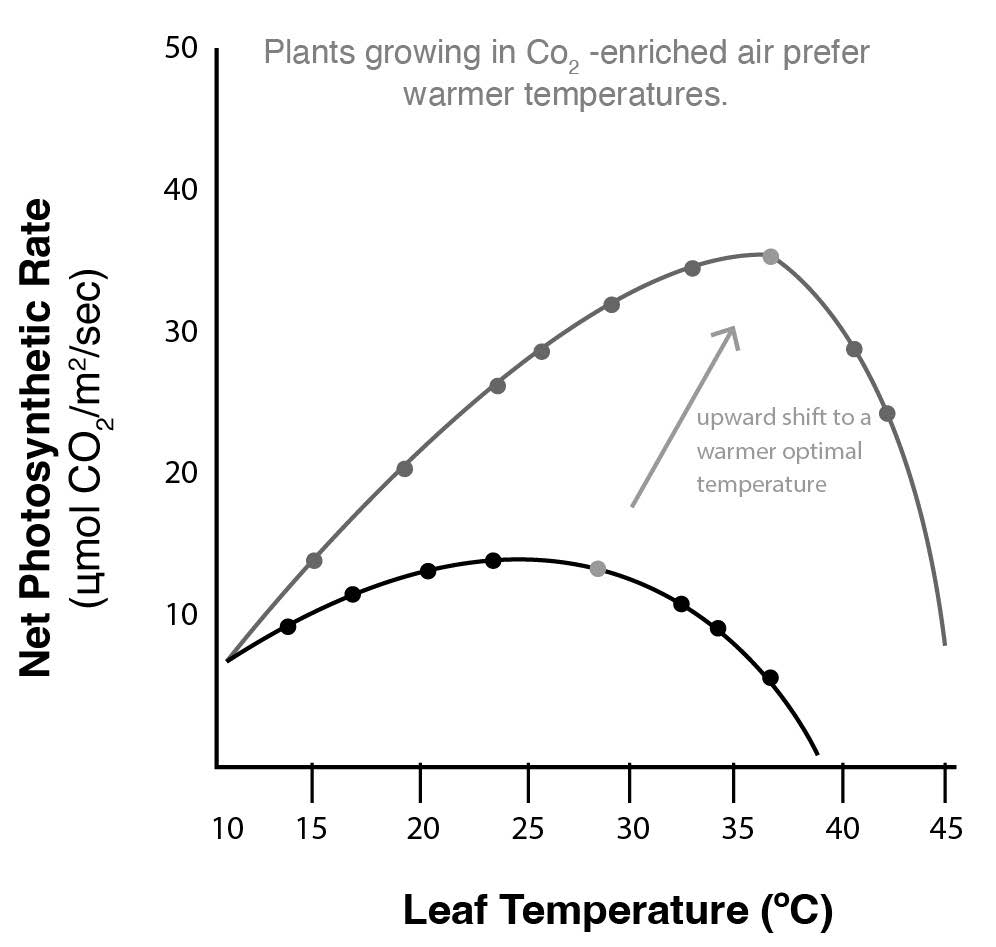
Temperature plays a big role in the rate of plant growth. Most biological processes increase with increasing temperature and this includes the rate of photosynthesis.
But the optimum temperature for maximum photosynthesis depends on the availability of CO2. The higher the amount of available CO2, the higher the optimum temperature requirement of crops (Figure 2). In a greenhouse supplemented with CO2, a dramatic increase in the growth of plants can be observed with increasing temperature. Supplemental CO2 increases the optimum temperature requirement of a crop. This increases production even at higher temperature, which is not possible at the ambient CO2 level.
Supplemental CO2 affects the physiology of plants through stomatal regulation. Elevated CO2 promotes the partial closure of stomatal cells and reduces stomatal conductance. Stomatal conductance refers to the rate of CO2 entering and exiting with water vapor from the stomatal cell of a leaf. Because of reduced stomatal conductance, transpiration (loss of water from leaf stomata in the form of water vapor) is minimized and results in an increased water use efficiency (WUE) (ratio of water used in plant metabolism to water lost through transpiration). Lower stomatal conductance, reduced transpiration, increased photosynthesis and an increase in WUE helps plants to perform more efficiently in water-stressed conditions. Supplemental CO2 reduces water demand and conserves water in water-scarce conditions.
++++++++++++++++++++++
1. The higher the CO2 level is in the atmosphere, the better that plants do with increasing temperatures compared to plants with lower CO2.
2. The higher the CO2 level is in the air, the better that plants do in drought Compared to a lower CO2.
+++++++++++++=
This source below has more plants studies with enriched CO2 than any other source.
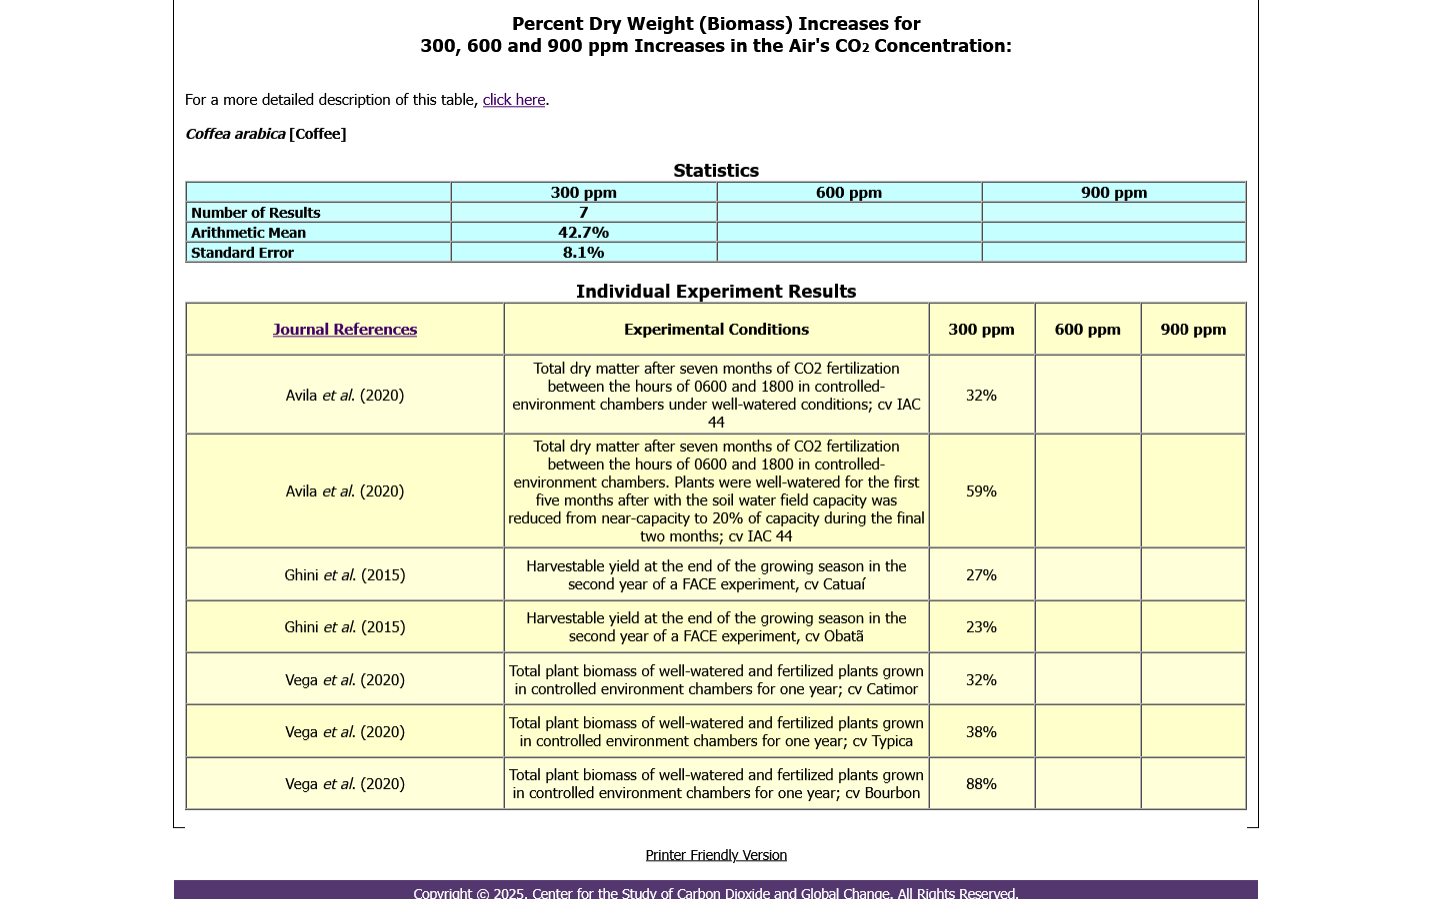
At this link, go do"data" then "plant growth", then dry weight biomass, then the letter C. Then coffee.
The increase in CO2 impacts coffee MUCH more than most plants because woody stemmed plants benefit the most!!!!!
| +300 ppm | ||||||||
| Plant Name | Number of Studies | Arithmetic Mean | Standard Error | |||||
| Coffea arabica [Coffee] | 7 | 42.7% | 8.1% | ||||||
| Coffea arabusta [Coffee] | 2 | 175.5% | 76.7% | ||||||
| Coffee [Coffea arabica] | 7 | 42.7% | 8.1% | ||||||
| Coffee [Coffea arabusta] | 2 | 175.5% | 76.7% |
Hit the name of the plant and get the details of the studies!
https://www.co2science.org/data/plant_growth/dry/c/coffeaar.php