Previous thread with the last post below :
NG 12/25/24+ and Merry Chistmas
64 responses |
Started by WxFollower - Dec. 25, 2024, 12:09 a.m.
https://www.marketforum.com/forum/topic/109155/
+++++++++++++++++++++++++++++++++++
Re: Re: Re: Re: NG 12/25/24+ and Merry Christmas
By metmike - Jan. 12, 2025, 3:37 p.m.
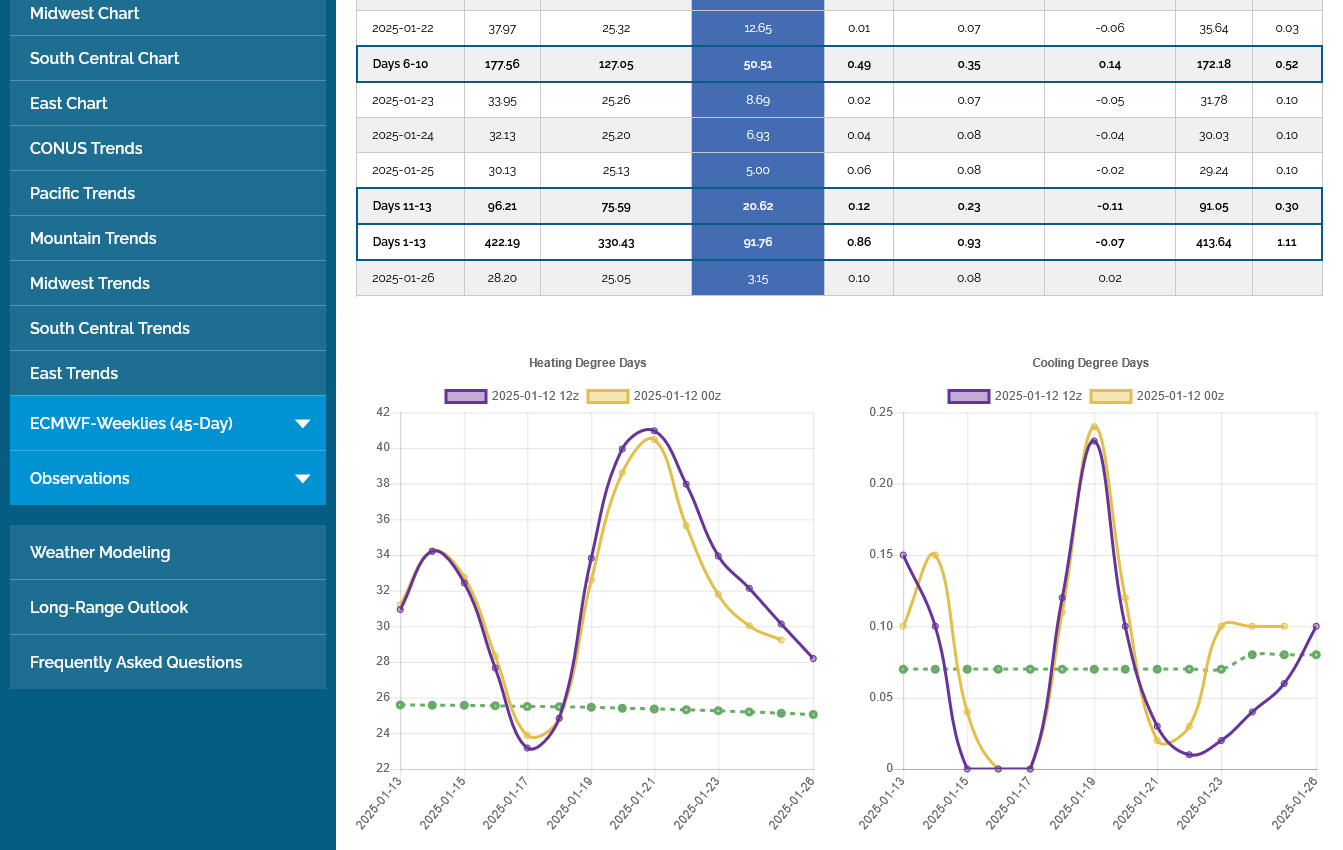
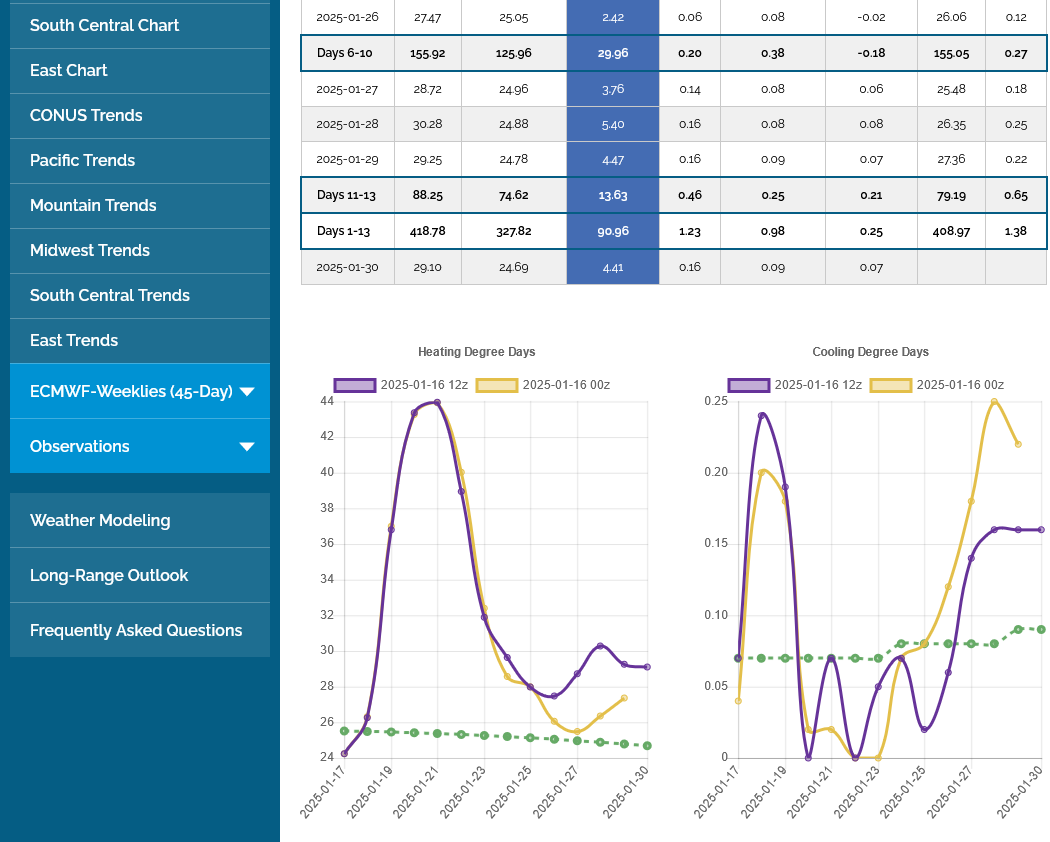
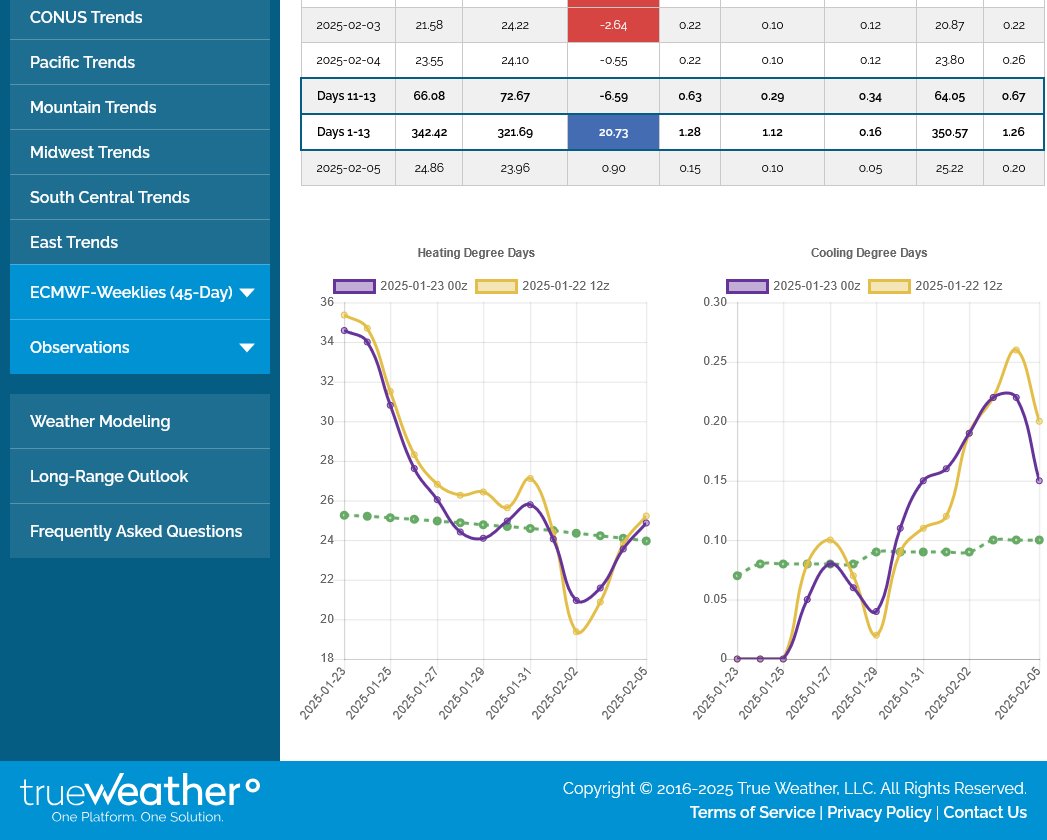
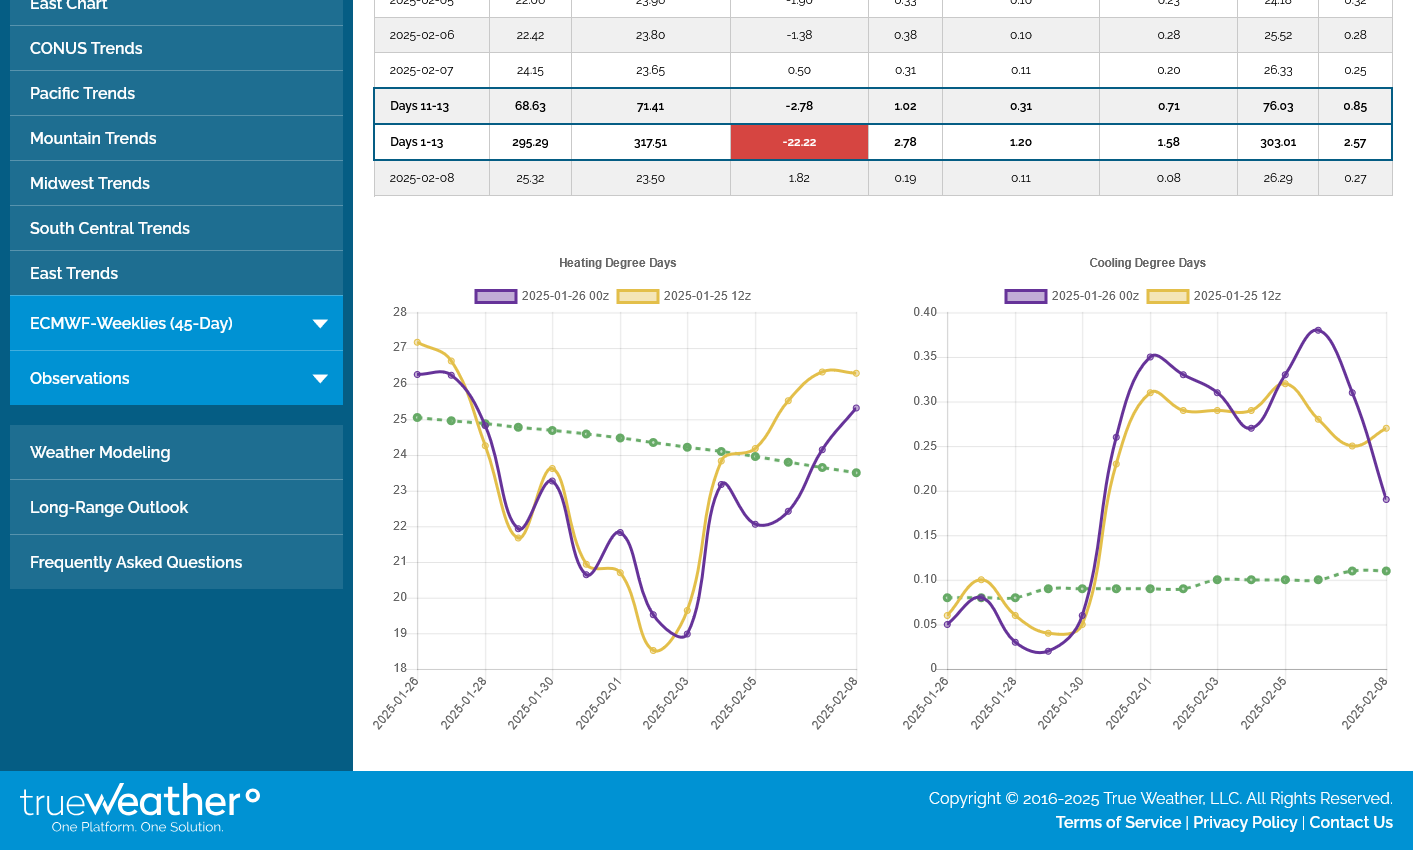
+8.5 HDDs on the last 12z European Ensemble vs the previous 0z but look at the trend at the end DOWNWARD!
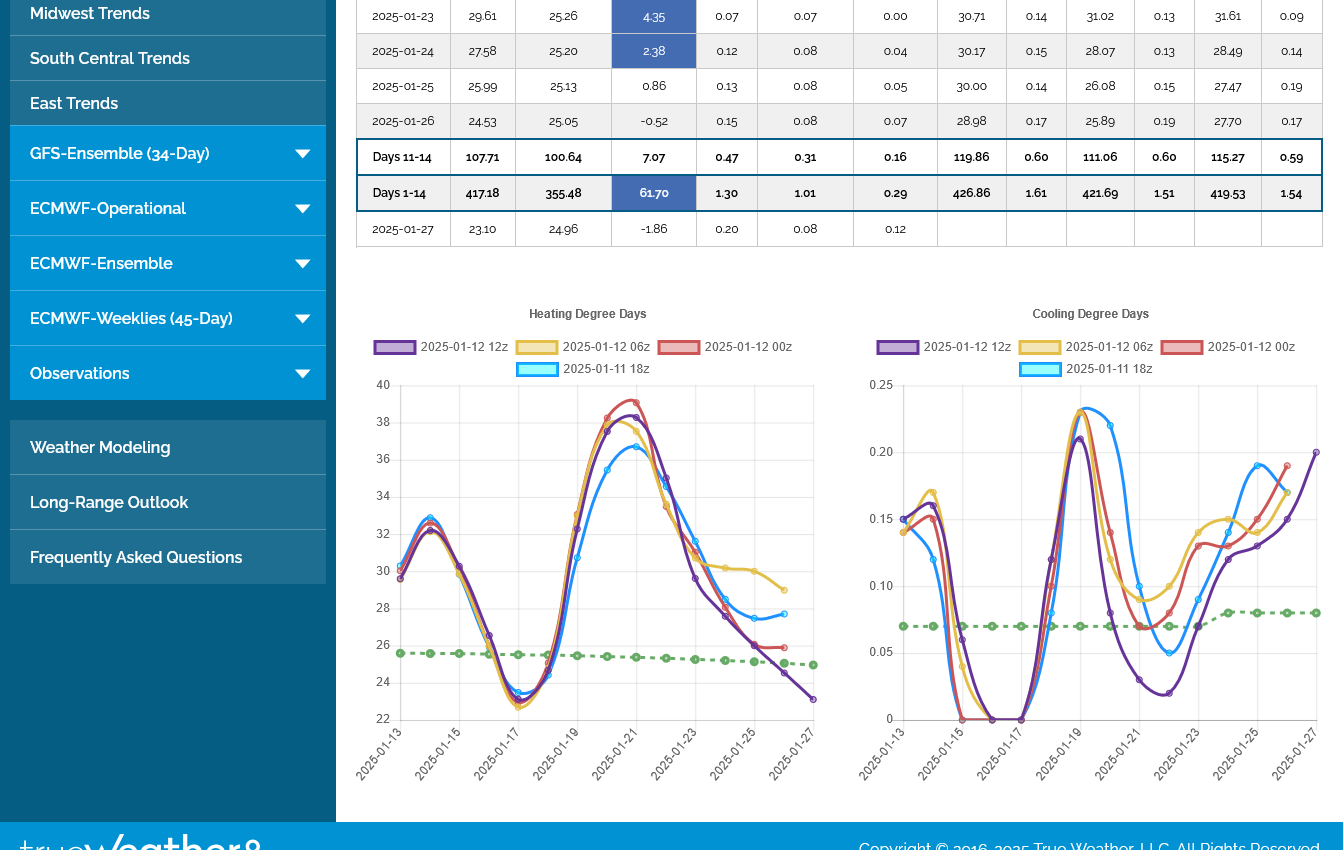
Look at the plunge lower in HDDs on the last 12z GEFS. -9 HDDs vs the previous 06 run.
I have never seem the models in such disagreement at the end of the 2 week period!!
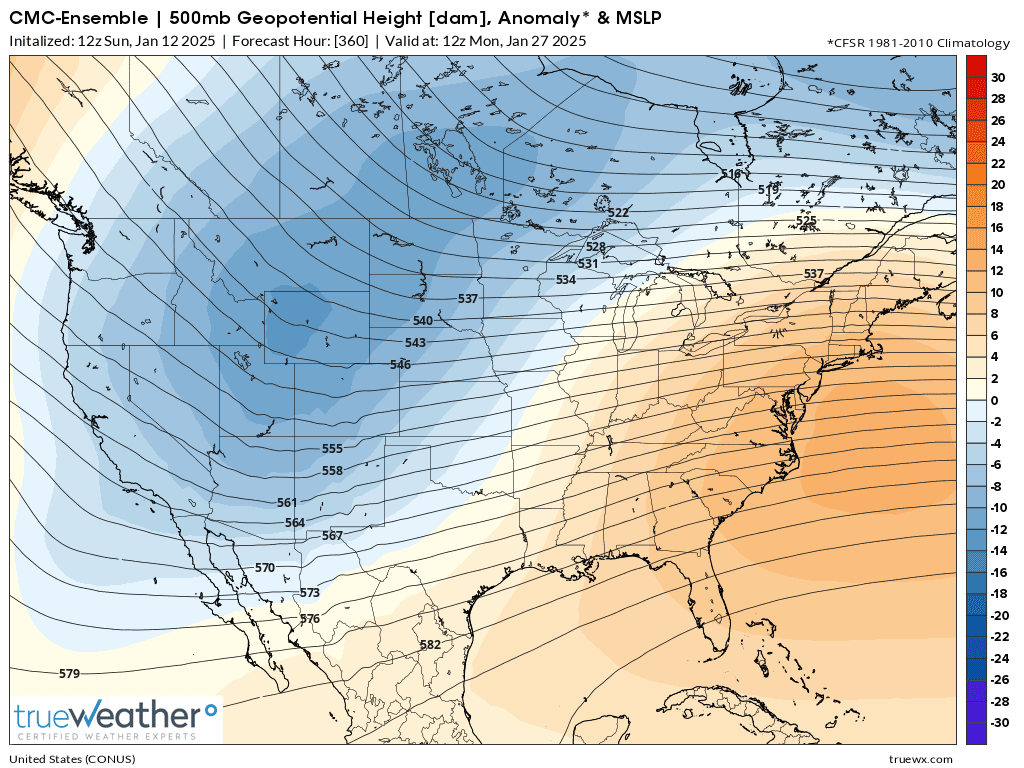
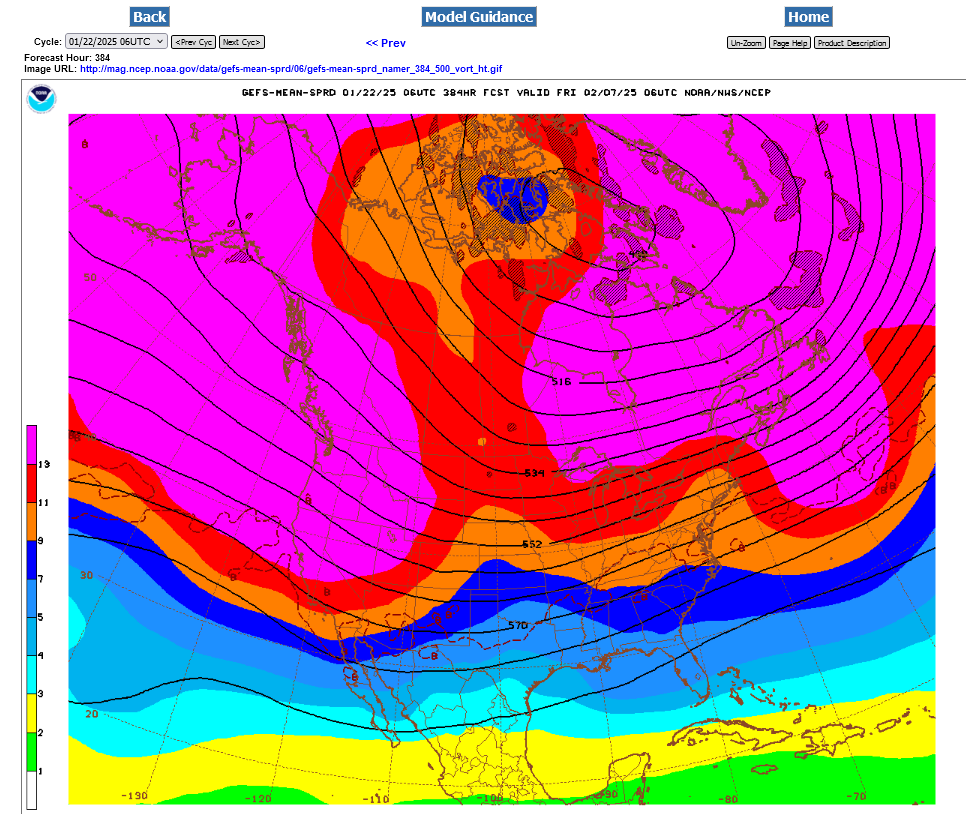
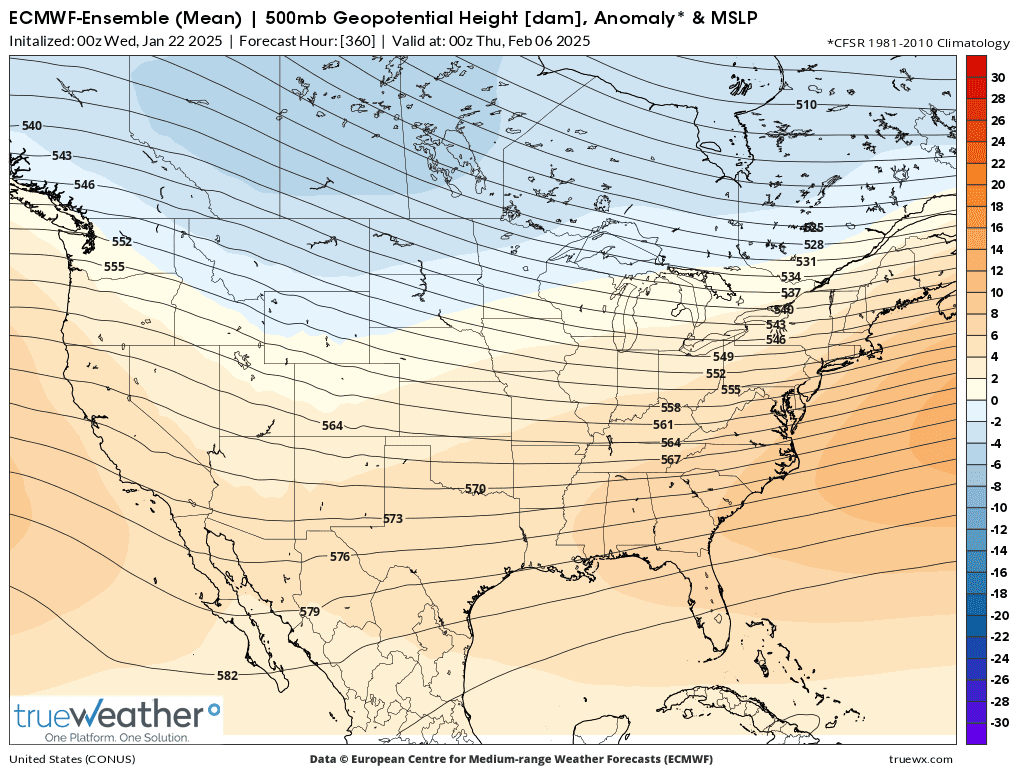
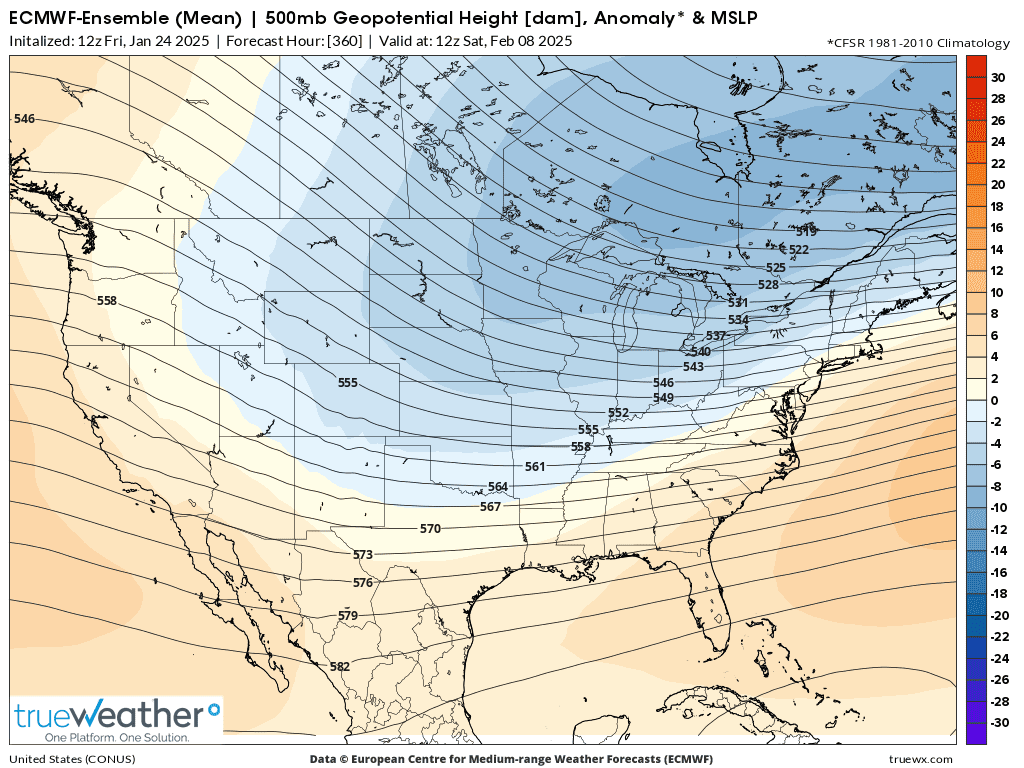
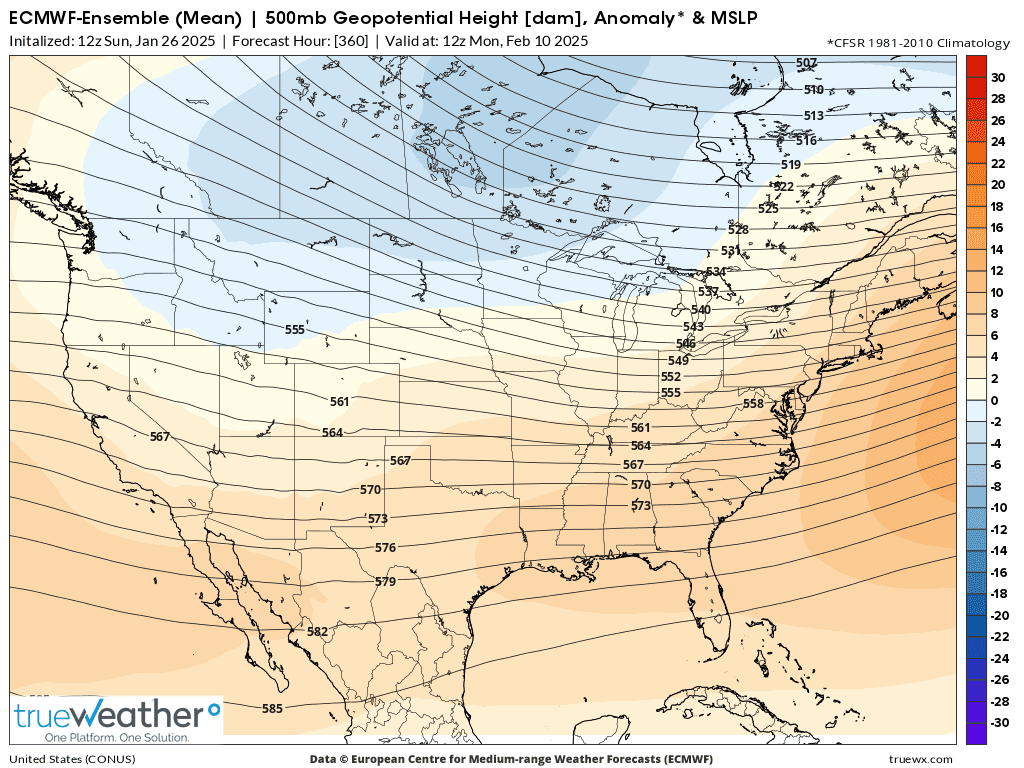
Here's a comparison of the 3 main models at the end of the period, 360 hours which is 15 days.
1. European ensemble. Deep trough/negative anomalies in Southeast Canada, extended to northern US. Ridging/positive anomalies off the West Coast. Modest positive anomalies southeast to south.
2. Canadian ensemble. Deep negative anomalies West to Plains to Upper Midwest. Strong positive anomalies/ridge building Eastern 1/3rd of US! This is brand new!
3. GEFS ensemble. Modest negative anomalies in the West to Rockies. STRONG positive anomalies ridging eastern 1/2. Almost the opposite of the European model in the placement of the biggest anomaly centers.
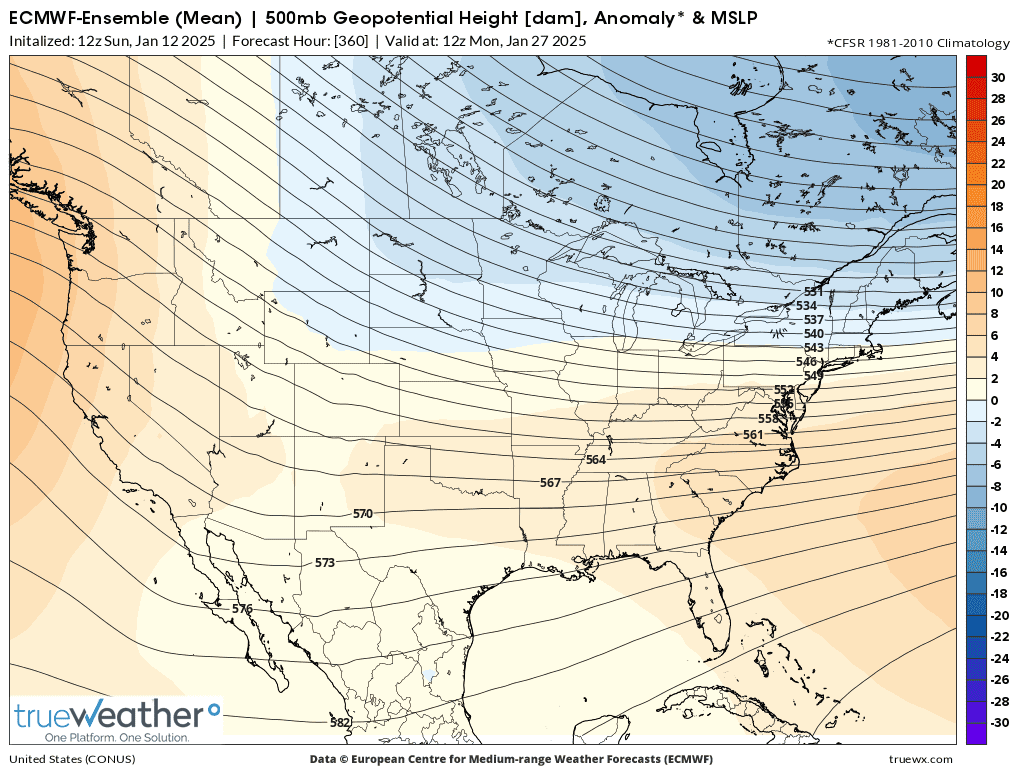
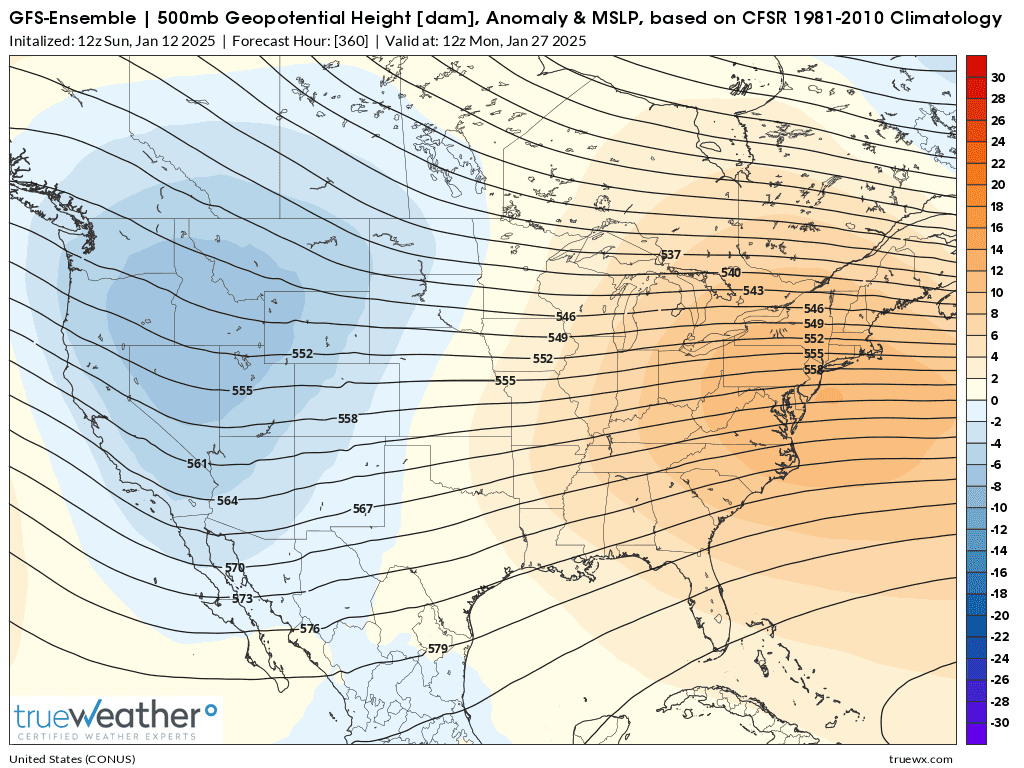
All the models do agree on NEW ridging, positive anomalies in the Southeast. Question is how strong will this new upper level ridging be and how far north and west will it extend?
Where will the the negative anomalies be to the north and west of the NEW ridging???
Looks like a potentially much wetter pattern for at least the eastern 1/3rd of the country, possibly working back into the Midwest? Some in the form of snow.
Potentially much warmer in the Southeast and surrounding areas. Lots of uncertainty.
++++++++++++++++++
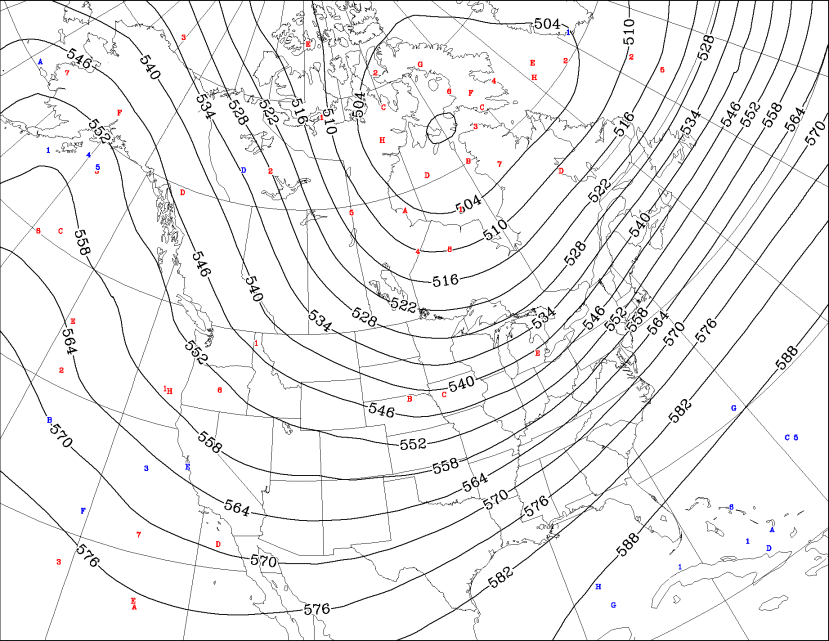
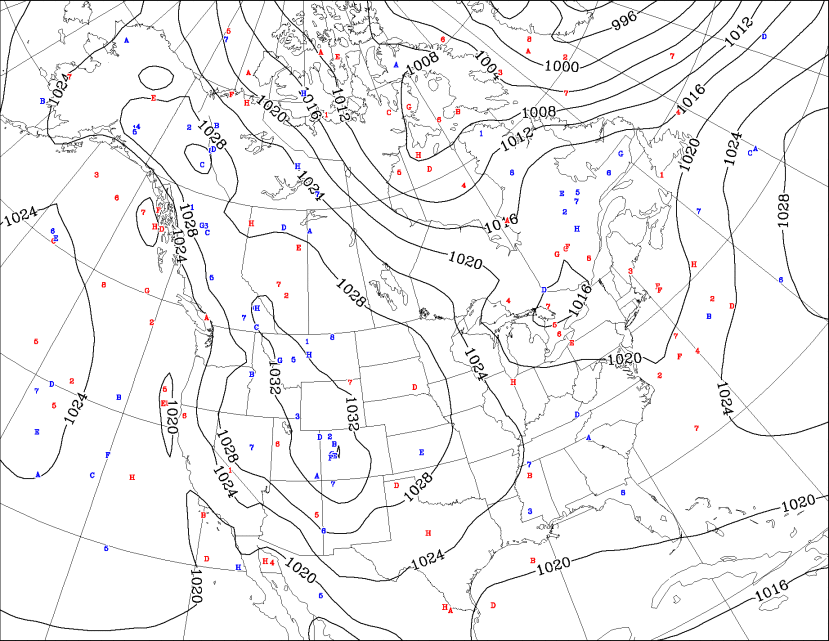
Before jumping on the huge warm up bandwagon of the GEFS, the last 12z Canadian model below still has impressive cross polar flow gushing out of Siberia, thru Canada and defining ARCTIC cold fronts crossing into the US:
https://weather.gc.ca/ensemble/charts_e.html?Hour=384&Day=0&RunTime=12&Type=gz
https://weather.gc.ca/ensemble/charts_e.html?Hour=384&Day=0&RunTime=12&Type=gz
How much higher will NG open up with a huge gap likely?
+3,500/contract. Will this be a gap and crap?
This is definitely a selling set up for me, especially........if the GEFS is correct!
The HO opened slightly higher then took off like a rocket, up over 5c, with RB only +2.5c.
Huge upside break away gap higher above previous highs on the chart.
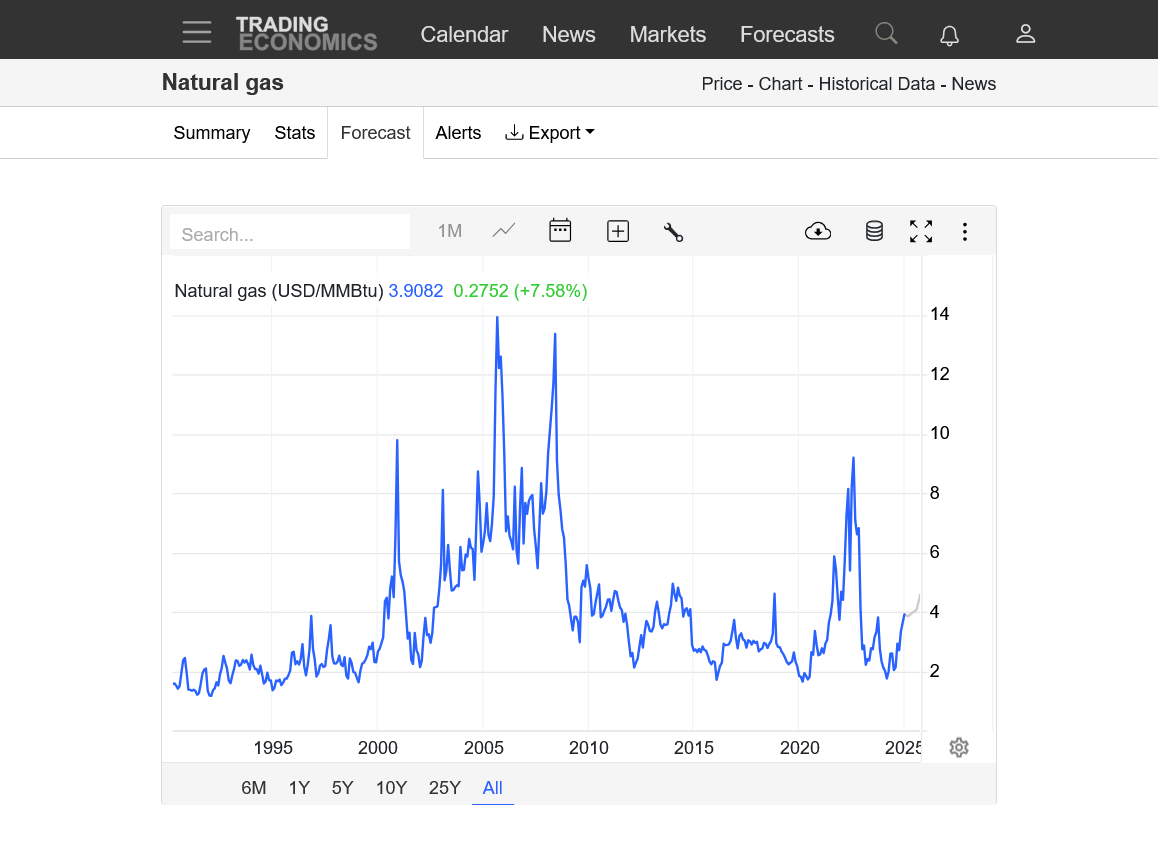
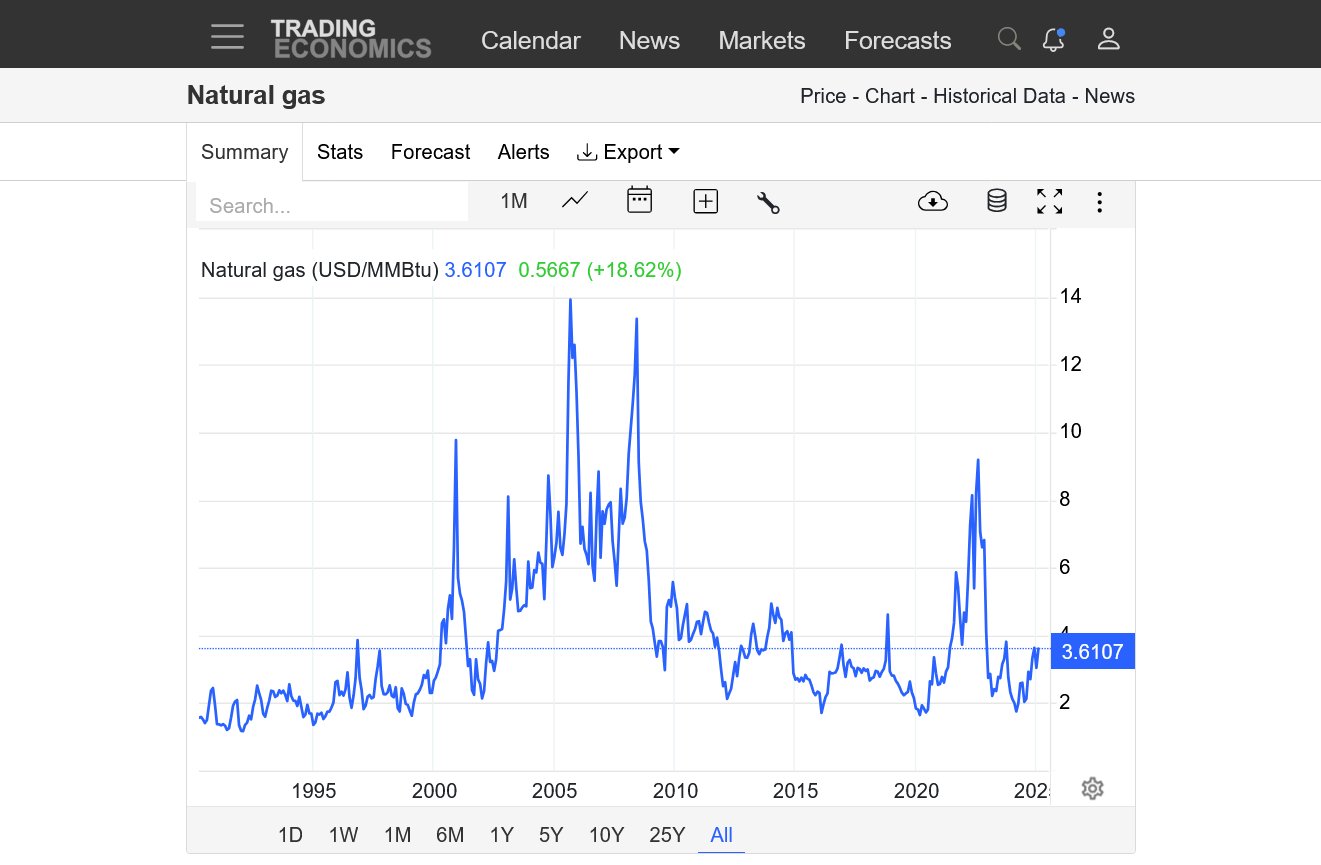
https://tradingeconomics.com/commodity/natural-gas
1. 35 years
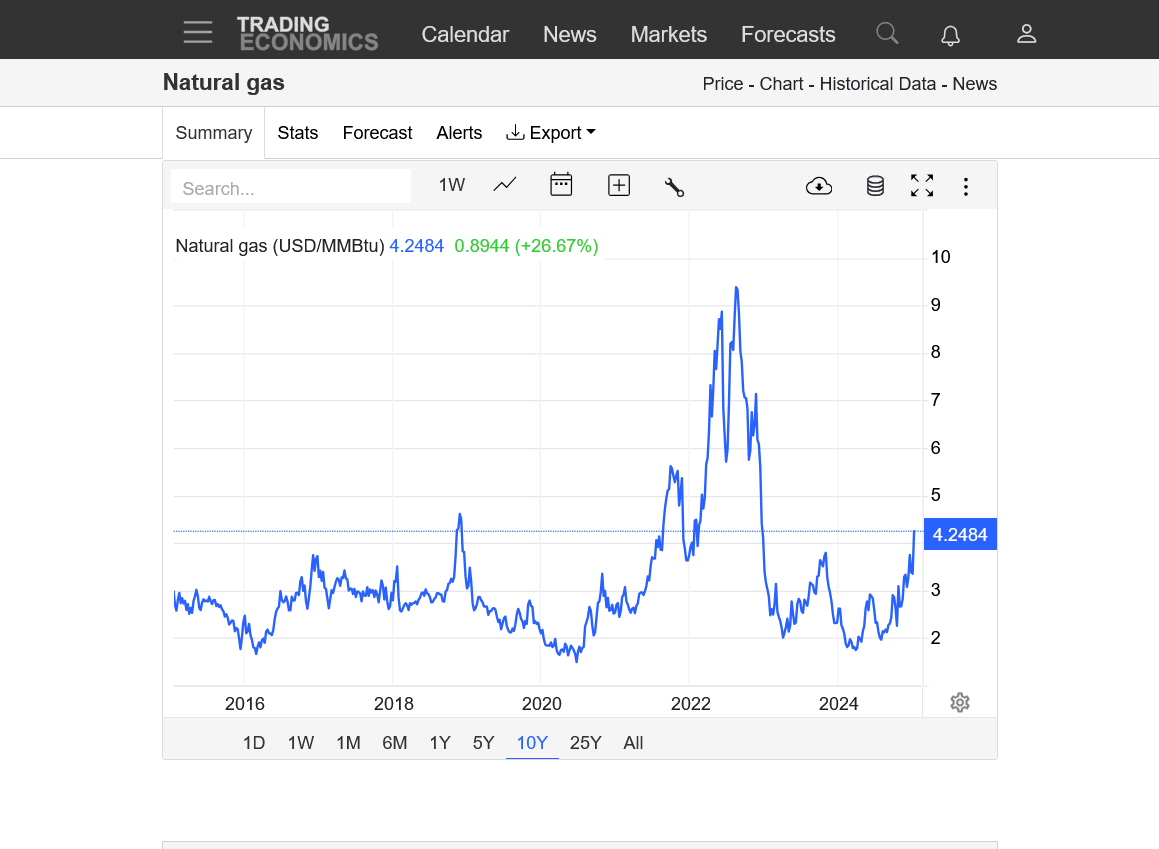
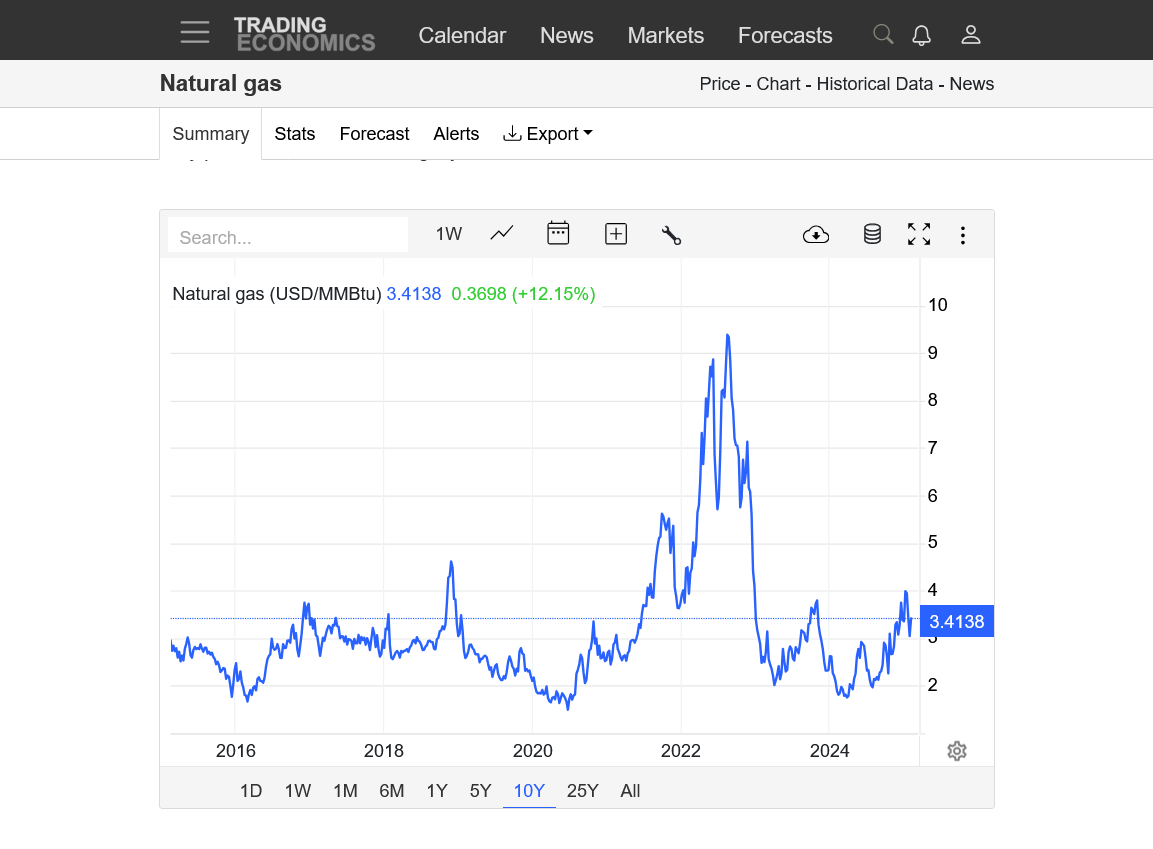
2. 10 years
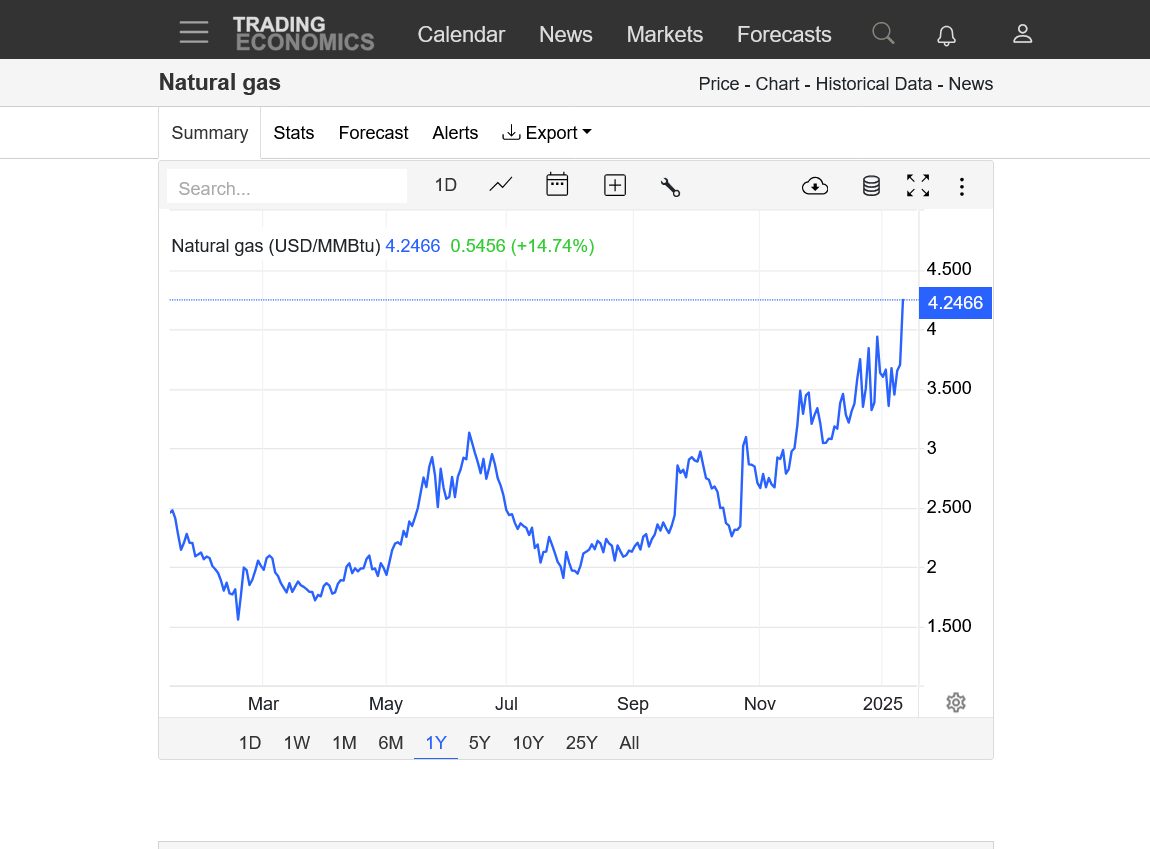
3. 1 year
4. 1 month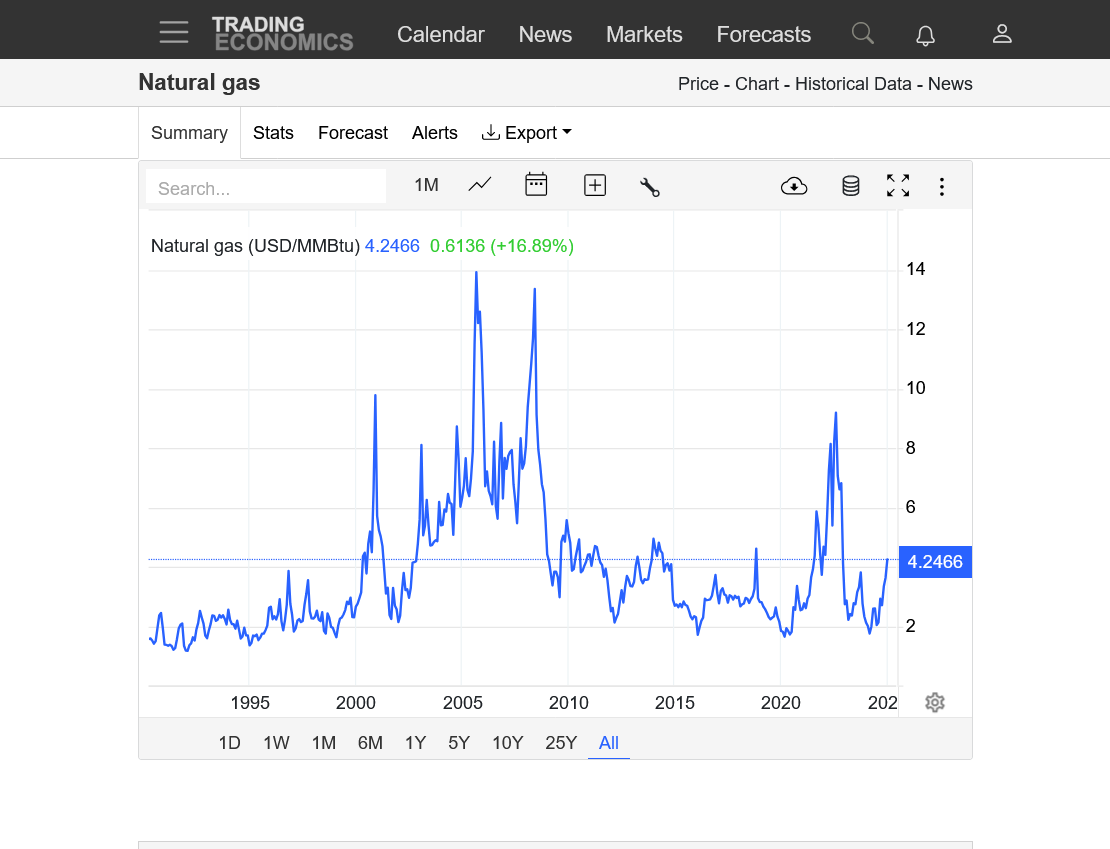
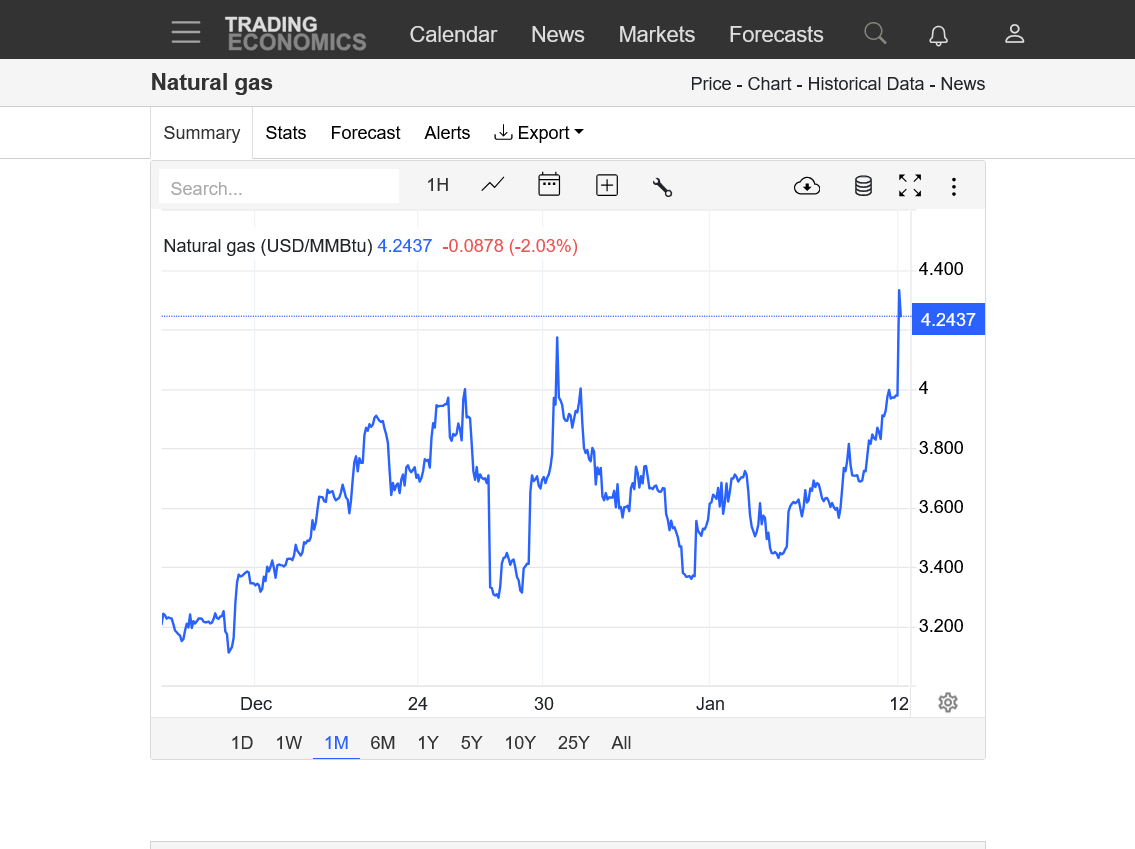
7 day temps for this Thursdays EIA. Major cold in the Eastern 2/3rds, Mild out West. Huge drawdown coming up!
https://www.cpc.ncep.noaa.gov/products/tanal/temp_analyses.php
By metmike - Jan. 12, 2025, 6:01 p.m.
+3,500/contract. Will this be a gap and crap?
This is definitely a selling set up for me, especially........if the GEFS is correct!
+++++++++++++++
That's exactly what it turned out to be! We completely filled the massive gap and have even been lower for the day, now about unchanged and right around $4 but with extreme volatility that makes it almost impossible to trade.
This cold may have staying power into early February?
But it will shift farther west with an upper level ridge building in the East.
EIA report:
-258 Bcf. That's a huge drawdown but my have been expected:
![]()
for week ending January 10, 2025 | Released: January 16, 2025 at 10:30 a.m. | Next Release: January 23, 2025
| Working gas in underground storage, Lower 48 states Summary text CSV JSN | |||||||||||||||||||||||||
|---|---|---|---|---|---|---|---|---|---|---|---|---|---|---|---|---|---|---|---|---|---|---|---|---|---|
| Historical Comparisons | |||||||||||||||||||||||||
| Stocks billion cubic feet (Bcf) | Year ago (01/10/24) | 5-year average (2020-24) | |||||||||||||||||||||||
| Region | 01/10/25 | 01/03/25 | net change | implied flow | Bcf | % change | Bcf | % change | |||||||||||||||||
| East | 669 | 737 | -68 | -68 | 727 | -8.0 | 708 | -5.5 | |||||||||||||||||
| Midwest | 808 | 881 | -73 | -73 | 888 | -9.0 | 842 | -4.0 | |||||||||||||||||
| Mountain | 240 | 255 | -15 | -15 | 211 | 13.7 | 172 | 39.5 | |||||||||||||||||
| Pacific | 283 | 293 | -10 | -10 | 262 | 8.0 | 227 | 24.7 | |||||||||||||||||
| South Central | 1,114 | 1,207 | -93 | -93 | 1,137 | -2.0 | 1,089 | 2.3 | |||||||||||||||||
| Salt | 326 | 364 | -38 | -38 | 332 | -1.8 | 319 | 2.2 | |||||||||||||||||
| Nonsalt | 788 | 844 | -56 | -56 | 805 | -2.1 | 770 | 2.3 | |||||||||||||||||
| Total | 3,115 | 3,373 | -258 | -258 | 3,226 | -3.4 | 3,038 | 2.5 | |||||||||||||||||
| Totals may not equal sum of components because of independent rounding. | |||||||||||||||||||||||||
Working gas in storage was 3,115 Bcf as of Friday, January 10, 2025, according to EIA estimates. This represents a net decrease of 258 Bcf from the previous week. Stocks were 111 Bcf less than last year at this time and 77 Bcf above the five-year average of 3,038 Bcf. At 3,115 Bcf, total working gas is within the five-year historical range.
For information on sampling error in this report, see Estimated Measures of Sampling Variability table below.

Note: The shaded area indicates the range between the historical minimum and maximum values for the weekly series from 2020 through 2024. The dashed vertical lines indicate current and year-ago weekly periods.
+++++++++
1pm: European model was a whopping +10 HDDs and NG took off like a rocket.
California politians massaged the budgets for many years to fullfil their stupid 'green', tree hugging, animal/fish loving agendas only to expose their constituents to horrible loss. Absolutely no vegetation control or forward thinking, like say Finland.
It would not be proper, but not a dime for them UNTIL Hawaii AND North Carolina are restored!
AND there should be restrictions on the money, say $2000 for every illegal who California assists ICE in permanently removing from USA
belongs in California fires
EIA expectation range was -227 to -275. So, tye -259 was pretty neutral. Folks didn’t want to sell on the -259 bcf because of the extreme Siberian cold on the way early next week.
tjc,
I copied your post in the thread discussing this topic. Thanks
Re: Re: Re: Re: Re: Re: California fires
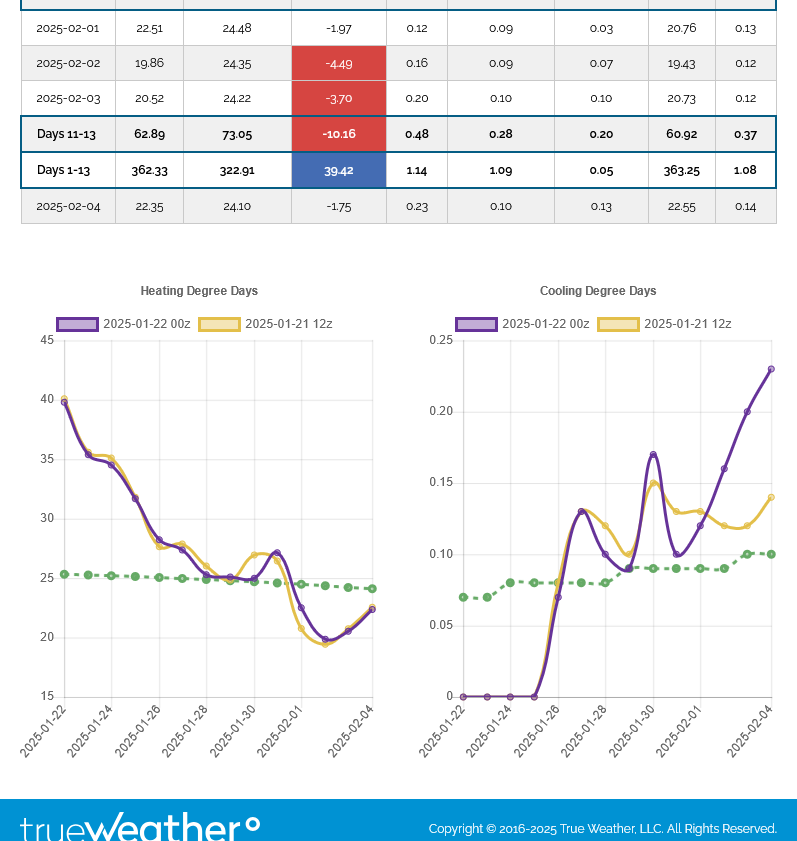
The overnight 0z EE was -7 HDDs bearish so ng came tumbling down:
Last 12z European Ensemble. Note the big drop in HDDs, even getting below average by a bit at the end of the period. Most indicators suggest a very mild week 3 but the last 12z EE has a COLDER solution with regards to the position of the main weather features, with an upper level trough trying to dig back into the Great Lakes.
Downside breakaway gap lower on the open??
That would be valid on the daily. It would need to be a big one to be below last weeks lows.
UPDATE: 5pm. The markets must be closed for MLK Day!
https://tradingeconomics.com/commodity/natural-gas
The EIA report on Thursday will be another big drawdown!
https://www.cpc.ncep.noaa.gov/products/tanal/temp_analyses.php
As expected, we gapped lower on the open but are still just above last weeks LOWS at the moment. More than $5,000/contract lower than last weeks spike high which likely is THE HIGH for this move, considering the much milder forecast(near average temps).
HDDs for the last 4 runs of the GEFS, purple is the latest 18z run. Temps back to a a bit ABOVE average with HDDs just below the average green line with has peaked now. Average temps for the rest of the cold season will be increasing (HDDs going lower based on the historical average).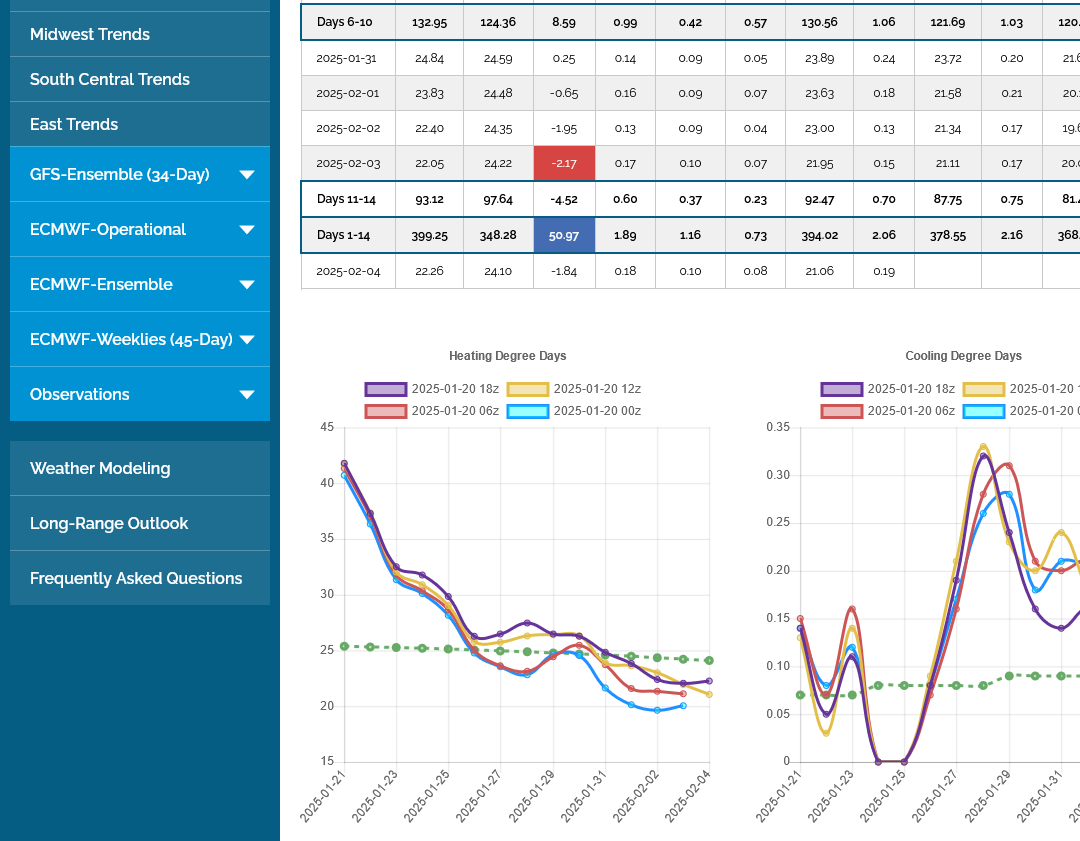
0z models came out colder. The gap lower is almost filled.
The gap lower to open this week was just barely closed shortly after midnight from a colder model run but this was met with selling pressure after the colder days were dialed in.
Models are very much in disagreement on what happens late in week 2. Some allow mild zonal flow to overspread the entire country. Some have troughing being reestablished in the Midwest/East and with cross polar flow, a renewal of cold invasions.
What do I think?
Alot of the indicators show us warming up(+AO, +NAO, PNA dropping to 0) but it also looks like the atmosphere could just be in a reloading phase, getting ready to revert back to the cold pattern over the recent past.
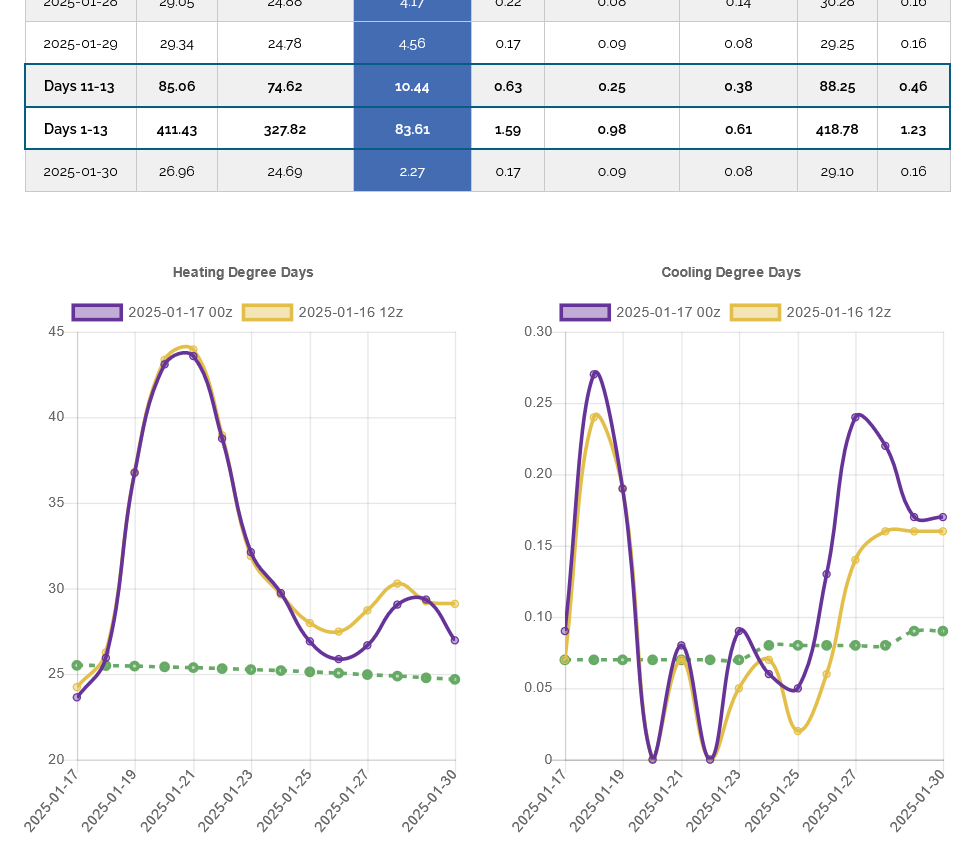
HDDs on the left, down to around average still on this last 0z European Ensemble model, which was close to the previous 12z run. I'm leaning colder and think the models are UNDER appreciating the tenacious cross polar flow thats been transporting air from Siberia, thru Canada and dumping it into the US.
Look at all the streamlines in Northwest Canada!!! Air masses tracking parallel to them are coming from Siberia into northwest Canada, then farther south, where they can characterize the air masses entering the US behind some of the cold fronts. However, there is not much support for this air to penetrate very far south in the pattern depicted below to start week 3! So Canada could be brutally cold but the air masses tracking into the US could moderate a great deal. More uncertainty than usual at the extended time frame!
6z GEFS below.
0z EE below with anomalies.
-8 HDDS bearish on the EE overnight which put a bit of pressure on NG for a short while but couldn't keep it from going higher, with new highs for the week right now, after the selling exhaustion, gap and crap to start the week. Gap lower that was filled and now we're higher.
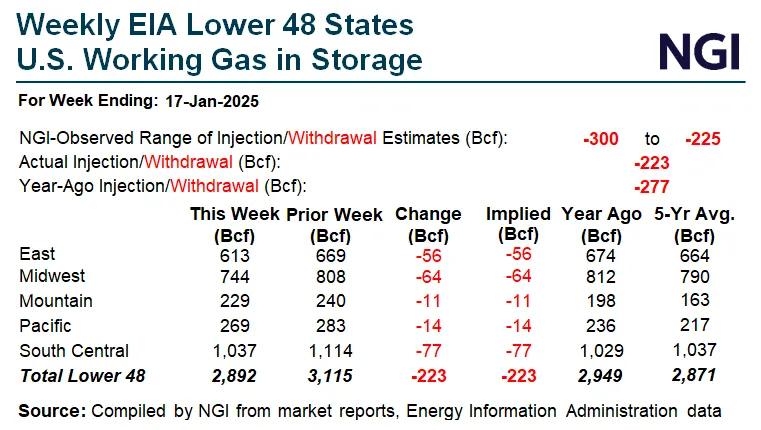
Bearish number? -223 Bcf.
If you base it on the immediate spike down.
The big deal recently is that the massive surplus has been completely wiped out with the sustained cold this Winter! The blue line on the graph below, that has often been completely ABOVE the 5 year range and at record highs for over a year(from last years mild Winter) is now almost down to the average. WOW!
Below: This represents a net decrease of 223 Bcf from the previous week. Stocks were 57 Bcf less than last year at this time and 21 Bcf above the five-year average of 2,871 Bcf.
![]()
for week ending January 17, 2025 | Released: January 23, 2025 at 10:30 a.m. | Next Release: January 30, 2025
| Working gas in underground storage, Lower 48 states Summary text CSV JSN | |||||||||||||||||||||||||
|---|---|---|---|---|---|---|---|---|---|---|---|---|---|---|---|---|---|---|---|---|---|---|---|---|---|
| Historical Comparisons | |||||||||||||||||||||||||
| Stocks billion cubic feet (Bcf) | Year ago (01/17/24) | 5-year average (2020-24) | |||||||||||||||||||||||
| Region | 01/17/25 | 01/10/25 | net change | implied flow | Bcf | % change | Bcf | % change | |||||||||||||||||
| East | 613 | 669 | -56 | -56 | 674 | -9.1 | 664 | -7.7 | |||||||||||||||||
| Midwest | 744 | 808 | -64 | -64 | 812 | -8.4 | 790 | -5.8 | |||||||||||||||||
| Mountain | 229 | 240 | -11 | -11 | 198 | 15.7 | 163 | 40.5 | |||||||||||||||||
| Pacific | 269 | 283 | -14 | -14 | 236 | 14.0 | 217 | 24.0 | |||||||||||||||||
| South Central | 1,037 | 1,114 | -77 | -77 | 1,029 | 0.8 | 1,037 | 0.0 | |||||||||||||||||
| Salt | 297 | 326 | -29 | -29 | 287 | 3.5 | 303 | -2.0 | |||||||||||||||||
| Nonsalt | 739 | 788 | -49 | -49 | 742 | -0.4 | 735 | 0.5 | |||||||||||||||||
| Total | 2,892 | 3,115 | -223 | -223 | 2,949 | -1.9 | 2,871 | 0.7 | |||||||||||||||||
| Totals may not equal sum of components because of independent rounding. | |||||||||||||||||||||||||
Working gas in storage was 2,892 Bcf as of Friday, January 17, 2025, according to EIA estimates. This represents a net decrease of 223 Bcf from the previous week. Stocks were 57 Bcf less than last year at this time and 21 Bcf above the five-year average of 2,871 Bcf. At 2,892 Bcf, total working gas is within the five-year historical range.
For information on sampling error in this report, see Estimated Measures of Sampling Variability table below.
Note: The shaded area indicates the range between the historical minimum and maximum values for the weekly series from 2020 through 2024. The dashed vertical lines indicate current and year-ago weekly periods.
+++++++++++
The number was right at the bottom of guesses.
https://www.naturalgasintel.com/
The low skill week 3 & 4 forecast looks exactly like the La Nina analog!
I am COLDER than this because of the persistent cross polar flow dumping bitter cold into most of Canada and some of that will cross into the US. More than the map below.
I have pretty high confidence that next weeks extended forecasts will be COLDER than this weeks.
https://www.cpc.ncep.noaa.gov/products/predictions/WK34/
HUGE disagreement by models in how much cold returns late in week 2. The European model is the coldest.
Their WILL be cross polar flow with the Siberian express continuing to dump frigid air from Siberia into much of Canada. How much continues south into the US is where most of the disagreement is.
The ng markets sharp turn around on Friday, to make new highs for the week suggested it agreed with my higher confidence COLDER outlook. The NWS yesterday, updated their 8-14 day to add a ton of cold, seen below.
Right now, I'm actually much LESS convinced of my COLDER than the guidance view late last week and could quickly change to much milder here. Model runs early this week will determine that for me.
0z European Ensemble model below. HDDs on the left. Increasingly mild, then quickly turning much colder again but the purple, last run in purple is not AS cold at the end of the period as the prior 12z run.
The stellar performing, European Ensemble has gone from, by far the coldest the last few days, to suddenly one of the warmest. MUCH more upper level ridging in the Southeast/South vs 2 days ago. Less troughing in the North.
1a. Friday's 12z run for 500 mb
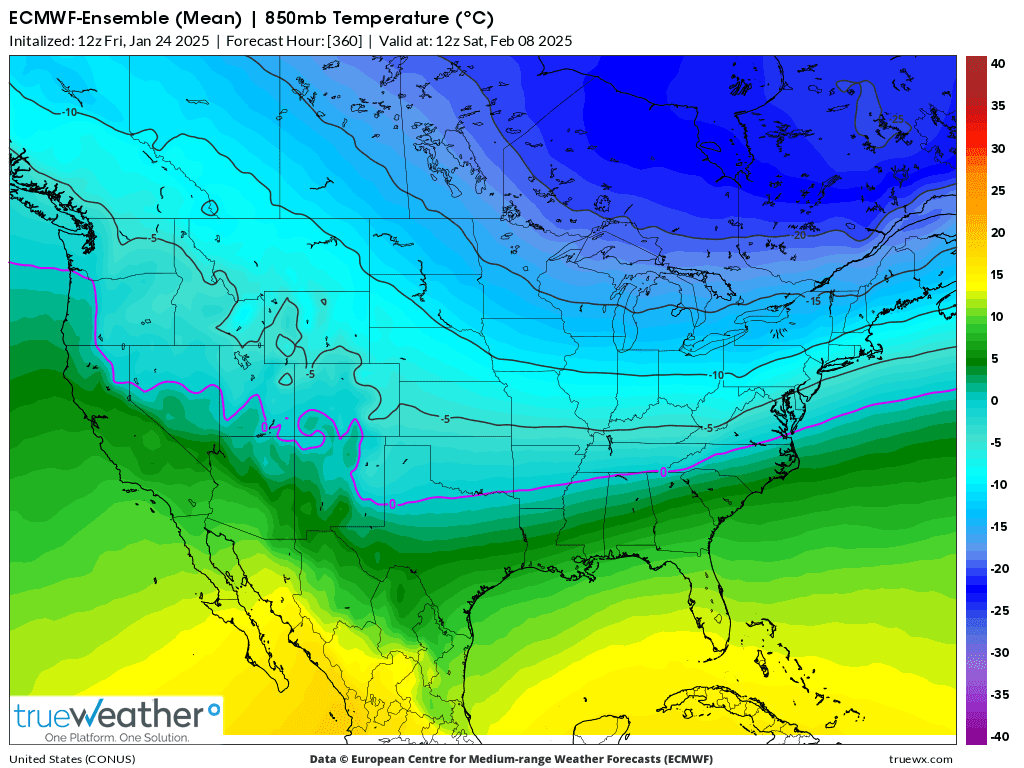
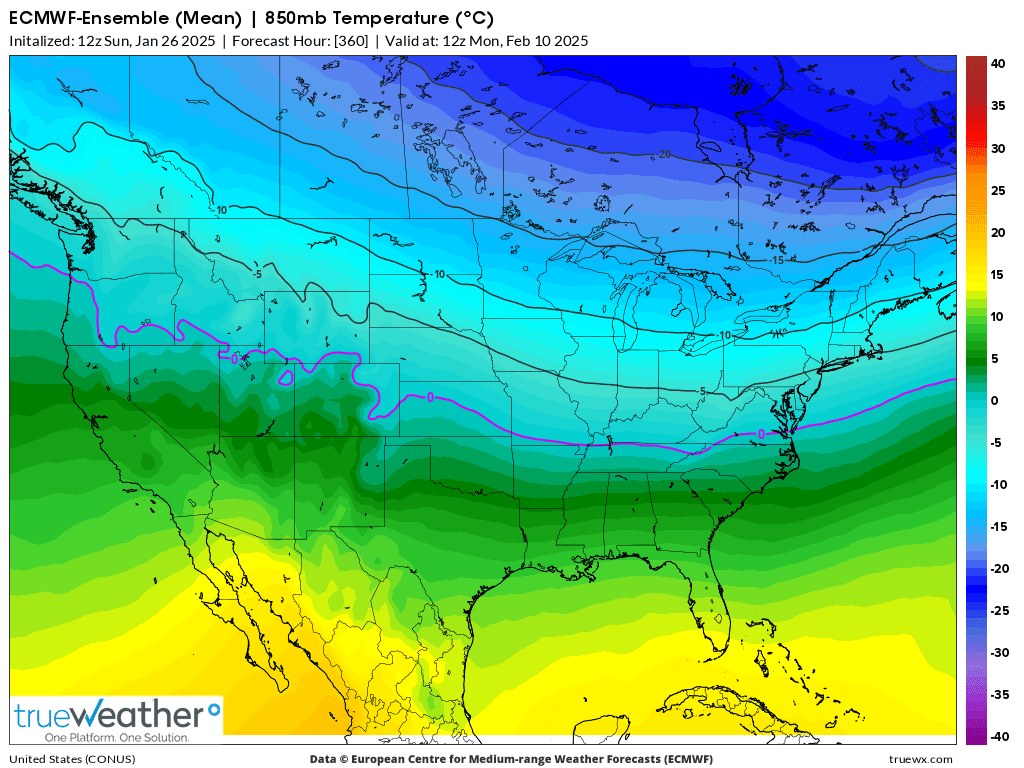
b. 850 temps
2. Sunday's 12z run for 500 mb.
b. 850 temps.
++++++++++++++++++++++
Latest 12z run below:
NG opened sharply lower, in line with the milder outlook described above, earlier today.
The front month, February is expiring, which always injects more volatility during the last few days of the front months trading.
looks like a small gap lower on the daily bar that barely got filled that gets extremely low weighting for gaps and gap and crap selling exhaustions.
If I was forced to make an interpretation for trading, it would be that the milder changes on weather maps today are causing heavy pressure on the market that will likely continue if the overnight models continue milder.
if, if, if.
looks like the last trading day for NGG is Wednesday. Volume for march-6500 is already almost 3 times the feb-2500 with less than 1 hour of trading for this new trading session On Sunday evening
1. Milder outlook with an upper level ridge continued overnight, so NG continued down as expected. This was the last 0z European model HDDS in purple. Previous solution 12 hours earlier in tan. Much milder at the end, which is why this solution was -6 HDDS vs the previous one.
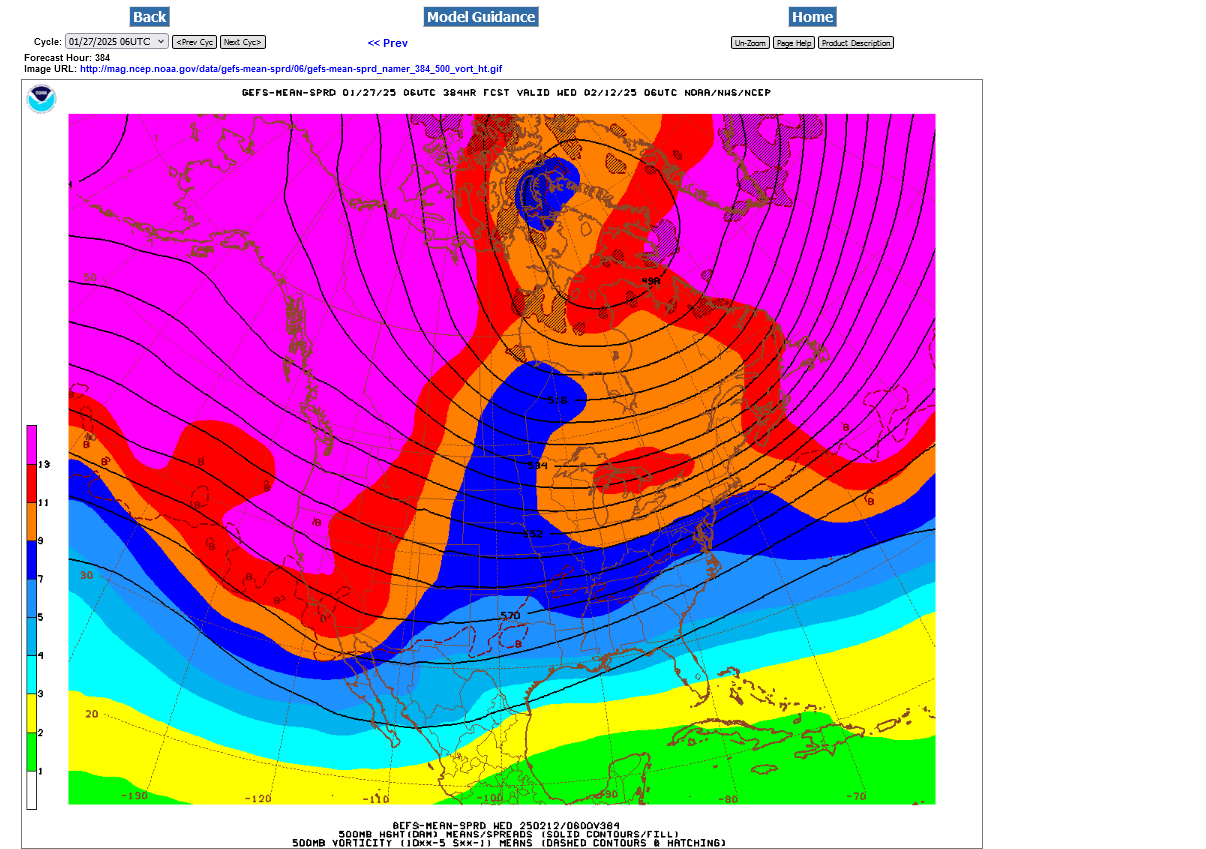
2. GEFS 6z map at 500 mb. Look at the tenacious cross polar flow in Northwest Canada(numerous streamlines, which define upper level air flow-which is parallel to them). This will continue to dump in air from Siberia into Canada so that cold fronts coming from Canada into the US will be loaded with frigid air coming from the highest latitudes.
Should be another robust drawdown on Thursday with widespread cold across the entire country last week.
This should take us BELOW the 5 year average for the first time in a long while.
https://www.cpc.ncep.noaa.gov/products/tanal/temp_analyses.php
Hey Mike,
I assume shutins will be large and thus reduce supply and add to the net draw to be reported. Could this possibly be a record high net draw?
It should be a whopper Larry!
I don’t ever remember the entire country, as in almost every county of every state being below average like this.
Incredible spread for the AO today!! From +3 to -3.
Pretty big for the PNA too.
https://www.marketforum.com/forum/topic/83844/#83856
The tenacious cross polar flow continues!
Western Canada WILL be frigid. Any cold fronts/air masses entering the US from that location will have a source region from Siberia because of the cross polar flow.
However, the building positive anomaly in the East will provide increasing resistance/moderation to cold air as it crosses the country.
Great call on the EIA number, Larry.
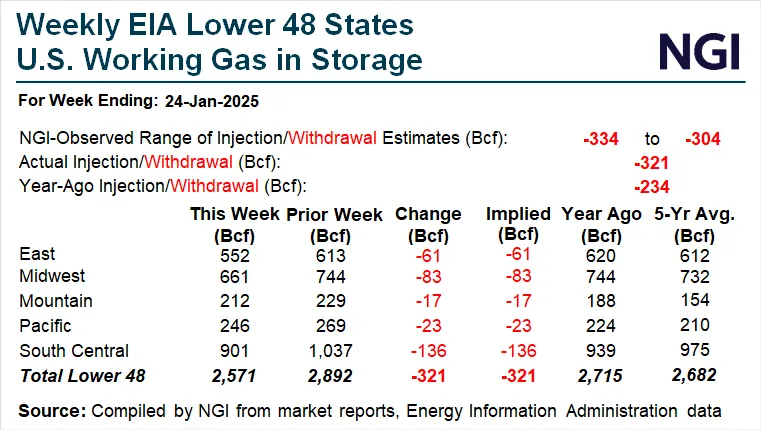
-321 Bcf! Is that a record number? We are now BELOW the 5 year average in storage for the first time in almost 2 years(by 111 Bcf). Look at the blue line on graph below! WOW!
We are in the back half of Winter with no chance to run out, which usually means strong negative seasonals for the next ~2 months but the weather is looking to potentially turn much colder again at the end of 2 weeks(after being very mild before then)
![]()
for week ending January 24, 2025 | Released: January 30, 2025 at 10:30 a.m. | Next Release: February 6, 2025
| Working gas in underground storage, Lower 48 states Summary text CSV JSN | |||||||||||||||||||||||||
|---|---|---|---|---|---|---|---|---|---|---|---|---|---|---|---|---|---|---|---|---|---|---|---|---|---|
| Historical Comparisons | |||||||||||||||||||||||||
| Stocks billion cubic feet (Bcf) | Year ago (01/24/24) | 5-year average (2020-24) | |||||||||||||||||||||||
| Region | 01/24/25 | 01/17/25 | net change | implied flow | Bcf | % change | Bcf | % change | |||||||||||||||||
| East | 552 | 613 | -61 | -61 | 620 | -11.0 | 612 | -9.8 | |||||||||||||||||
| Midwest | 661 | 744 | -83 | -83 | 744 | -11.2 | 732 | -9.7 | |||||||||||||||||
| Mountain | 212 | 229 | -17 | -17 | 188 | 12.8 | 154 | 37.7 | |||||||||||||||||
| Pacific | 246 | 269 | -23 | -23 | 224 | 9.8 | 210 | 17.1 | |||||||||||||||||
| South Central | 901 | 1,037 | -136 | -136 | 939 | -4.0 | 975 | -7.6 | |||||||||||||||||
| Salt | 229 | 297 | -68 | -68 | 254 | -9.8 | 280 | -18.2 | |||||||||||||||||
| Nonsalt | 672 | 739 | -67 | -67 | 686 | -2.0 | 695 | -3.3 | |||||||||||||||||
| Total | 2,571 | 2,892 | -321 | -321 | 2,715 | -5.3 | 2,682 | -4.1 | |||||||||||||||||
| Totals may not equal sum of components because of independent rounding. | |||||||||||||||||||||||||
Working gas in storage was 2,571 Bcf as of Friday, January 24, 2025, according to EIA estimates. This represents a net decrease of 321 Bcf from the previous week. Stocks were 144 Bcf less than last year at this time and 111 Bcf below the five-year average of 2,682 Bcf. At 2,571 Bcf, total working gas is within the five-year historical range.
For information on sampling error in this report, see Estimated Measures of Sampling Variability table below.
Note: The shaded area indicates the range between the historical minimum and maximum values for the weekly series from 2020 through 2024. The dashed vertical lines indicate current and year-ago weekly periods.
Story of the Day
Storage Draw, Within Expectations, Keeping Natural Gas Futures on Downward Trajectory
The U.S. Energy Information Administration (EIA) Thursday reported a massive 321 Bcf withdrawal of natural gas from storage for the frigid week ending Jan. 24. The print was above median expectations and at the high end of a range of outlooks. Jodi Shafto
Thanks, Mike. I’d love to know what the Fri-Thu US pop weighted HDDs were. I no longer can find those.
Also, have you seen any estimates of shutins?
I don’t know if this is a record high draw. I vaguely recall there has been one other over 300 in the not too distant past. I used to be able to analyze the weekly EIAs pretty quickly, but I’ve lost that ability in recent years.
I just checked and this is the 3rd largest drawdown In history.
more when back in the office later today.
By Tsvetana Paraskova - Jan 11, 2018,
https://oilprice.com/Energy/Natural-Gas/Cold-Snap-Leads-To-Biggest-US-Natural-Gas-Draw-Ever.html
Mike posted:
By Tsvetana Paraskova - Jan 11, 2018,
——————————-
Hey Mike,
Not coincidentally, that early Jan cold snap like this one was accompanied by an historic Deep SE winter storm (actually the last one to occur).
many tens of millions of people live in the south that set the thermostats higher than other locations, farther north that are more tolerant of cold.
i would bet that population weighted HDDS in the South use more NG than in the North.
what do you think, Larry from Georgia?
Mike said:
“many tens of millions of people live in the south that set the thermostats higher than other locations, farther north that are more tolerant of cold.
i would bet that population weighted HDDS in the South use more NG than in the North.
what do you think, Larry from Georgia?”
————————
Hey Mike,
I agree due to a combo of setting thermostat higher and homes not as efficient at keeping in the heat (largely due to windows/doors).
https://www.greenbuildingadvisor.com/article/the-strange-geography-of-thermostat-settings
Great graphics, stats, Larry!
Turning sharply colder again in week 2 but with tremendous uncertainty.
I remain strongly on the colder/bullish side!
1.Last 4 runs of the GEFS, purple is the last 12z run and coldest.
2. The EE on the other hand was MILDER with its last run by -10 HDDs. ....but its 0z run was SUPER cold.
Regardless, week 2 is colder than Friday, so we probably open higher tonight.
The huge deal is the -AO crashing lower, which suggests cold air from high latitudes being flushed into the middle latitudes.
NAO becomes much less positive, approaching 0. Ridge in the East is weakening!!
PNA drops to near 0 which might provide some resistance to how far south the Arctic air can penetrate. +PNA helps with a ridge/west, trough east, cold configuration in the US.
What's going on with the energy markets/ICE???
They normally open at 5pm but didn't open. I had an order in and was thinking it would get get filled based on the bid/offer but we didn't open.
The next holiday is Presidents Day in 2 weeks. What gives?
https://www.ice.com/publicdocs/futures/IFUS_Trading_Hours_Holiday_Calendar.pdf
++++++++++
Addition: I had to reload the Firetip trading program on my computer. That was the issue.
We opened with a massive gap higher, as expected from the much colder forecast. My buy order would not have been filled anyway.
This is likely an upside break away gap, after testing $3 last week.
12z GEFS was +16 HDDS but the EE was -7 HDDs.
crazy amount of uncertainty
Models overnight less bullish with the position of the southward dislaced polar vortex.
This last 12z GEFS was a whopping +16 HDDs higher than the previous 6z run. This gave us a big spike higher in price that was still unable to get close to unch vs Mondays close, now giving back a big portion of the gains. NOT A GOOD BULLISH REACTION!
It's February and well over half of Winter is over. Seasonals are extremely bearish, except in years when storage is precariously low. Speculators that want to be long the first half of Winter on extreme cold have thinned out at this time of year.
We can still go higher from here for sure, however with few exceptions, the later in the heating season it is, the harder it is to generate and maintain buying on extreme cold. This NEGATIVE impact usually starts in late January and lasts into mid March, depending on the individual years dynamics.
If the polar vortex comes all the way into the United States, it will be plenty enough to offset this seasonal/historical pattern/analog and with storage whittled down to below the 5 year average, that would be plenty for more upside. Each year is different. If forecasts between now and the end of the week are less cold, the chance of the price dropping is high.
Purple on the left was the last 12z run. Blue was from 3 runs ago, and the last in a bunch of cold runs that started over the weekend. Red and orange were the 2 much LESS cold runs overnight(causing the price to drop almost $2,000/contract from Mondays close. They are all spaced 6 hours apart.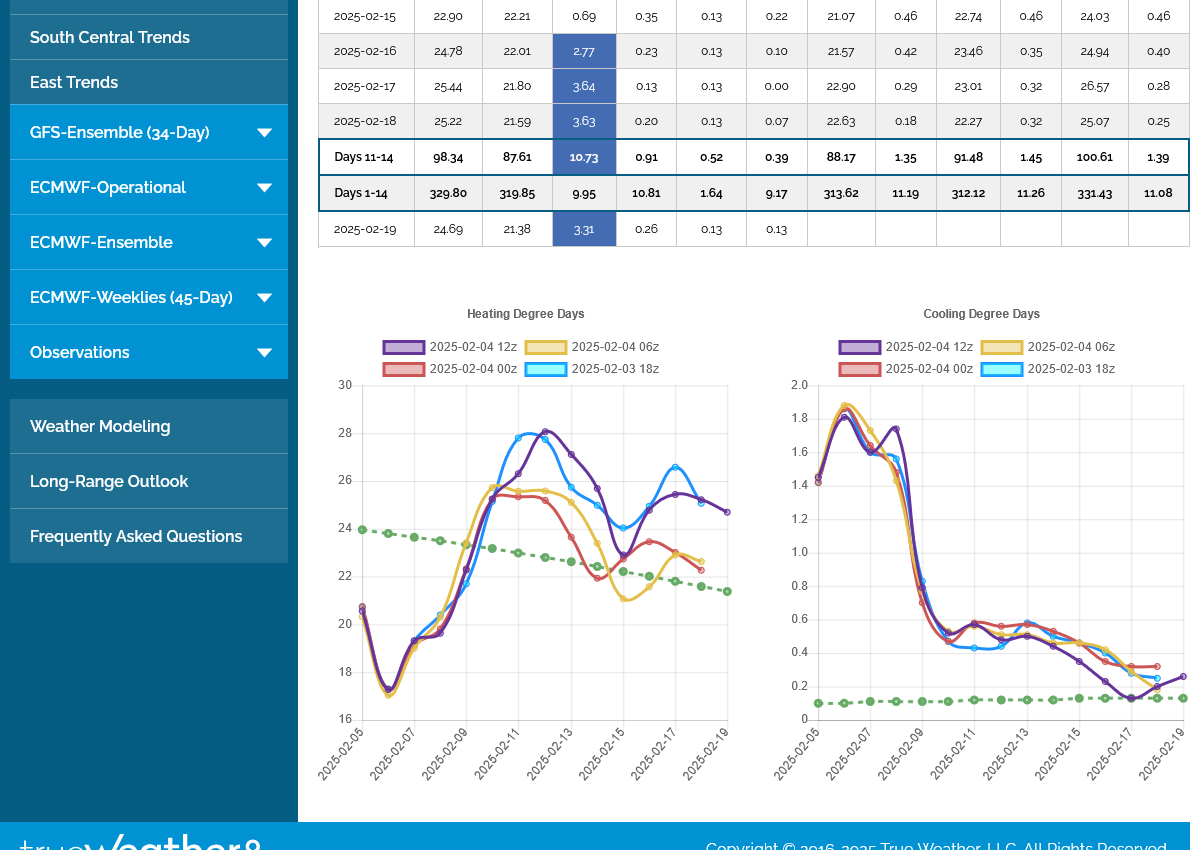
The HDDs for the European Ensemble model are not out yet on TrueWeather but I can tell by looking at the WeatherBell maps, which come out way earlier than the 12z EE solution, that this solution will have LESS HDDs than the previous 0z run. The EE maps going out 2 weeks only come out every 12 hours.
The main reason is the much stronger upper level ridge in the South/Southeast in week 2 on this last 12z EE run. This is the reason for the market to give back some of the colder 12z GEFS inspired gains.
UPDATE: The last 12z EE was in fact -4 HDDs.
Another robust drawdown on tomorrows EIA at 9:30am. The small mild place vs average has few people living there. The coldest place vs average sets their thermostats up pretty high for comfort.
Will it take us BELOW the 5 year range?
+++++++++++
The last 12z run of the European Ensemble model was mind boggling colder than the previous run. I'll guess close to +20 HDDs!
-174 Bcf!
The last huge drawdown of this magnitude for the Winter of 2024/25. but still some big ones coming up again by lower February standards.
We are BELOW the blue line on the graph below by the greatest amount since (using memory) the early Fall of 2022.
![]()
for week ending January 31, 2025 | Released: February 6, 2025 at 10:30 a.m. | Next Release: February 13, 2025
Working gas in underground storage, Lower 48 states Summary text
CSV
JSN Historical ComparisonsStocks
billion cubic feet (Bcf) Year ago
(01/31/24)5-year average
(2020-24) Region01/31/2501/24/25net changeimplied flow
Bcf% change Bcf% changeEast507 552 -45 -45 579 -12.4 562 -9.8 Midwest605 661 -56 -56 700 -13.6 677 -10.6 Mountain200 212 -12 -12 184 8.7 146 37.0 Pacific230 246 -16 -16 227 1.3 203 13.3 South Central854 901 -47 -47 917 -6.9 920 -7.2 Salt217 229 -12 -12 254 -14.6 263 -17.5 Nonsalt638 672 -34 -34 663 -3.8 657 -2.9 Total2,397 2,571 -174 -174 2,605 -8.0 2,508 -4.4 Totals may not equal sum of components because of independent rounding.
Working gas in storage was 2,397 Bcf as of Friday, January 31, 2025, according to EIA estimates. This represents a net decrease of 174 Bcf from the previous week. Stocks were 208 Bcf less than last year at this time and 111 Bcf below the five-year average of 2,508 Bcf. At 2,397 Bcf, total working gas is within the five-year historical range.
For information on sampling error in this report, see Estimated Measures of Sampling Variability table below.
Note: The shaded area indicates the range between the historical minimum and maximum values for the weekly series from 2020 through 2024. The dashed vertical lines indicate current and year-ago weekly periods.
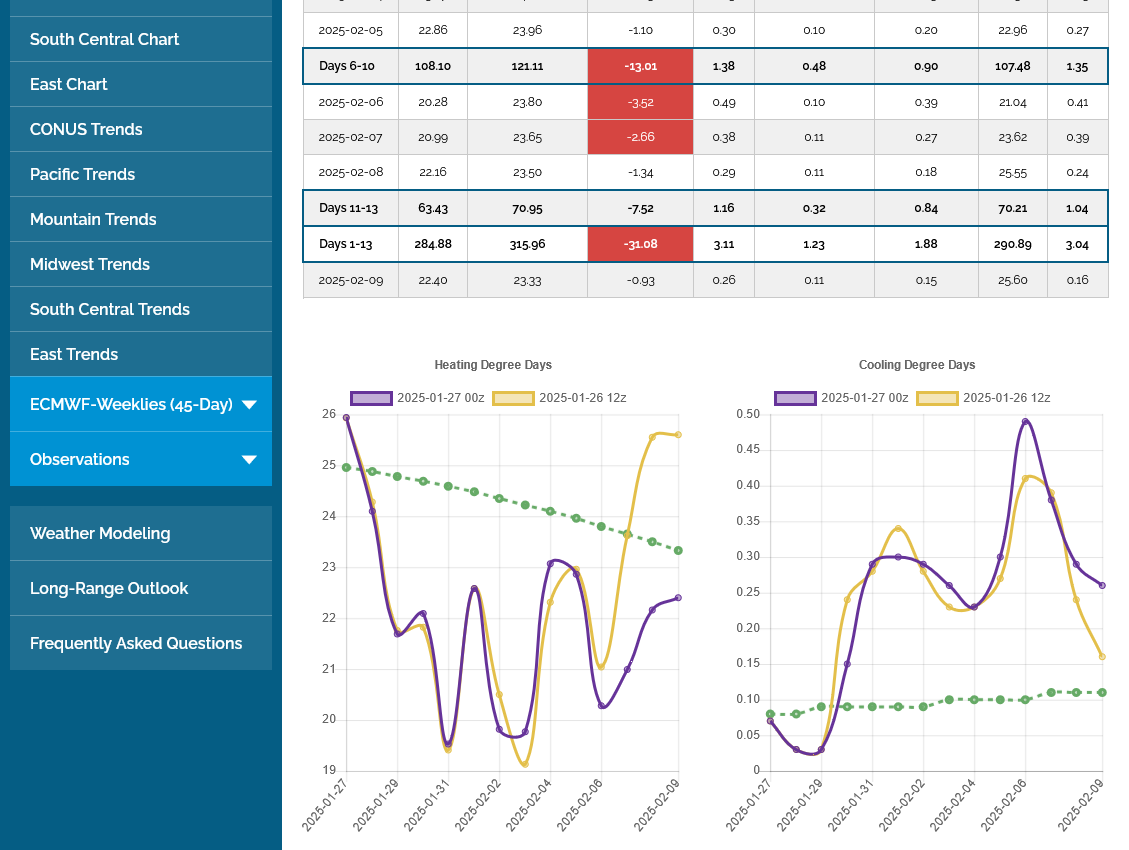
HIGHER open tonight for natural gas. The last 12z European model, on the left, in purple was a whopping +15.7 HDDs vs the previous oz run, 12 hours earlier.
This is +79 HDDs compared to average for the 2 week period. It means some unusually big drawdawns for the late Feb EIA reporting periods, especially compared to last Winters record mild temps. This WILL take us below the 5 year storage range for the first time since late Summer 2022?(just based on my memory).
This next EIA report, released at 9:30 am on Thursday is going to be a very wimpy number! Could the SouthCentral region see a very small injection??? Probably just a tiny withdrawal. What do you think, Larry?
https://www.cpc.ncep.noaa.gov/products/tanal/temp_analyses.php
With Winter HDDs getting close to 2/3rds behind us, it's tough in February to generate sustained buying by large specs that trade weather.
This same amount of additional cold vs average in December or early January would have caused a huge upside breakaway gap with no looking behind. In fact........it did!
That pattern is expected. The market sees the end of Winter in February and no amount of cold is possible that was possible earlier in the Winter. This is what drives many of the big weather traders.
The amount of cold coming up is very significant and still capable of pushing us higher but I'm just providing the underlying reality which frequently dampens out the greatest upside potential. Every year is different though!
We had a VERY CONTRA seasonal move higher from sustained cold in January, that COULD HAVE delayed the reaction lower after that top??? This weeks EIA is going to be very bearish. That counts.
https://charts.equityclock.com/natural-gas-futures-ng-seasonal-chart
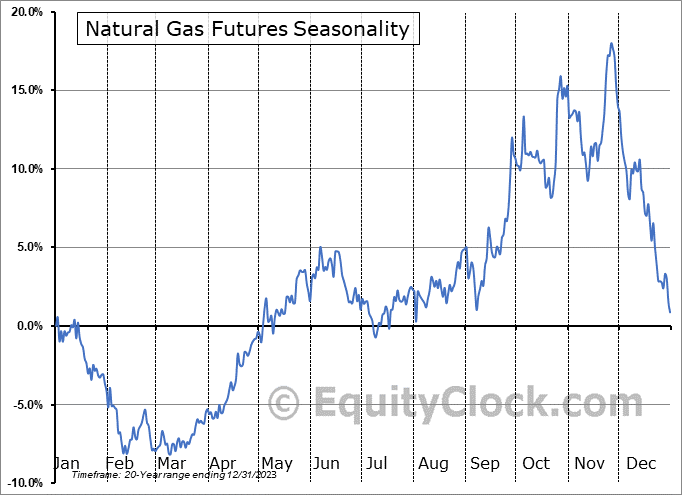
+++++++++++++
Charts below:
1. 1 week
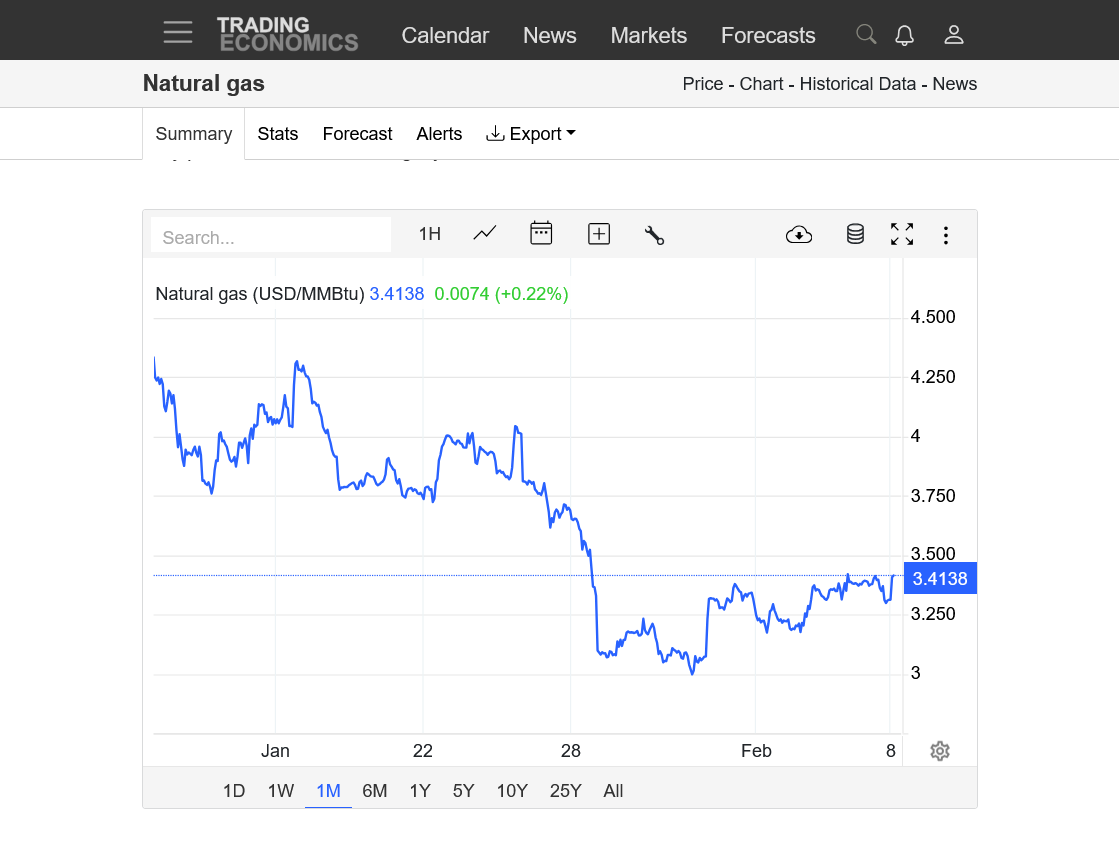
2. 1 month
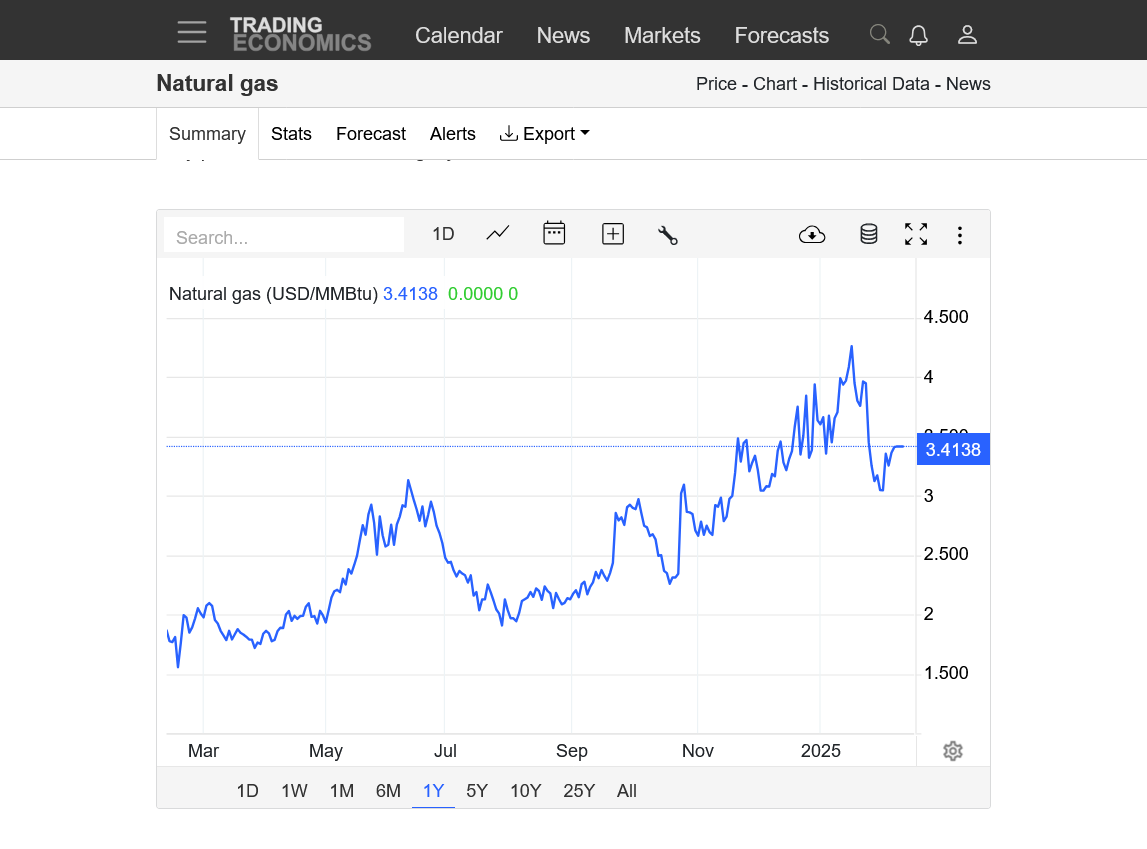
3. 1 year
4. 10 years
5. 35 years
https://tradingeconomics.com/commodity/natural-gas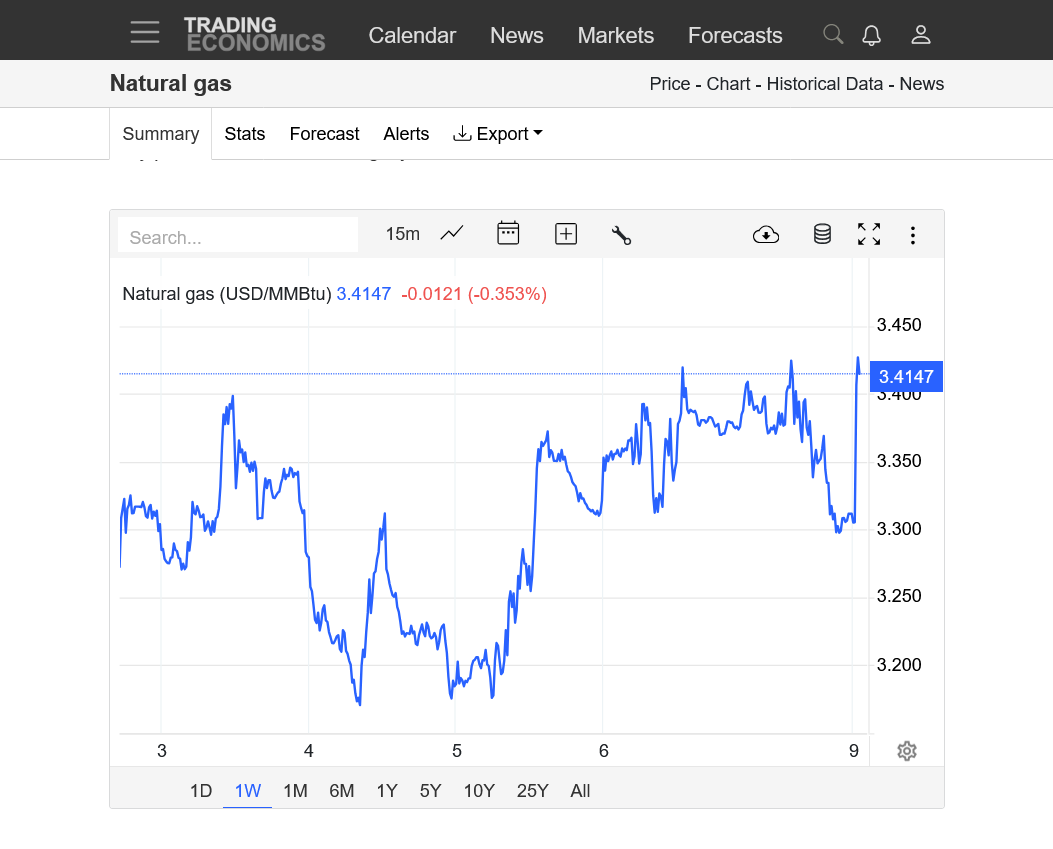
1.
The overnight, 0z European Ensemble model was -5 HDDs/BEARISH. And look at how the HDDs plunge lower at the end of the period, suggesting this to be a TRANSIENT pattern, lasting less than 2 weeks at the end of Winter. So we sold off and made new lows for the day session just over an hour ago but have come roaring back towards the highs in the last hour because buyers still have some ammo with this amount of cold coming and storage whittled down to the least amount in the last several years.
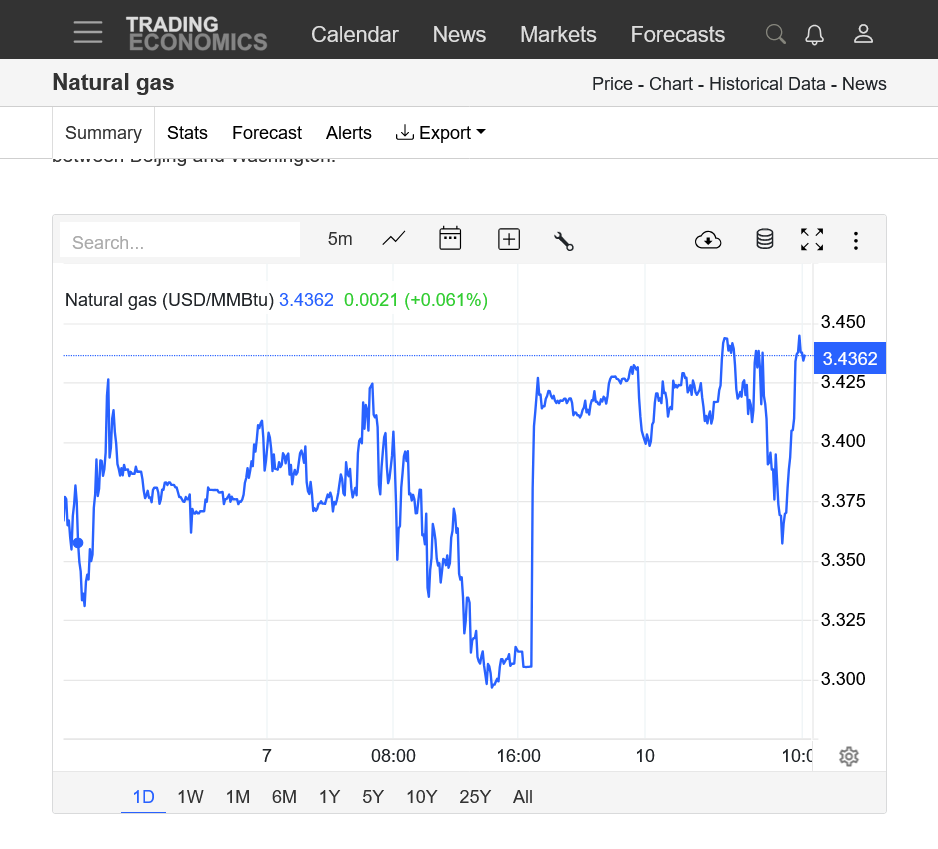
Natural gas the past day below.
How do you define a high confidence trade in a market yo yo-ing like this(spikes up and down that are impossible to time)?
You don't! You observe and analyze and wait for a better opportunity unless your game is gambling/taking risks that can be minimized with much higher confidence trading set ups.
https://tradingeconomics.com/commodity/natural-gas
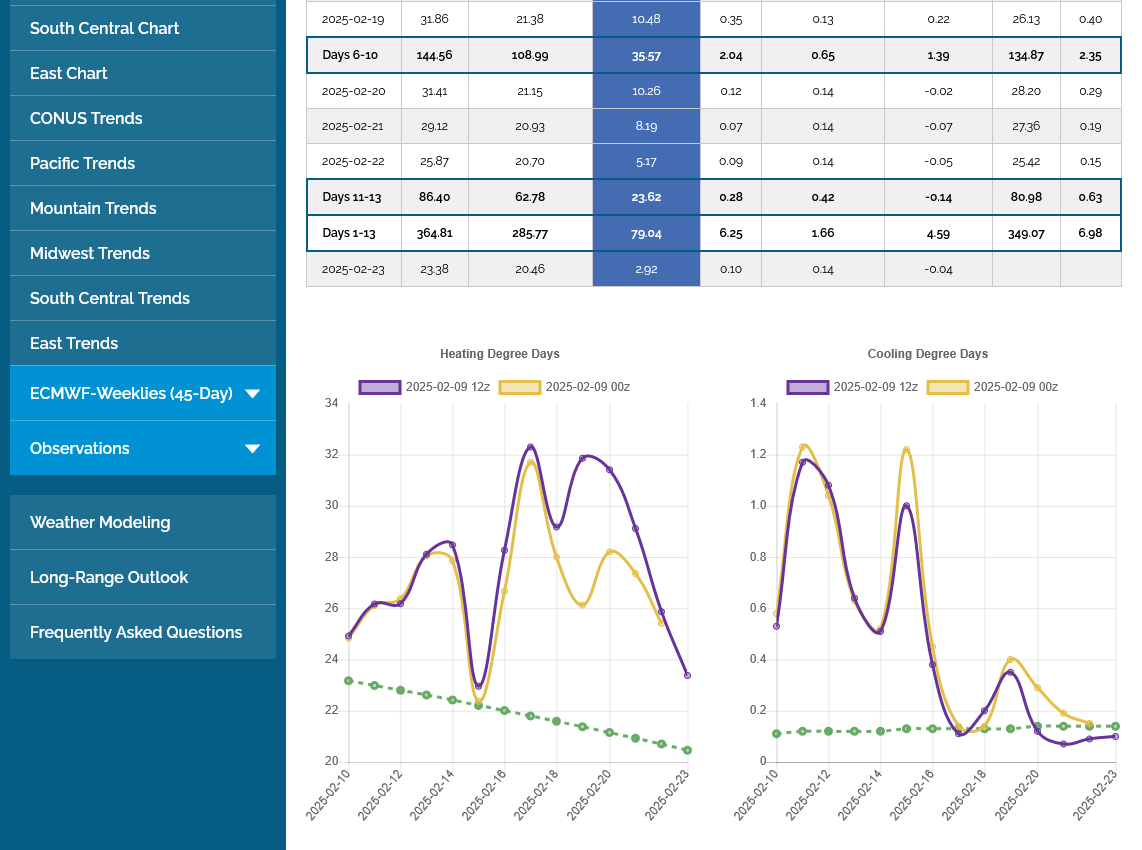
The last 0z European Ensemble was another +2.2 HDDs overnight vs the previous 12z run. It's also a whopping +85 HDDs vs average for this time of year!! How long will this impact prices with the moderation at the end of week 2?
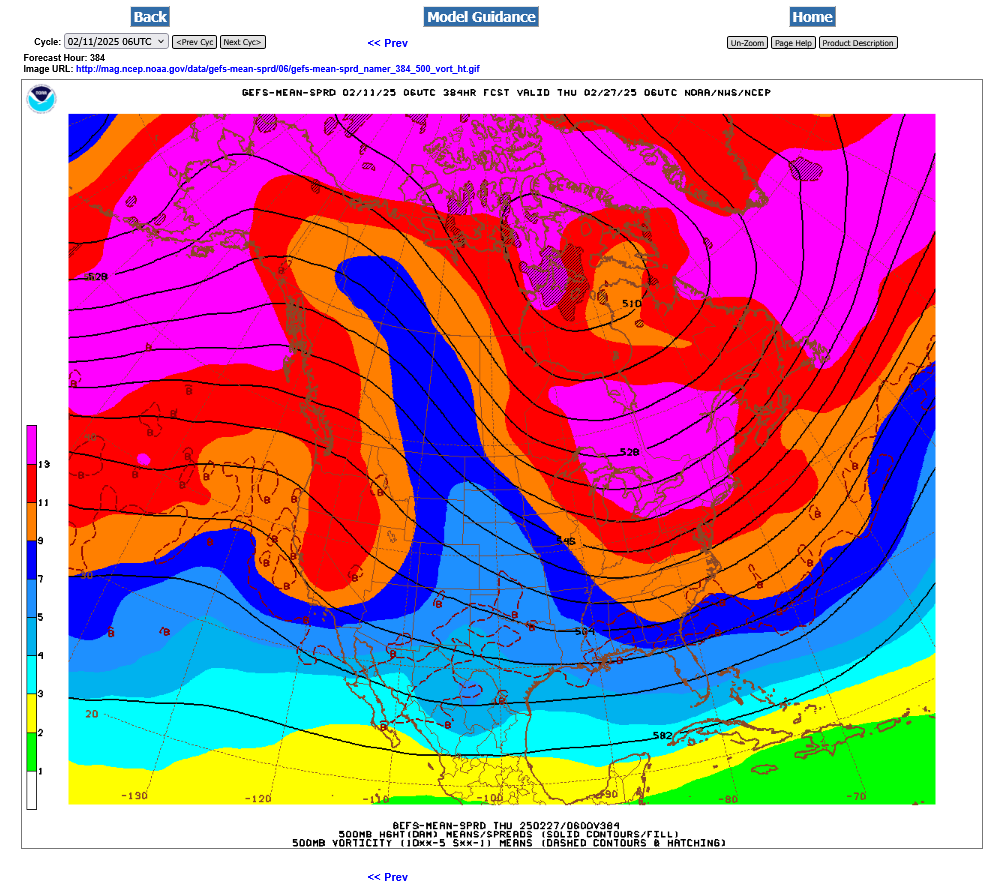
Regardless of the moderation, the ridge/west, trough/east couplet remains solid in late February which should keep the East on the chilly side! This was the last 500mb map for the 06 GEFS on 2-27-25
+++++++++++++
Re: Re: New Winter Weather pattern 2-6-25
By metmike - Feb. 12, 2025, 4:54 p.m.
Thanks Larry!
the 12z European model never came out.
++++++++
Finally came out. +16HDDs vs the previous 0z run so NG has spiked higher in early evening trading! Small gap higher on the open. Unusual for a non sunday night open.
I was thinking that we might be getting close to the top!
some of the solutions are trying to go back to really cold in 2 weeks. Much uncertainty.
The last Euro Ensemble was another +3 HDDs. Now it’s +100 HDDs vs average for the next 2 week perid.
however, we could be at a double top if a big moderation in week 2 continues,instead of it getting colder again.
Bullish? -100 Bcf
![]()
for week ending February 7, 2025 | Released: February 13, 2025 at 10:30 a.m. | Next Release: February 20, 2025
| Working gas in underground storage, Lower 48 states Summary text CSV JSN | |||||||||||||||||||||||||
|---|---|---|---|---|---|---|---|---|---|---|---|---|---|---|---|---|---|---|---|---|---|---|---|---|---|
| Historical Comparisons | |||||||||||||||||||||||||
| Stocks billion cubic feet (Bcf) | Year ago (02/07/24) | 5-year average (2020-24) | |||||||||||||||||||||||
| Region | 02/07/25 | 01/31/25 | net change | implied flow | Bcf | % change | Bcf | % change | |||||||||||||||||
| East | 468 | 507 | -39 | -39 | 542 | -13.7 | 521 | -10.2 | |||||||||||||||||
| Midwest | 559 | 605 | -46 | -46 | 670 | -16.6 | 631 | -11.4 | |||||||||||||||||
| Mountain | 193 | 200 | -7 | -7 | 179 | 7.8 | 137 | 40.9 | |||||||||||||||||
| Pacific | 224 | 230 | -6 | -6 | 224 | 0.0 | 196 | 14.3 | |||||||||||||||||
| South Central | 853 | 854 | -1 | -1 | 930 | -8.3 | 879 | -3.0 | |||||||||||||||||
| Salt | 229 | 217 | 12 | 12 | 267 | -14.2 | 249 | -8.0 | |||||||||||||||||
| Nonsalt | 624 | 638 | -14 | -14 | 663 | -5.9 | 629 | -0.8 | |||||||||||||||||
| Total | 2,297 | 2,397 | -100 | -100 | 2,545 | -9.7 | 2,364 | -2.8 | |||||||||||||||||
| Totals may not equal sum of components because of independent rounding. | |||||||||||||||||||||||||
Working gas in storage was 2,297 Bcf as of Friday, February 7, 2025, according to EIA estimates. This represents a net decrease of 100 Bcf from the previous week. Stocks were 248 Bcf less than last year at this time and 67 Bcf below the five-year average of 2,364 Bcf. At 2,297 Bcf, total working gas is within the five-year historical range.
For information on sampling error in this report, see Estimated Measures of Sampling Variability table below.
Note: The shaded area indicates the range between the historical minimum and maximum values for the weekly series from 2020 through 2024. The dashed vertical lines indicate current and year-ago weekly periods.
+++++++++++++++++++
Interesting, new pattern change at the end of 2 weeks.
Back to strong +PNA regime but the current, record low -5 AO leaps to +AO and the slightly -NAO goes to a slightly +NAO.
The actual maps shows the Ridge/West-Trough/East couplet that has been present for much of Winter, returning with potential for cross polar flow to bring very cold air from Siberia in.
https://www.marketforum.com/forum/topic/83844/#83856
+++++++++++++
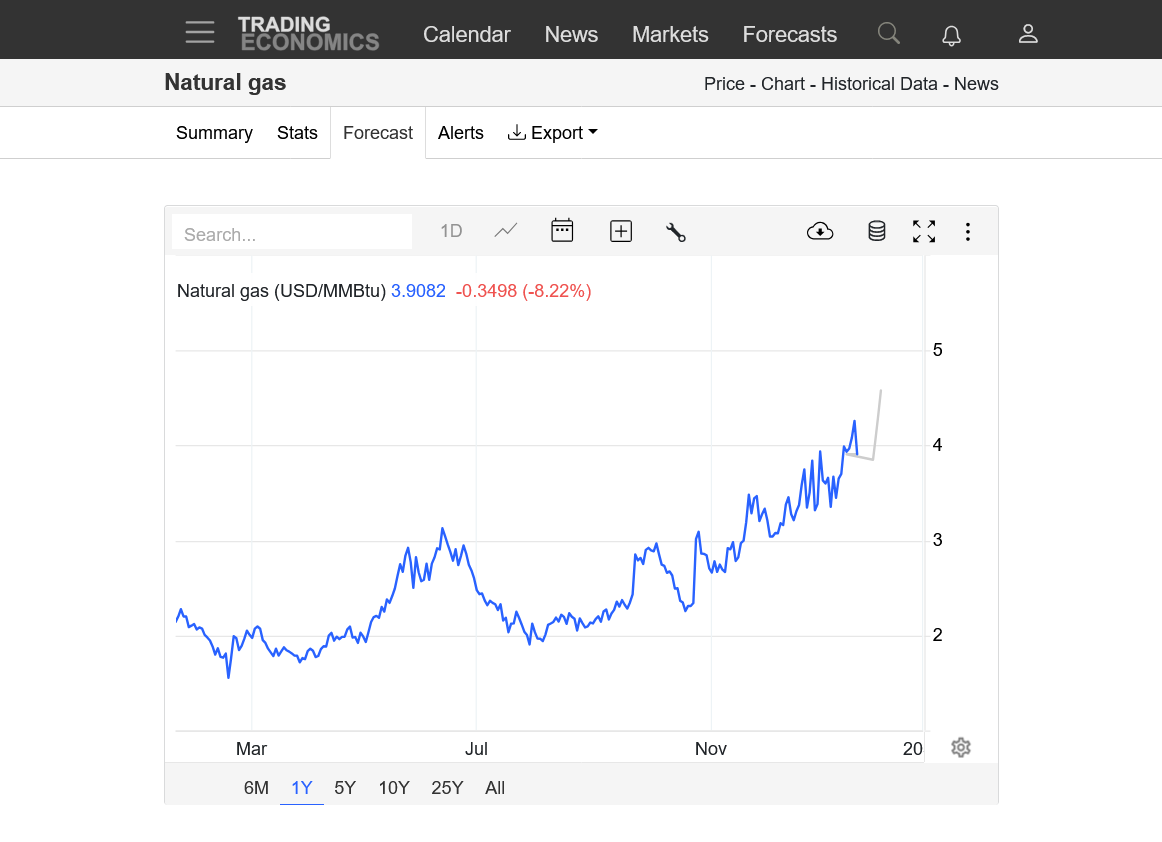
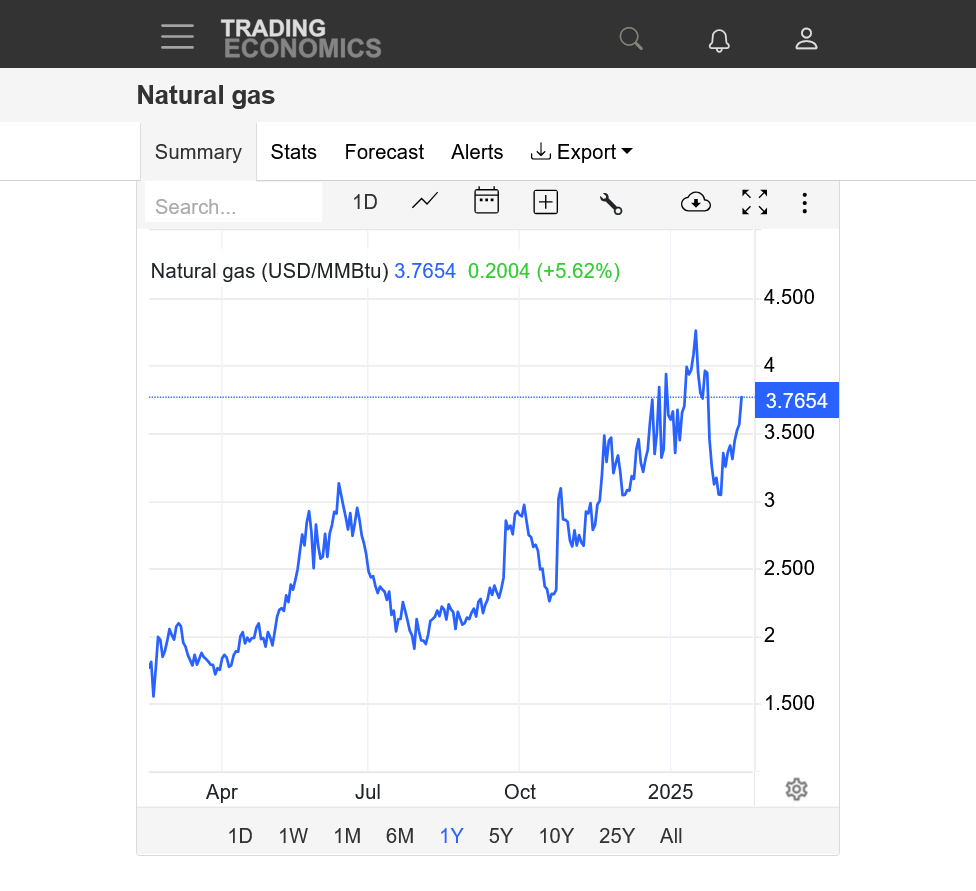
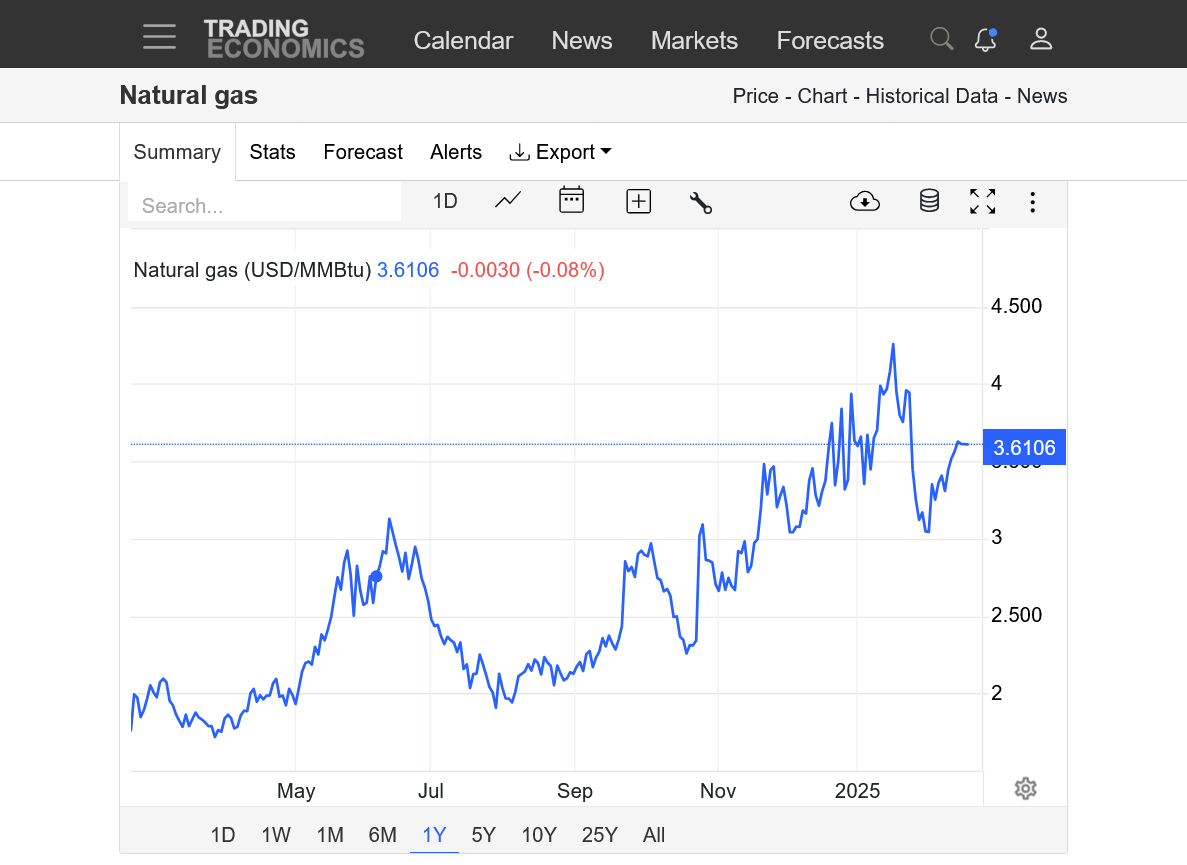
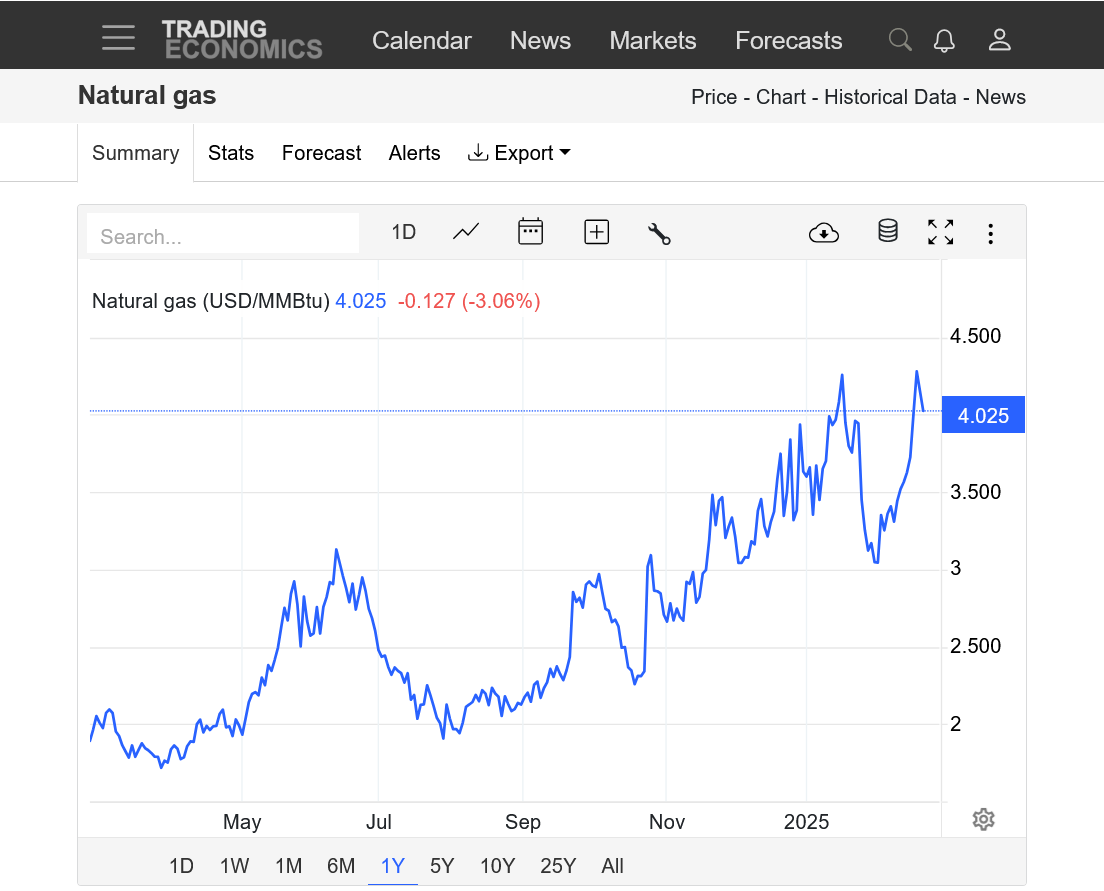
1. 1 year: This is a CONTINUOUS chart(prices of the front month in January were HIGHER than this). The March contract is breaking out to new highs here....OR PUTTING IN A DOUBLE TOP!!!
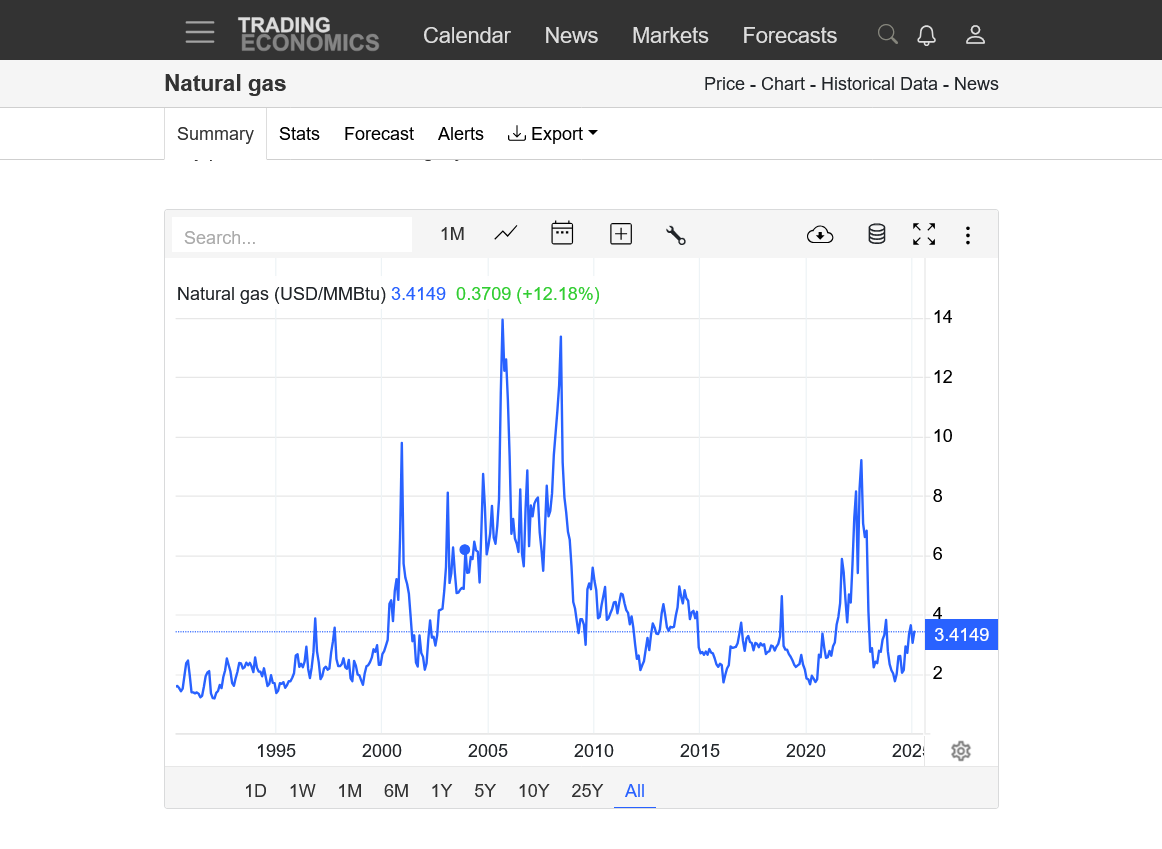
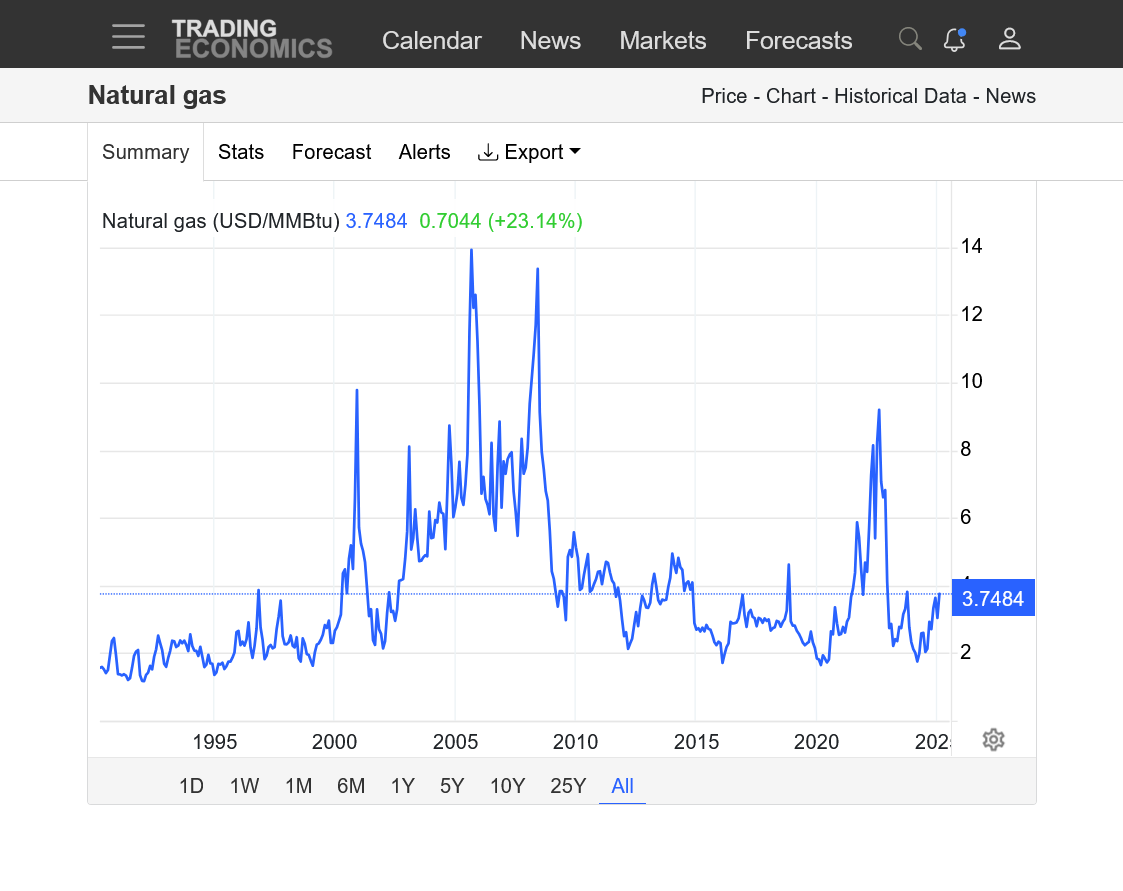
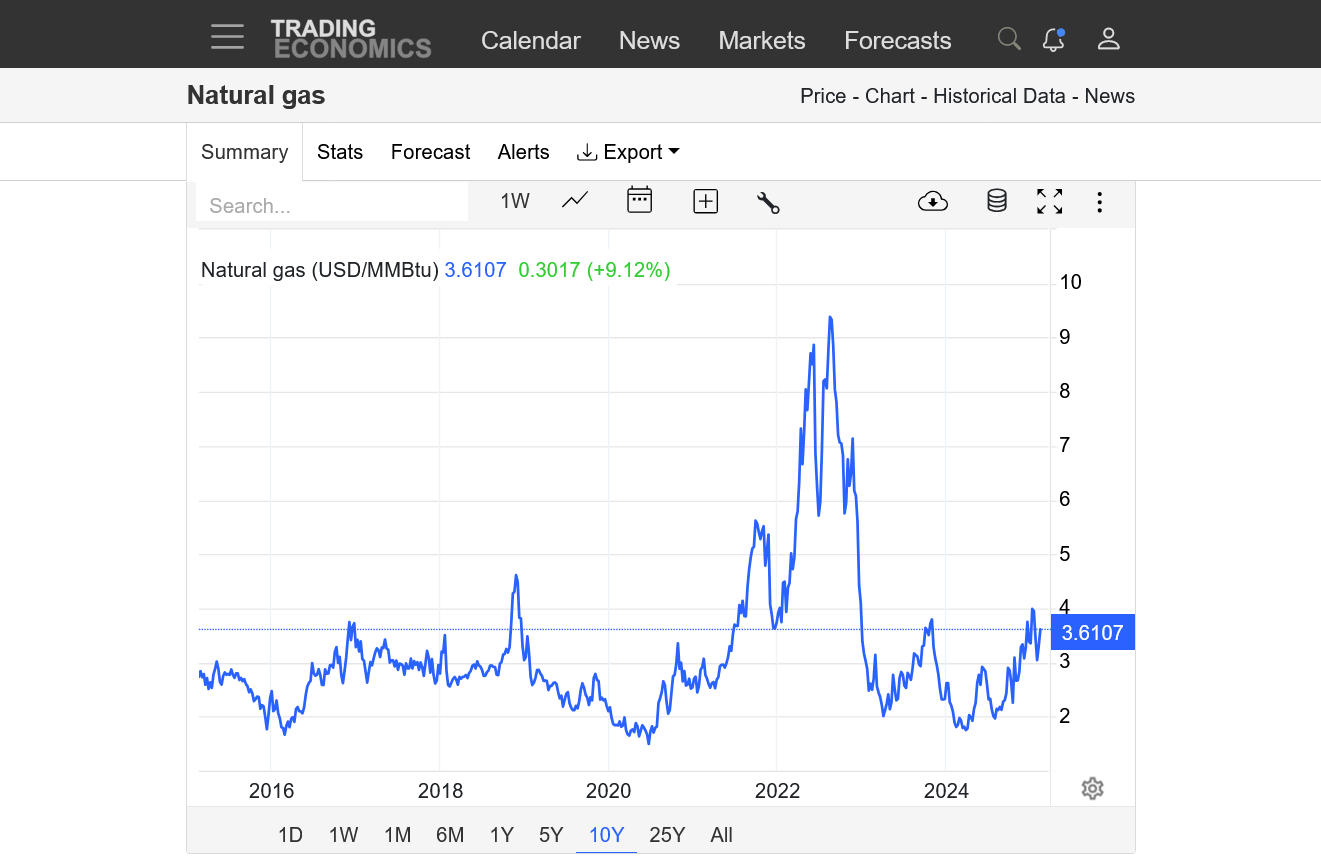
2. 35 years: This does not have the January spike above $4. It shows a triple bottom below $2 and the spike above $9 in August 2022 from low storage(that was followed by record huge injections in Fall 2022 and a price collapse).
https://tradingeconomics.com/commodity/natural-gas
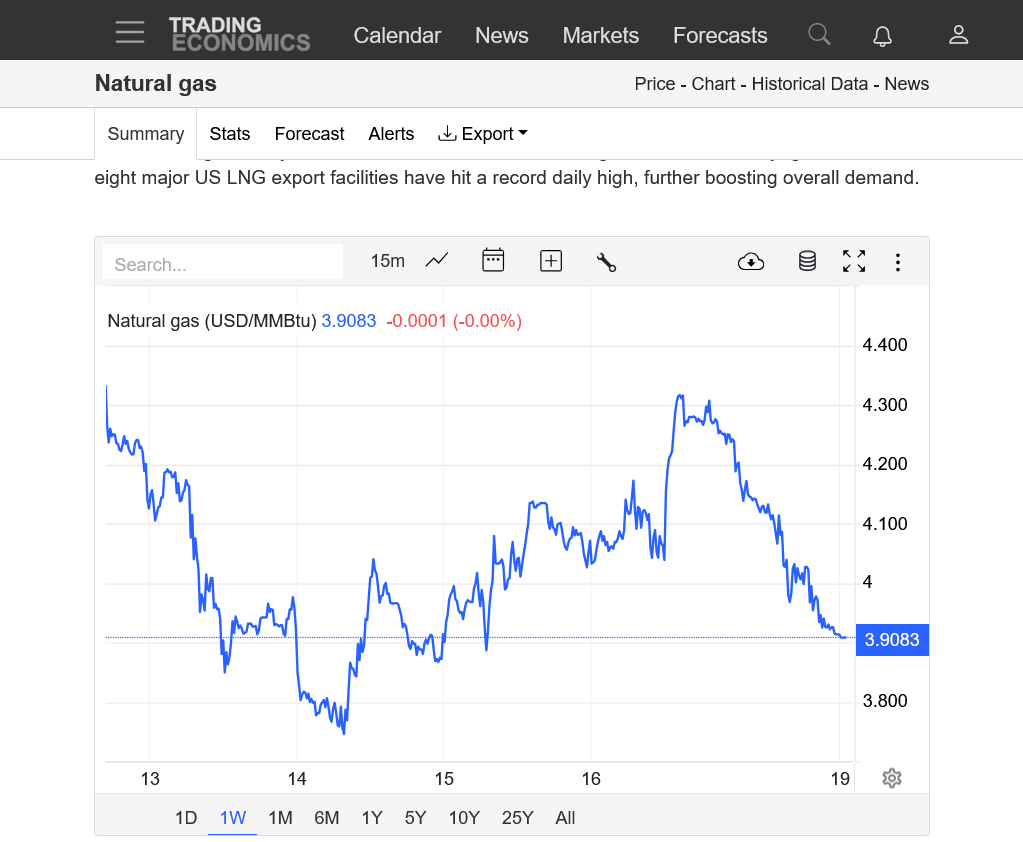
A sharply lower open (not a gap) then a spike below $3.6 that held so far. Volume is 3,500 in 10 minutes.
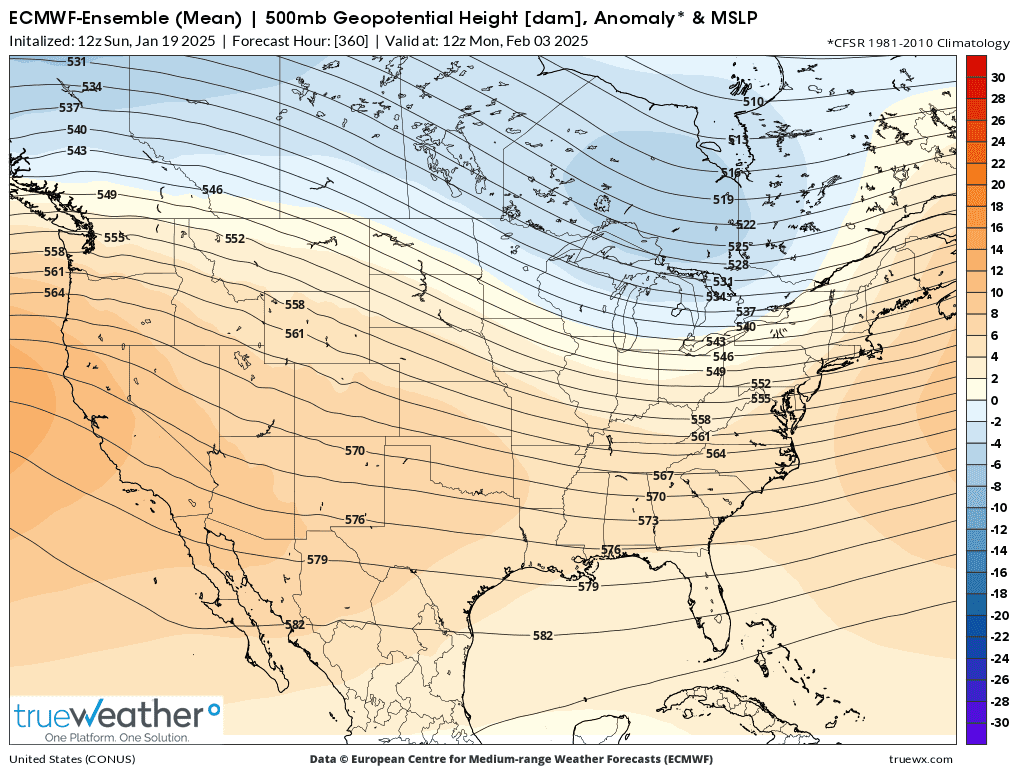
Models suggest a huge warm up to above average temps during week 2 after the near record cold this week in the midsection.
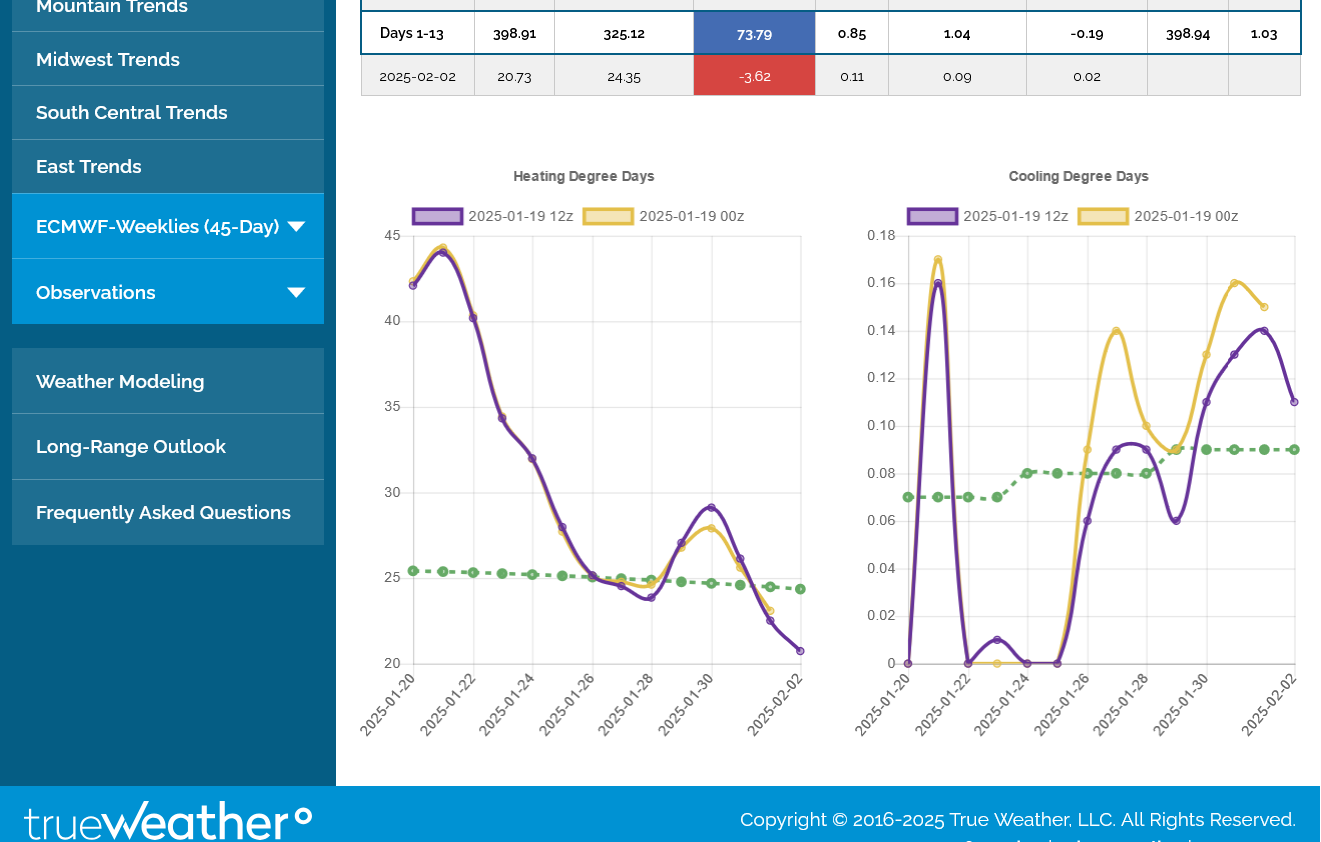
This was the last 12z European Ensemble run below. HDDs are on the left. Purple was the last run -9 HDDs. The previous one was 12 hours earlier.
A couple of massive draw downs coming up to storage.......but the market knew this last week.
https://tradingeconomics.com/commodity/natural-gas
1. 1 week
2. 1 year
3. 10 years
4. 35 years
NG was up to the highs of the session early this morning, until around 7am, then got hit with another group of bearish traders(that much have started then) and sold off around $1,000/contract until around 10 am. It's battled back close to mid range, just ABOVE $3.6 again.
I've been looking for a good spot to sell ng, when the market is ready to dial in the week 2 warm up.
We do have some bullish ammo though.
1. Storage is low
2. Some huge drawdowns coming up.
3. Frigid weather now
4. Will March turn cold again? The long range indicators say yes. A SSW event for instance. Get a load of this week 3 and week 4 LOW skill forecast:
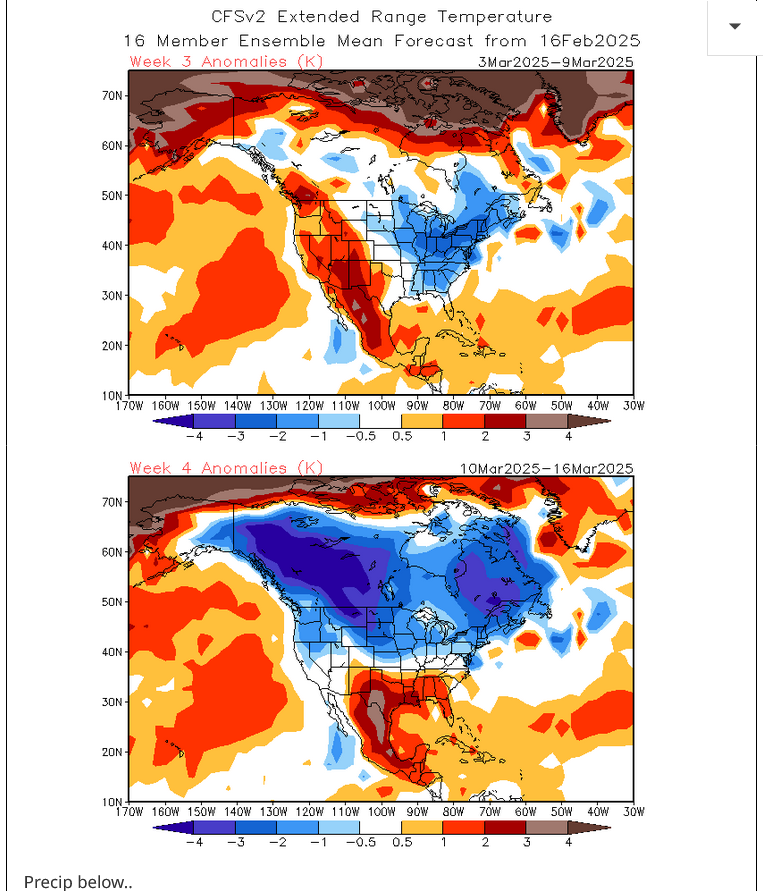
5. It's impossible to know, in a market like this that the best time to sell was before 7am, anticipating the sell off. Then, to know to take profits at 10 am because of the bounce back.
I think alot of algorithm trading goes on at times which is also why Larry stopped trading natural gas.
There are so, so many times when the algorithm traders trump weather, especially with knee jerk spikes that make it much different than 20 years ago
Thats the face of a frustrated weather trader
that the face(s) of a weather trader when the market does the opposite of what they thought that it would
Thats the face of a weather trader that loses money
Thats the face of a weather trader that gives up
Then you just learn from mistakes and acknowledge what needs adjustiing or in the case of some markets, appreciate the risks exceed the rewards. Then, have fun watching and analyzing them which is FREE, while you learn a few things without risking capital.
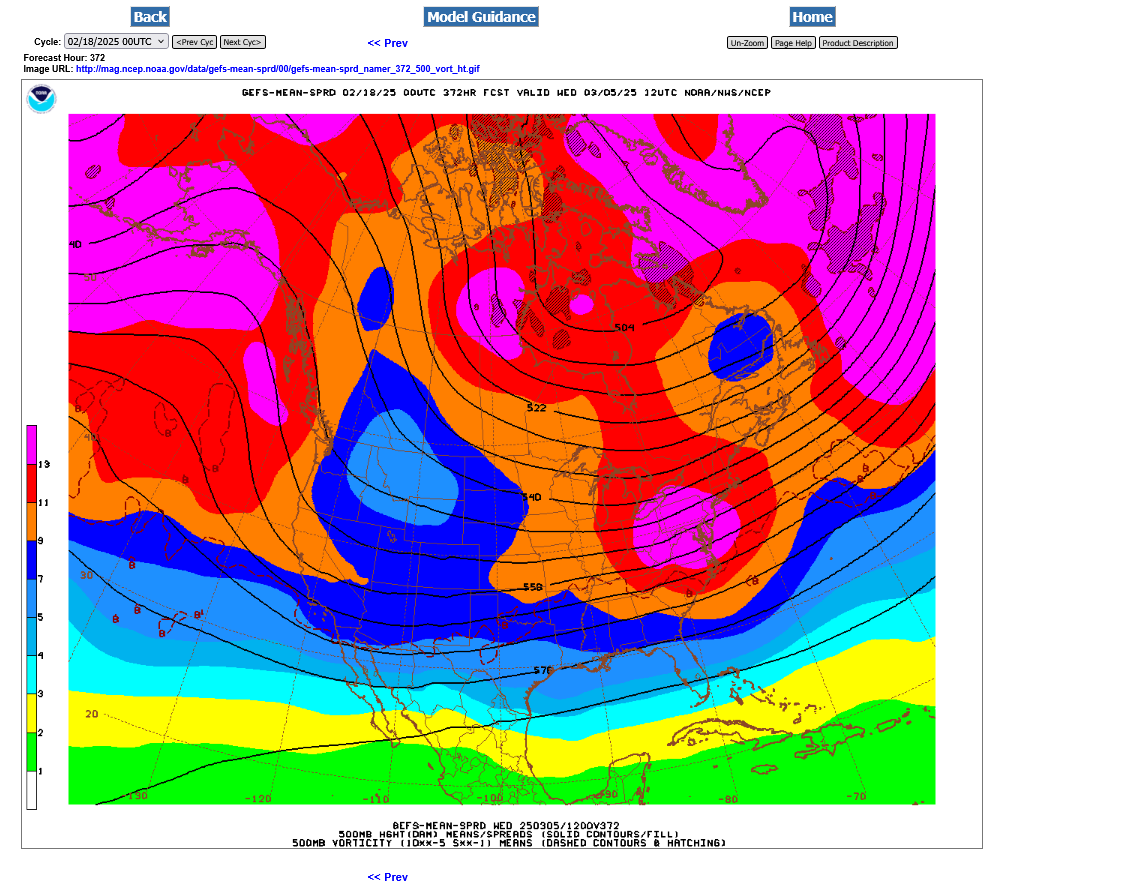
Despite the big warm up back to average this weekend and all of week 2, the cross polar flow at the end of 2 weeks is back on the GEFS, which means more frigid air coming from Siberia, crossing Canada and aimed at the US.
Purple/left was the last 0z GEFS run for HDDs. +2 HDDs vs the previous run. The last 4 runs have been fairly close but each one has been +2 HDDs vs the previous one. So this last one was +6 HDDs higher than the 06z run early on Monday-3 runs ago!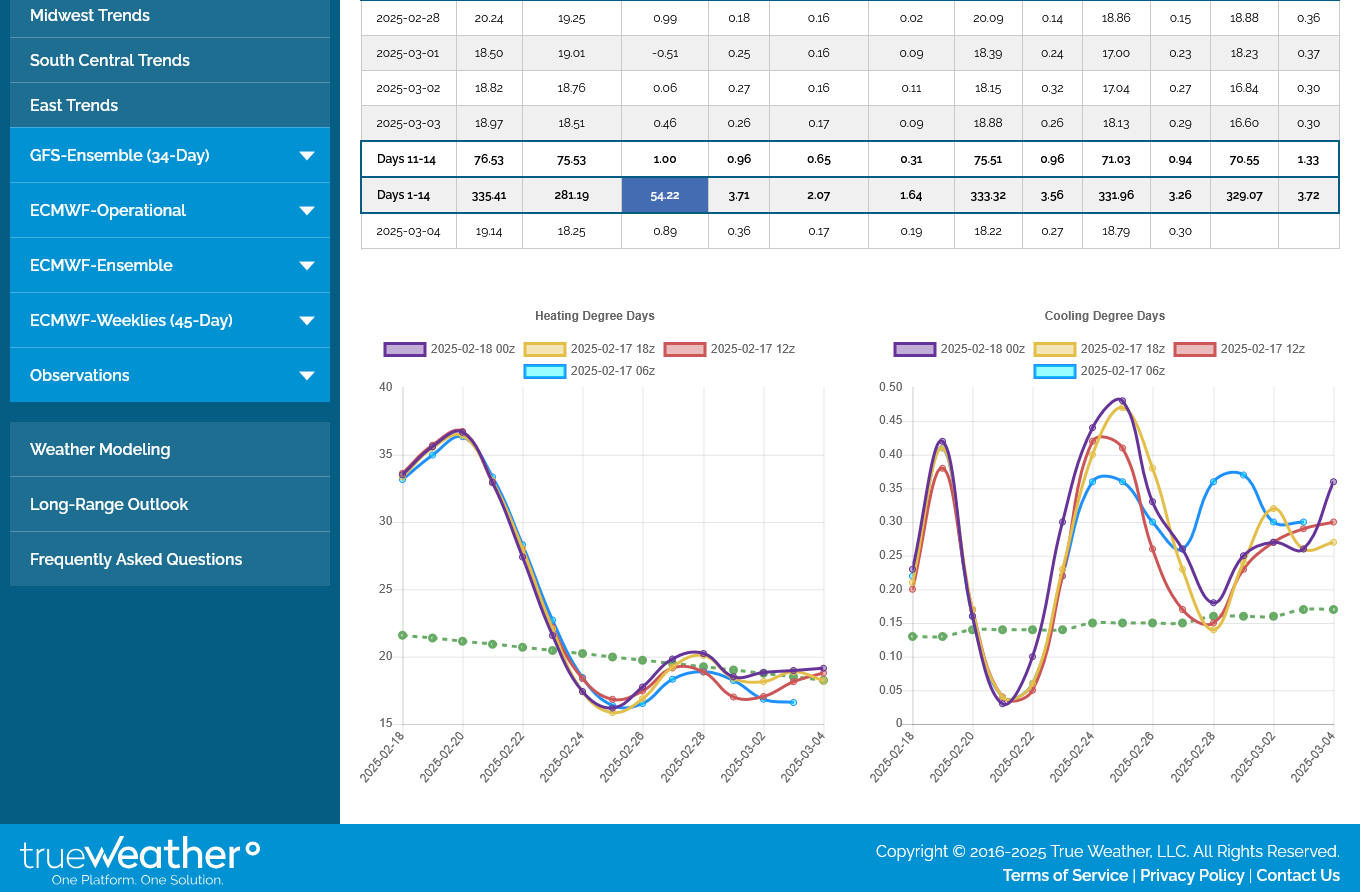
WOW! What a recovery in NG today. From down $1,500/contract overnight to +$2,800 right now.
Look at the cross polar flow (mentioned last night) reloading/amplifying again at the end of week 2:
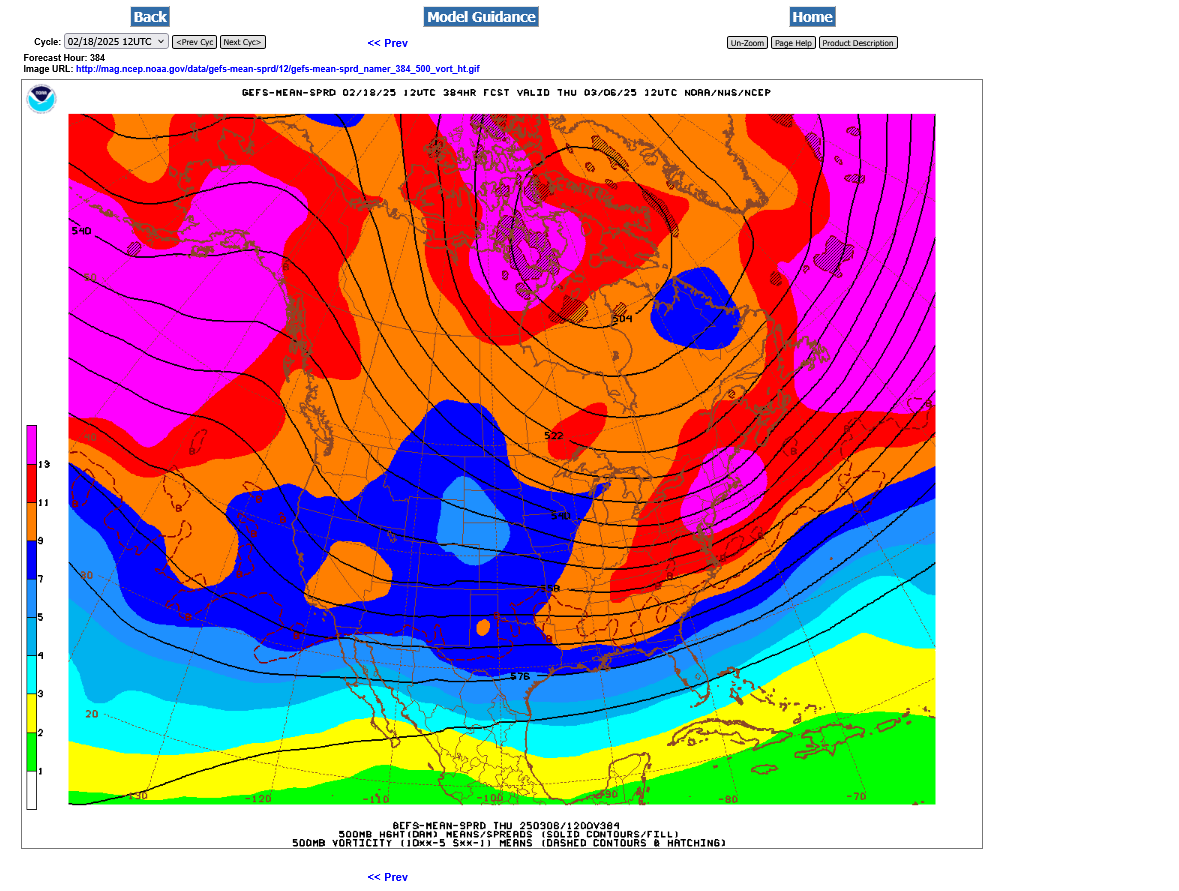
This was the last map, early in week 3 on the last 12z GEFS: Streamlines coming straight from Siberia, crossing Northwest Canada and continuing southeast to the Upper Midwest./Great Lakes.
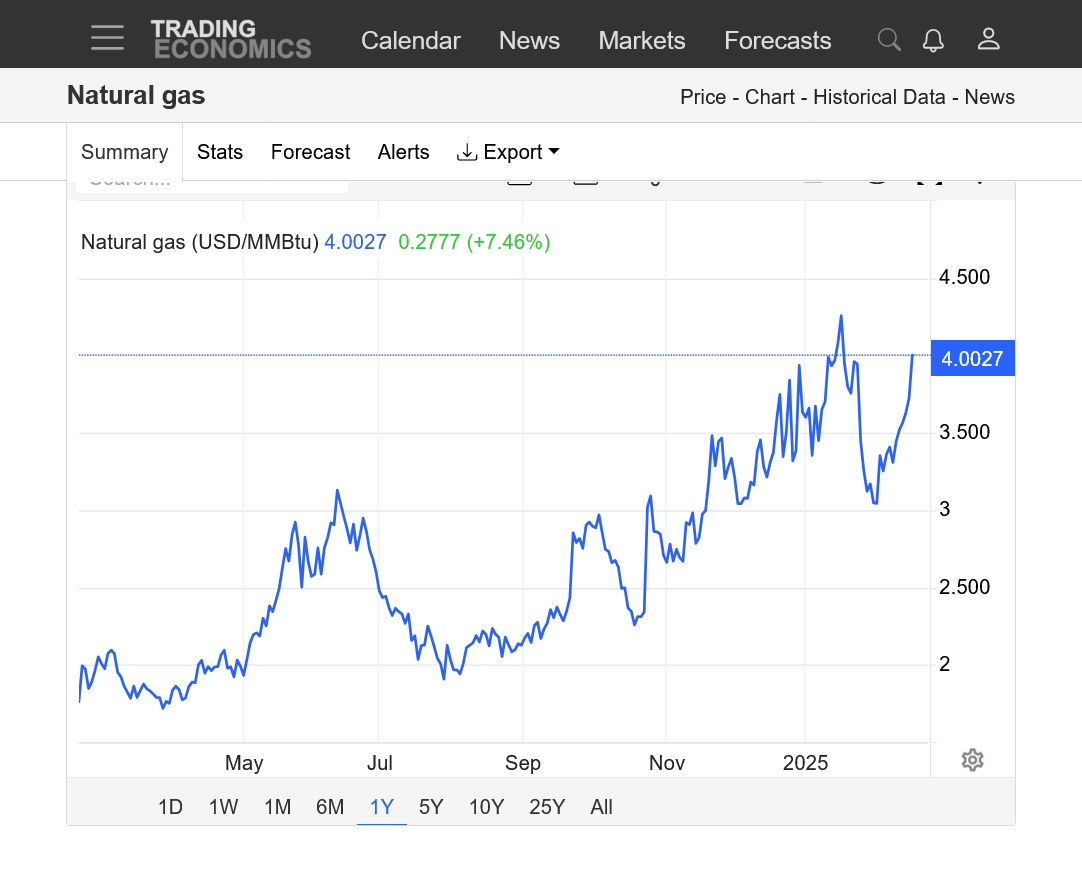
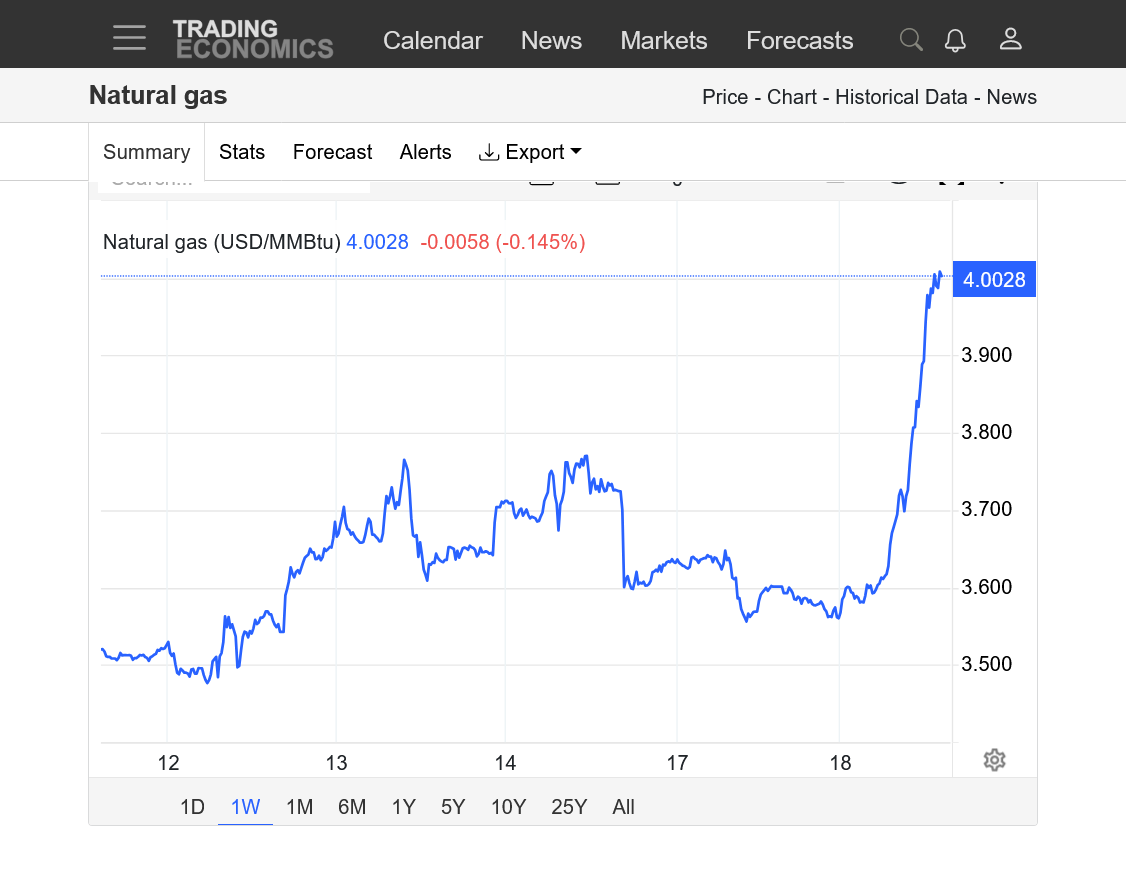
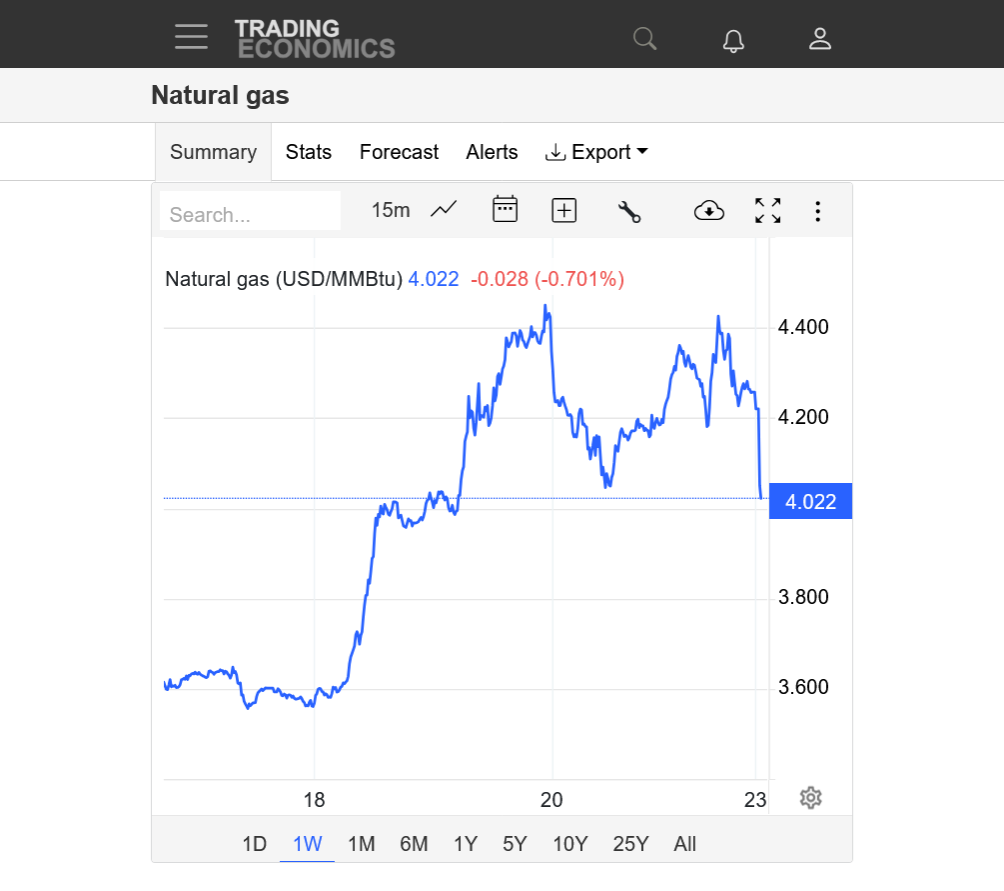
https://tradingeconomics.com/commodity/natural-gas
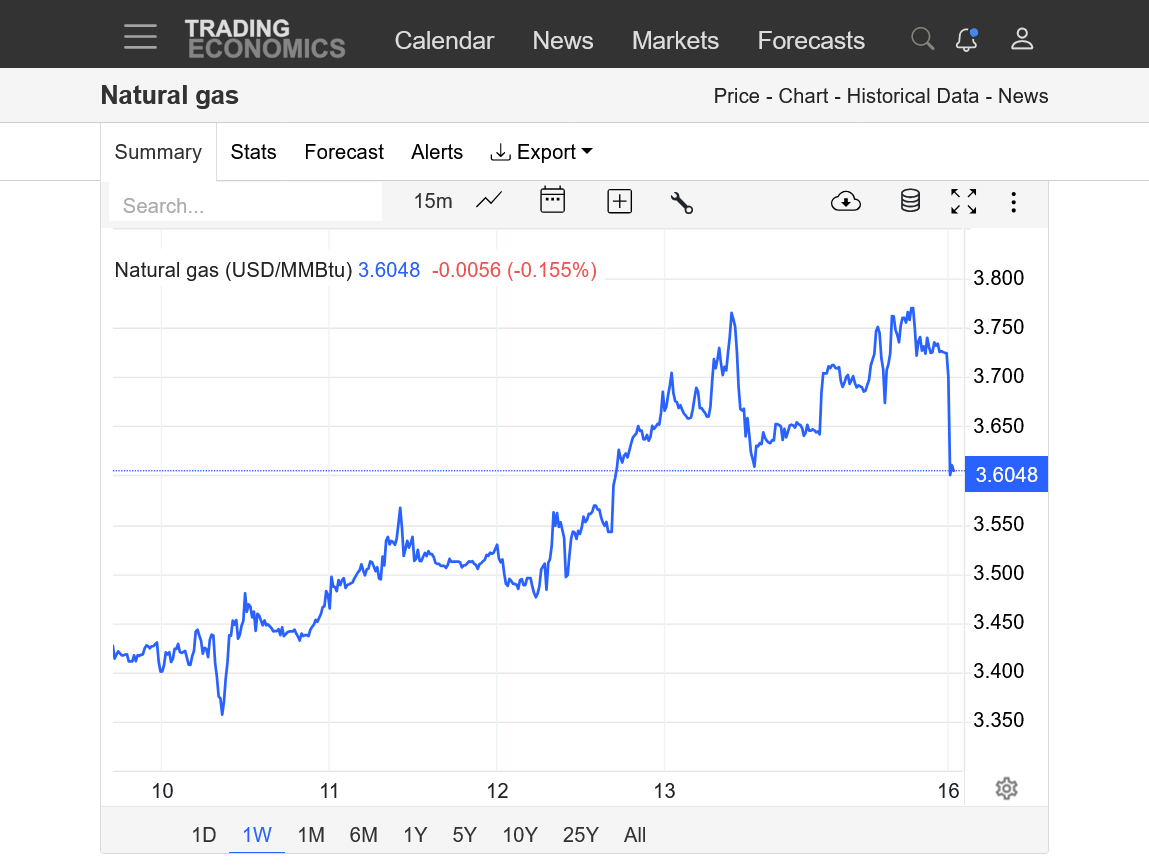
1. 1 year-this is the continuous chart. March ng had a massive upside break out today!
2. 1 week-below 3.6 yesterday and early today, now above 4!!
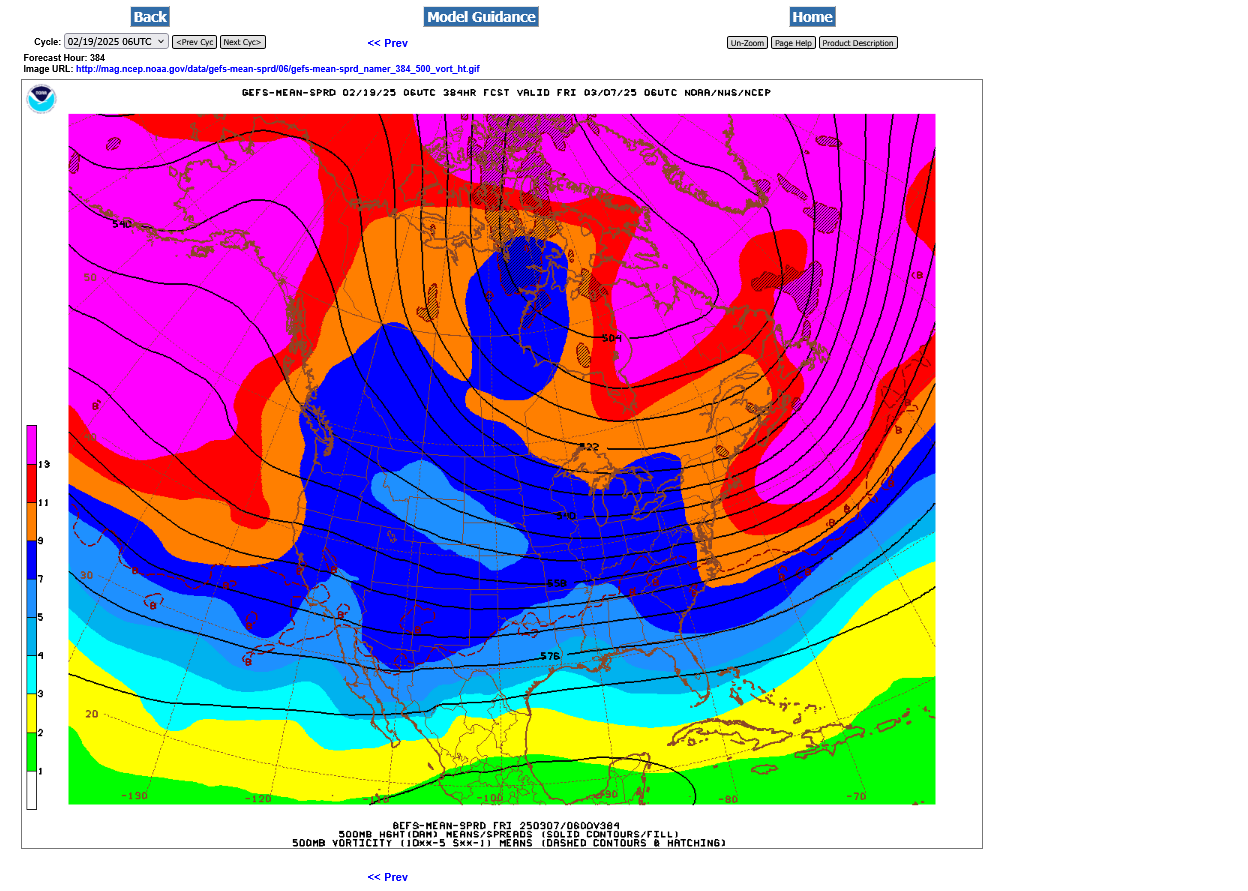
More huge gains today for the same reason:
March 7th map for 500mb from the last 6z GEFS. CROSS POLAR flow with 5 stream lines at the top of the map!
The last 0z European Ensemble model was just +2 HDDs vs the 12z run but we should note the trend of it getting colder again at the end. Purple/left was that last run. The other one was from 12 hours earlier:
1:20pm: In response to Larry's comments below:
By WxFollower - Feb. 19, 2025, 1:55 p.m.
+++++++++++++++++++++
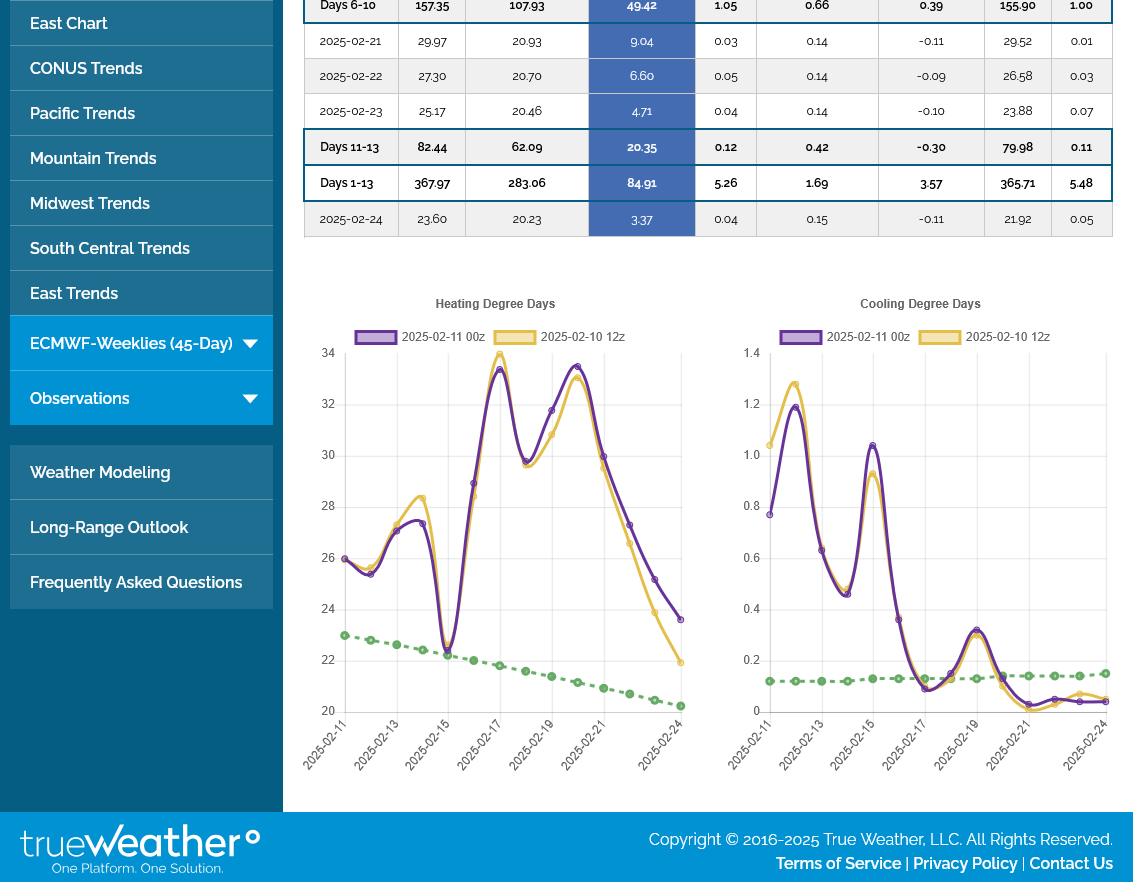
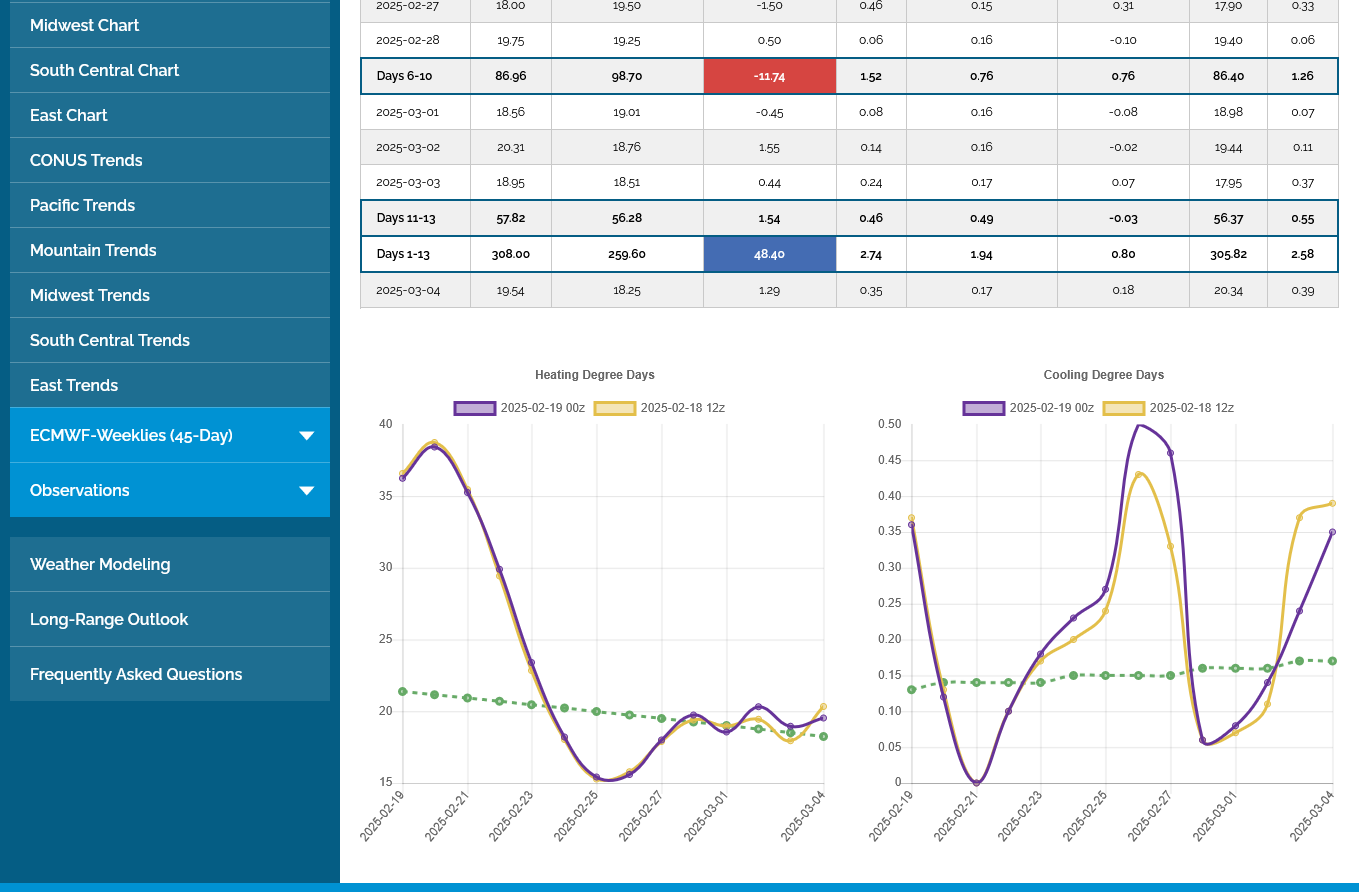
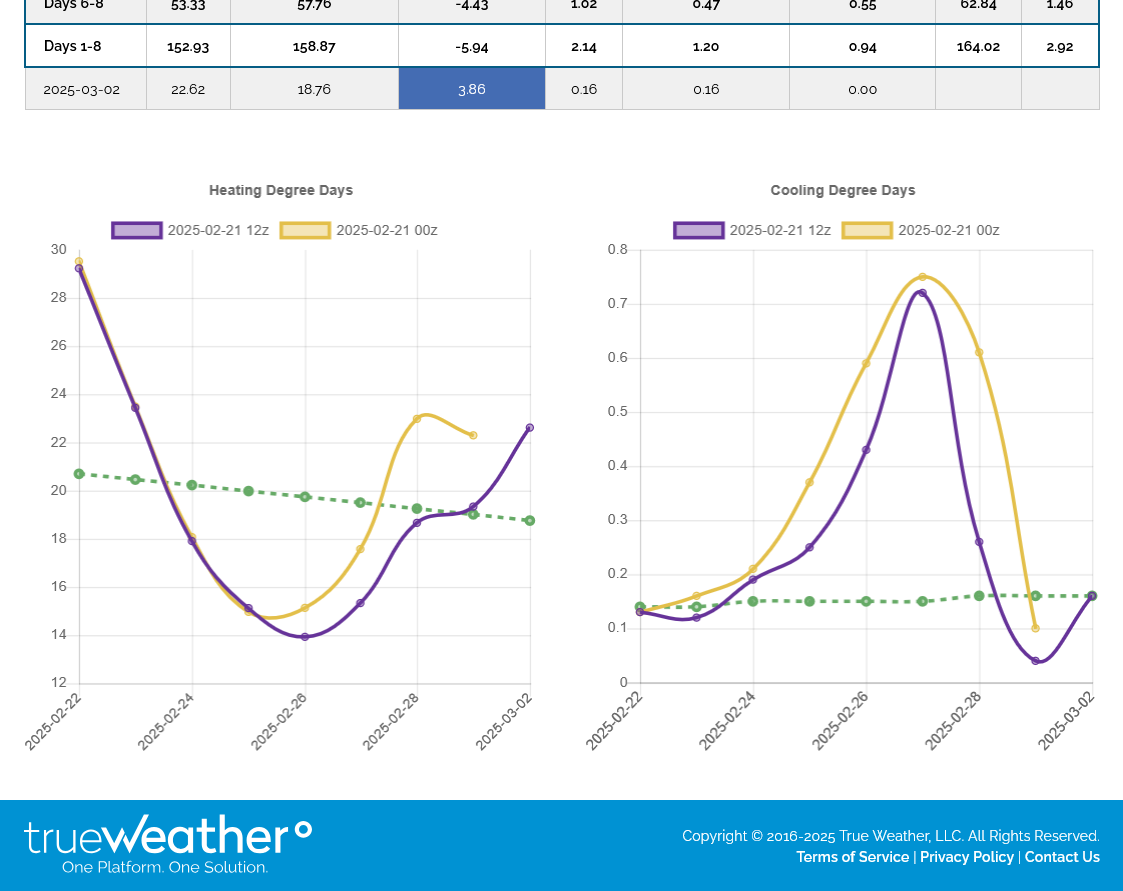
These were the last 4 runs of the GEFS thru the 12z run 2-19-25 to compare with the EE above(0z-2-19-25 and 12z-2-18-25)
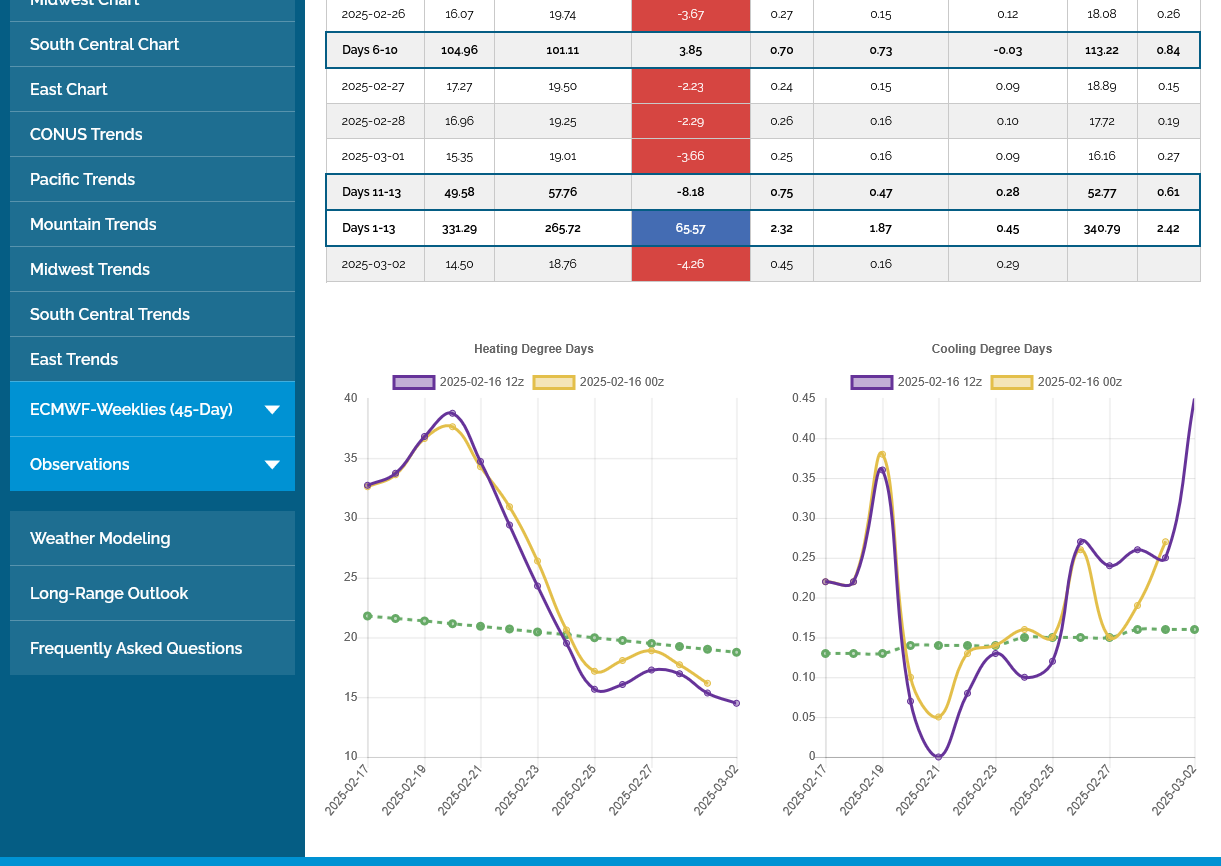
The GEFS is clearly colder at the end of the period. For instance the GEFS crosses back over the green line to positive almost a day earlier (2-27) and after that is noticeably more above the green line as the EE. In fact the EE is close to average the last 5 days, while the GEFS is clearly above average the last 6 days(it goes out 1 day farther). I did not count day 7 in purple from this last run.
The GEFS goes out thru 14 days and the EE only 13 days, so the total HDDs on the GEFS will usually be higher.
They use the same 6-10 day periods and for these runs, the GEFS was colder 92.5 vs the EE of 87.3 during the 6-10 day periods that are available right now. The last 12z EE is just now updating thru day 8.
So I don't see a cold bias of the EE, Larry, Just the opposite with data from the last 24 hours above.
I can't say it isn't the opposite and the EE has a cold period at other times and will have to take your word for it but the latest runs show that the GEFS was the colder model for HDDs in week 2, when it turns colder again.
Hey Mike,
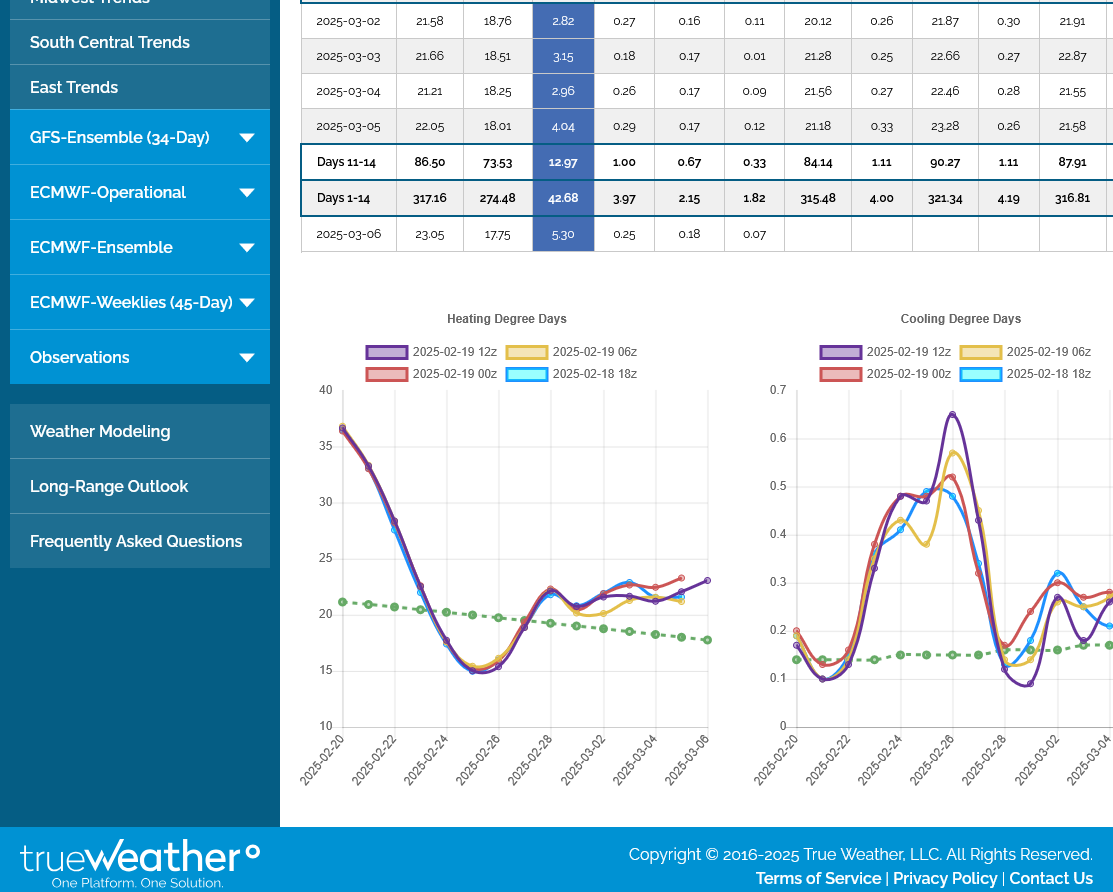
I continue to notice a clear pattern this winter for very cold days. I find it interesting that the EE continues to often have 1-3 HDD/day more than GEFS on the first 3-4 very cold days (average of ~2). Latest example from your graphs are for the very cold Feb 19th-22nd:
GEFS: 35, 36, 33, 28
EE: 36, 38, 35, 30
Other periods looking earlier in this thread:
Jan 13-15:
GEFS: 30, 32, 30
EE: 31, 34, 32
Jan 21-24:
GEFS: 41, 37, 32, 31
EE: 44, 40, 35, 35
Looking at some examples for when HDDs were below normal, I didn’t see this.
This tells me that most likely either the EE has a cold bias relative to GEFS on very cold days or that the TrueWeather algorithms to determine HDDs are different for EE vs GEFS.
Any thoughts?
Thanks, Larry!
I looked at the latest runs and made comments here:
Hey Mike,
Thanks. However, I’m only talking about the first few days of each run and only when they’re quite cold. I’m not talking about later in the runs. I see where GEFS currently is colder than EE then. But that doesn’t negate my point. I’ll repost this portion with a bolding to emphasize that I’m talking only about the first few days of each run:
“I find it interesting that the EE continues to often have 1-3 HDD/day more than GEFS on the first 3-4 very cold days (average of ~2). Latest example from your graphs are for the very cold Feb 19th-22nd:
GEFS: 35, 36, 33, 28
EE: 36, 38, 35, 30”
Thanks, Larry!
I see what you’re typing about for the early part of these last couple of runs and can’t explain it or the complete opposite tendency/bias diring the 2nd half of these runs.
To be honest, I never even pay attention to the first several days because
1.they don’t matter to traders that dialed in that cold long before then
2. are much less likely to change compared to a week 2 forecast
3. don’t tell us anything about where the pattern is headed compared to week 2 data
now that you mentioned it, I’ll probably be looking at this comparison to see if it continues. There must be a reason other than random variation if it’s so consistent, like you stated.
Thanks, Mike!
1. I agree with all that you said.
2. It seems to be only when those first few days are very cold.
I looked at the latest runs of the 18z GEFS and 12z EE and see exactly what you were pointing out. Great observation!
NG is getting to be (even more) untradeable!
Another ROBUST drawdown, -196 Bcf, with 2 more on the way. Next weeks will likely be a record for that week.
![]()
for week ending February 14, 2025 | Released: February 20, 2025 at 10:30 a.m. | Next Release: February 27, 2025
| Working gas in underground storage, Lower 48 states Summary text CSV JSN | |||||||||||||||||||||||||
|---|---|---|---|---|---|---|---|---|---|---|---|---|---|---|---|---|---|---|---|---|---|---|---|---|---|
| Historical Comparisons | |||||||||||||||||||||||||
| Stocks billion cubic feet (Bcf) | Year ago (02/14/24) | 5-year average (2020-24) | |||||||||||||||||||||||
| Region | 02/14/25 | 02/07/25 | net change | implied flow | Bcf | % change | Bcf | % change | |||||||||||||||||
| East | 419 | 468 | -49 | -49 | 513 | -18.3 | 483 | -13.3 | |||||||||||||||||
| Midwest | 494 | 559 | -65 | -65 | 640 | -22.8 | 581 | -15.0 | |||||||||||||||||
| Mountain | 182 | 193 | -11 | -11 | 174 | 4.6 | 129 | 41.1 | |||||||||||||||||
| Pacific | 208 | 224 | -16 | -16 | 218 | -4.6 | 189 | 10.1 | |||||||||||||||||
| South Central | 799 | 853 | -54 | -54 | 942 | -15.2 | 837 | -4.5 | |||||||||||||||||
| Salt | 214 | 229 | -15 | -15 | 276 | -22.5 | 235 | -8.9 | |||||||||||||||||
| Nonsalt | 585 | 624 | -39 | -39 | 666 | -12.2 | 603 | -3.0 | |||||||||||||||||
| Total | 2,101 | 2,297 | -196 | -196 | 2,487 | -15.5 | 2,219 | -5.3 | |||||||||||||||||
| Totals may not equal sum of components because of independent rounding. | |||||||||||||||||||||||||
Working gas in storage was 2,101 Bcf as of Friday, February 14, 2025, according to EIA estimates. This represents a net decrease of 196 Bcf from the previous week. Stocks were 386 Bcf less than last year at this time and 118 Bcf below the five-year average of 2,219 Bcf. At 2,101 Bcf, total working gas is within the five-year historical range.
For information on sampling error in this report, see Estimated Measures of Sampling Variability table below.
Note: The shaded area indicates the range between the historical minimum and maximum values for the weekly series from 2020 through 2024. The dashed vertical lines indicate current and year-ago weekly periods.
+++++++++++++++++++++
I'm not sure if this is part of why we're -$2,000/contract but the overnight GEFS looks like the cross polar flow may get undercut by Pacific flow.
Hey, Larry,
I've been tied up on other things and just compared the latest GEFS and EE for the first time since our discussion on the difference early in the period.
Its exactly what you noted. The EE HDDs are all a bit colder/greater on the first few days. Good catch by you. So there must be a reason!
It appears to include the actual measurement/initial conditions that are the starting point which one would think would line up exactly the same.
All models have some bias for different parameters based on innate flaws in the equations, which tend to grow with time. The numerous ensemble members, averaged together help a great deal to provide a product that give greater weighting to the solutions which display similarities and average out extremes/outliers based on a bias in that model solution because of an flawed equation.
But this is right out of the box and always in the same colder EE direction.
+++++++++
You'll like this one!
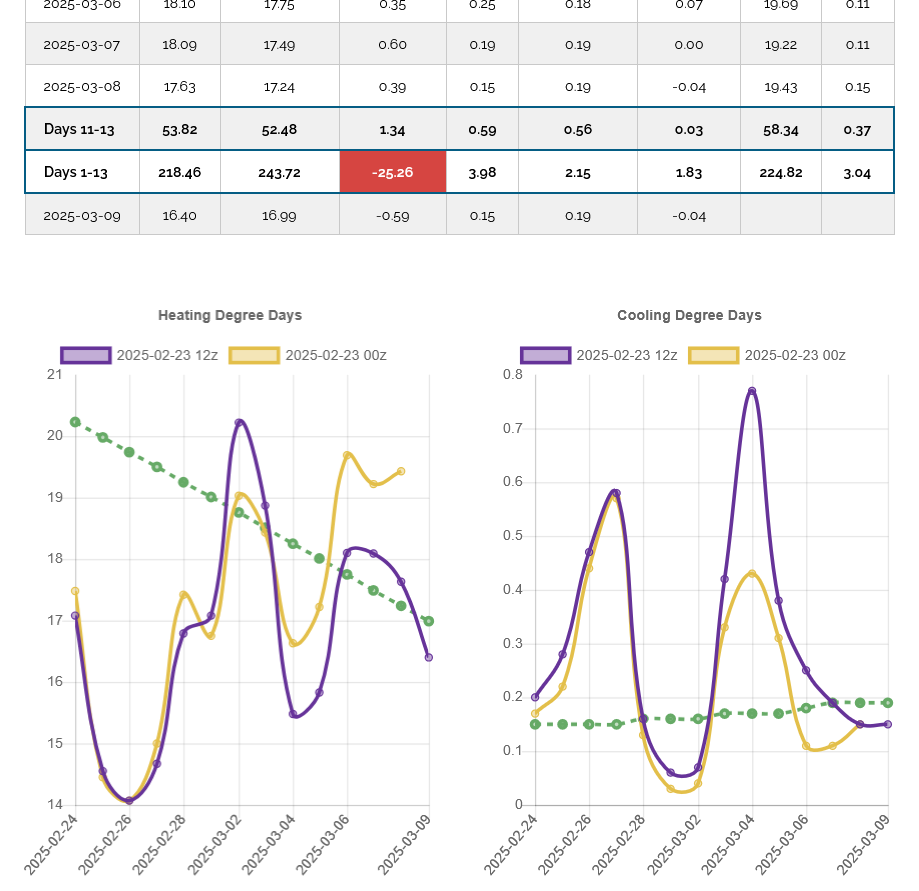
I decided to compare the Operational European model to the Operational GFS and the colder difference was even MORE amplified. See for yourself below.
1. 12z GFS in purple
2. 12z European mode HDDs in purple/left- high than GFS early on. But LOWER CDDs for the same initial periods. Graph on the right. This would be consistent with the overall COLDER output of products that is uniformly applied at all temperatures.
One would think that they could agree, almost exactly to the observed/measured temperatures. What do you think?
I don't know if there will be a site that explains this specific bias we are discussing, Larry but there are some good discussions on this great topic!
Bias Removal and Model Consensus Forecasts of Maximum and
Minimum Temperatures Using the Graphical Forecast Editor
Jeffrey T. D
https://www.weather.gov/media/wrh/online_publications/TAs/ta0410.pdf
This is about climate models below which are a different animal than weather models:
(In Global Climate Models, we trust?)
An Introduction to Trusting Global Climate Models and Bias Correction
Omar C. Gates & Richard B. Rood
https://glisa.umich.edu/wp-content/uploads/2021/03/Global-Climate-Model-Bias-and-Bias-Correction.pdf
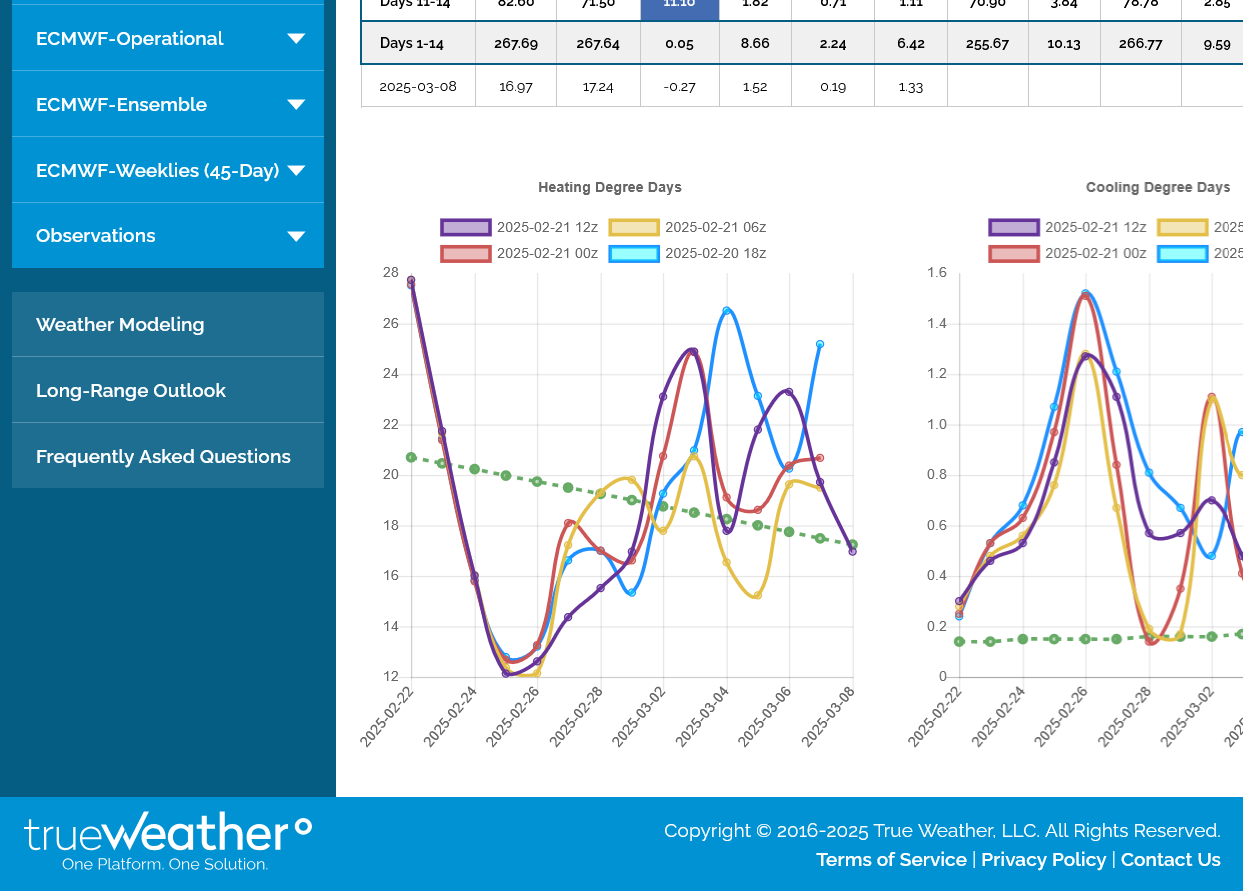
Gap lower coming on the open!
update 5:10 pm: April is already more than double the expiring March contract. Trade that one.
We got the expected gap lower.
This one looks very much like a significant downside breakaway gap based on where its coming from and how much milder the weather pattern looks towards the end of the 2 week period. Last 12z European Ensemble HDDs in purple/left -4 HDDs.
This is the FRONT month.
https://tradingeconomics.com/commodity/natural-gas
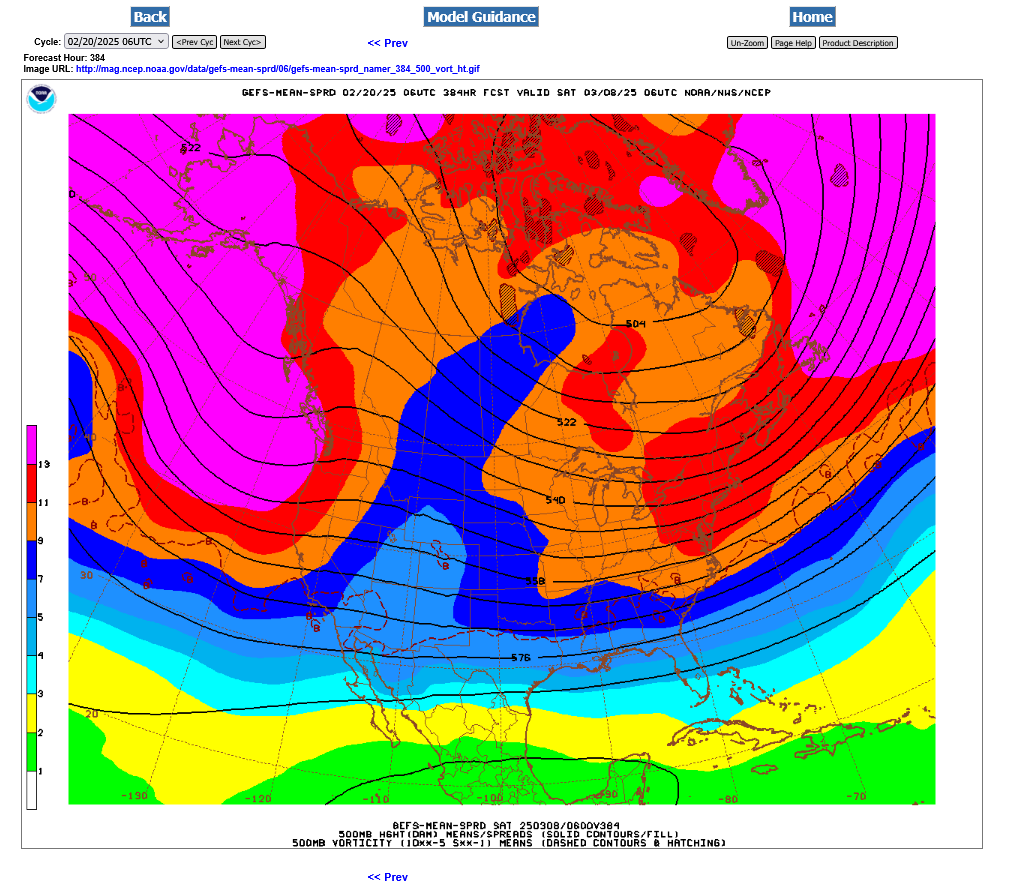
+++++++++++
Cross polar flow completely undercut by mild Pacific flow! 12z GEFS below at 384 hours.
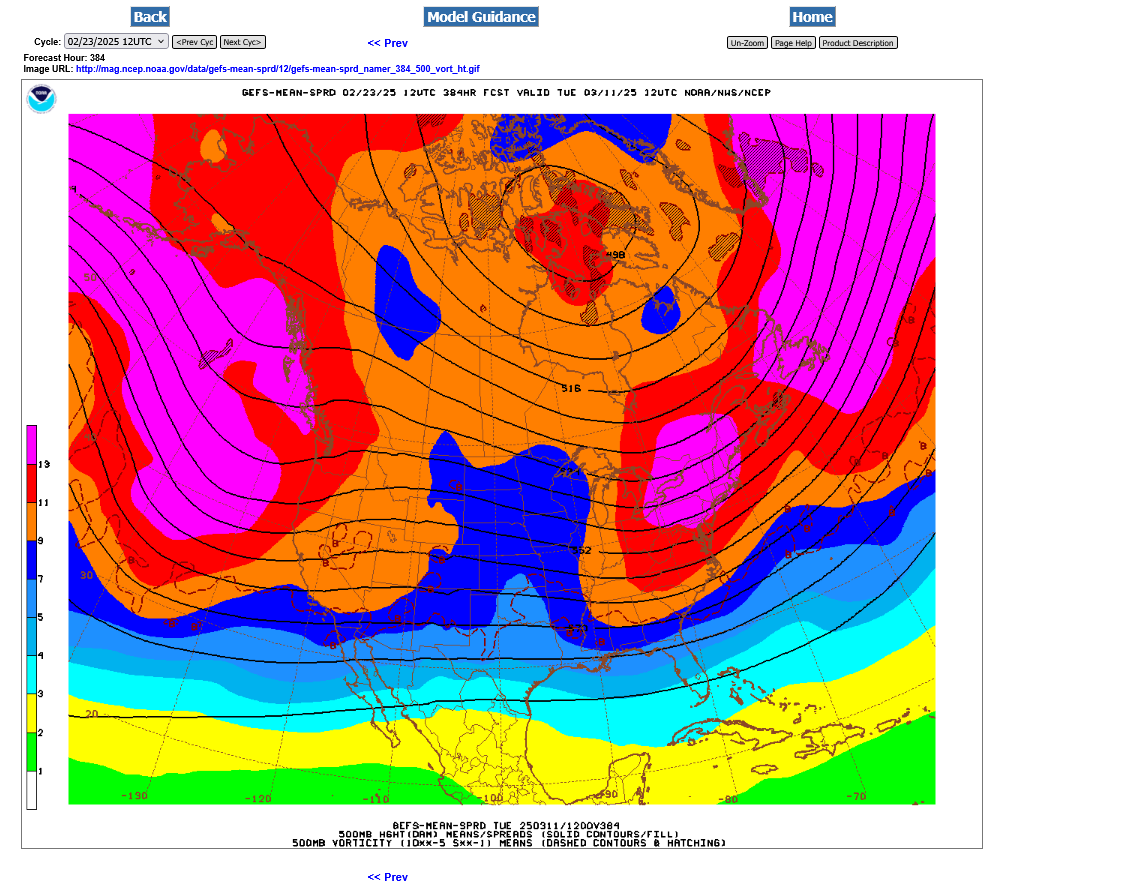
Hey Mike et al, I started a new NG thread just now here: