KEY EVENTS TO WATCH FOR:
Friday, August 25, 2023
10:00 AM ET. August University of Michigan Survey of Consumers - final
End-Mo Sentiment Idx (expected 71.2; previous 71.6)
End-Mo Expectations Idx (previous 68.3)
12-Month Inflation Forecast (previous 3.4%)
5-Year Inflation Forecast (previous 3.0%)
End-Mo Current Idx (previous 76.6)
Monday, August 28, 2023
10:30 AM ET. August Texas Manufacturing Outlook Survey
Business Activity (previous -20.0)
Mfg Production Idx (previous -4.8)
Tuesday, August 29, 2023
8:55 AM ET. Johnson Redbook Retail Sales Index
Ret Sales Mo-to-Date, Y/Y% (previous +1.3%)
Latest Wk, Y/Y% (previous +2.9%)
9:00 AM ET. 2nd Quarter U.S. Quarterly House Price Index
9:00 AM ET. June U.S. Monthly House Price Index
9:00 AM ET. June S&P CoreLogic Case-Shiller Indices
10-City Idx, M/M% (previous +1.5%)
10-City Idx, Y/Y% (previous -1.0%)
20-City Idx, M/M% (previous +1.5%)
20-City Idx, Y/Y% (previous -1.7%)
National Idx, M/M% (previous +1.2%)
National Idx, Y/Y% (previous -0.5%)
10:00 AM ET. July Job Openings & Labor Turnover Survey
10:00 AM ET. August Consumer Confidence Index
Cons Conf Idx (previous 117.0)
Expectation Idx (previous 88.3)
Present Situation Idx (previous 160)
4:30 PM ET. API Weekly Statistical Bulletin
Crude Stocks, Net Chg (Bbls) (previous -2.4M)
Gasoline Stocks, Net Chg (Bbls) (previous +1.9M)
Distillate Stocks, Net Chg (Bbls) (previous -0.2M)
The STOCK INDEXES? http://quotes.ino.com/ex?changes/?c=indexes
The STOCK INDEXES: The September NASDAQ 100 was higher overnight as it consolidates some of Thursday's huge key reversal down. Overnight trading sets the stage a higher opening when the day session begins trading. Stochastics and the RSI are neutral to bearish signaling that sideways to lower prices are possible near-term. If September renews the decline off July's high, the June 8th low crossing at 14,425.00 is the next downside target. Closes above the 50-day moving average crossing at 15,326.91 would signal that a short-term low has been posted. First resistance is the 50-day moving average crossing at 15,326.91. Second resistance is the July 17th high crossing at 15,917.00. First support is the 25% retracement level of the 2022-2023 rally crossing at 14,789.53. Second support is the June 8th low crossing at 14,425.00.
The September S&P 500 was higher overnight as it consolidates some of Thursday's key reversal down. Overnight trading sets the stage for a higher opening when the day session begins trading. Stochastics and the RSI are neutral to bullish signaling that sideways to higher prices are possible near-term. Closes above the 50-day moving average crossing at 4487.21 would signal that a short-term low has been posted. If September renews the decline off July's high, the 38% retracement level of the March-July rally crossing at 4344.68 is the next downside target. First resistance is the 50-day moving average crossing at 4487.21. Second resistance is the August 10th high crossing at 4544.75. First support is the 38% retracement level of the March-July rally crossing at 4344.68. Second support is the June 8th low crossing at 4305.75.
INTEREST RATES http://quotes.ino.com/ex changes/?c=interest"
INTEREST RATES: September T-bonds were steady to lower overnight as it consolidates some of the rally off Tuesday's low. Overnight trading sets the stage for a steady to slightly lower opening when the day session begins trading. Stochastics and the RSI are neutral to bullish signaling that sideways to higher prices are possible near-term. Closes above the 20-day moving average crossing at 120-24 would signal that a low has been posted. If September renews the decline off July's high, the February-2011 low on the monthly continuation chart crossing at 116-26 is the next downside target.First resistance is the 20-day moving average crossing at 120-24. Second resistance is the August 10th high crossing at 123-22. First support is Tuesday's low crossing at 117-18. Second support is the February-2011 low on the weekly continuation chart crossing at 116-26.
September T-notes was slightly lower overnight and sets the stage for a slightly lower opening when the day session begins trading. Stochastics and the RSI are oversold, diverging but are turning neutral to bullish signaling that sideways to higher prices are possible near-term. Closes above the 20-day moving average crossing at 110.077 would signal that a short-term low has been posted. If September extends the decline off July's high, the October-2022 low crossing at 108.265 is the next downside target. First resistance is the 20-day moving average crossing at 110.077. Second resistance is the 50-day moving average crossing at 111.149. First support is Tuesday's low crossing at 108.280. Second support is the October-2022 low on the weekly continuation chart crossing at 108.265.
ENERGY MARKETS? http://quotes.ino.com/ex?changes/?c=energy ""
ENERGIES:Octobercrude oil was higher overnight as it consolidates some of the decline off August's high. Overnight trading sets the stage for a higher opening when the day session begins trading. Stochastics and the RSI are diverging but are turning neutral to bullish signaling that sideways to higher prices are still possible near-term. Closes above the 20-day moving average crossing at $80.84 would signal that a short-term low has been posted. If October extends the decline off August's high, the 38% retracement level of the May-August rally crossing at $76.68 is the next downside target. First resistance is Monday's high crossing at $81.75. Second resistance is August's high crossing at $84.16. First support is Wednesday's low crossing at $77.62. Second support is the 38% retracement level of the May-August rally crossing at $76.68.
October heating oil was higher overnight and poised to resume the rally off May's low. Overnight trading sets the stage for a higher opening when the day session begins trading. Stochastics and the RSI are bullish signaling that sideways to higher prices are possible near-term. If October renews the rally off May's low, the June-2022 crossing at 3.2100 is the next upside target. Closes below last-Thursday's low crossing at 2.9822 would signal that a short-term top has been posted. First resistance is August's high crossing at 3.1928. Second resistance is the June-2022 high crossing at 3.2100. First support is last-Thursday's low crossing at 2.9822. Second support is the August 8th low crossing at 2.9174.
October unleaded gas was higher overnight as it consolidates some of the decline off August's high. Overnight trading sets the stage for a higher opening when the day session begins trading. Stochastics and the RSI are turning neutral to bullish signaling that sideways to higher prices are possible near-term. Closes above the 20-day moving average crossing at 2.6016 would signal that a short-term low has been posted. If October extends the decline off August's high, the August 3rd low crossing at 2.4847 is the next downside target. First resistance is the August 11th high crossing at $2.7209. Second resistance is the October-2022 high on the weekly continuation chart crossing at $3.0221. First support is August 3rd low crossing at $2.4847. Second support is the 50-day moving average crossing at $2.4343.
October natural gas was slightly higher overnight and sets the stage for a slightly higher opening when the day session begins trading. Stochastics and the RSI are oversold but remain neutral to bearish signaling that sideways to lower prices are possible near-term. If October extends the decline off August's high, June's low crossing at 2.377 is the next downside target. Closes above the 50-day moving average crossing at 2.752 would signal that a short-term low has been posted. First resistance is the 50-day moving average crossing at 2.752. Second resistance is the August 9th high crossing at 3.096. First support is Thursday's low crossing at 2.529. Second support is June's low crossing at 2.377.
CURRENCIEShttp://quotes.ino.com/ex changes/?c=currencies"
CURRENCIES:The September Dollar gapped up and was higher overnight as it extends the rally off July's low. Overnight trading sets the stage for a higher opening when the day session begins trading later this morning. Stochastics and the RSI are overbought but remain neutral to bullish signaling that sideways to higher prices are possible near-term. If September extends the rally off July's low, March's high crossing at $105.000 is the next upside target. Closes below the 20-day moving average crossing at $102.802 would signal that a short-term top has been posted. First resistance is May's high crossing at $104.205. Second resistance is March's high crossing at $105.000. First support is the 10-day moving average crossing at $103.418. Second support is the 20-day moving average crossing at $102.802.
The September Euro was lower overnight as it extends the decline off July's high. Overnight weakness sets the stage for a lower opening when the day session begins trading. Stochastics and the RSI are oversold but remain neutral to bearish signaling that sideways to lower prices are possible near-term. If September extends the decline off July's high, May's low crossing at 1.07025 is the next downside target. Closes above the 20-day moving average crossing at $1.09382 would confirm that a short-term low has been posted. First resistance is the 20-day moving average crossing at $1.09382. Second resistance is the 50-day moving average crossing at $1.10102. First support is the June 12th low crossing at 1.07920. Second support is May's low crossing at 1.07025.
The September British Pound was lower overnight as it extends Thursday's downside breakout of August's trading range. Overnight weakness sets the stage for a lower opening when the day session begins trading. Stochastics and the RSI are bearish signaling that sideways to lower prices near-term. If September extends the decline off July's high, the 50% retracement level of the March-July rally crossing at 1.2508 is the next downside target. Closes above the 50-day moving average crossing at 1.2795 would confirm that a short-term low has been posted. First resistance the 20-day moving average crossing at 1.2724. Second resistance is the 50-day moving average crossing at 1.2795. First support is the overnight low crossing at 1.2561. Second support is the 50% retracement level of the March-July rally crossing at 1.2508.
The September Swiss Franc was lower overnight as it extends Thursday's downside breakout of the trading range of the past two-weeks. Overnight trading sets the stage for a lower opening when the day session begins trading. Stochastics and the RSI remain neutral to bearish signaling that sideways to lower prices are possible near-term. If September extends the decline off July's high, the March-June uptrend line crossing near 1.12876 is the next downside target. If this uptrend line is broken, the door would be open the door for a possible test of the June 30th low crossing at 1.11790. Closes above the 50-day moving average crossing at 1.14396 would signal that a short-term low has been posted. First resistance is the 50-day moving average crossing at 1.14396. Second resistance is the August 10th high crossing at 1.15535. First support is the March-June uptrend line crossing near 1.12876. Second support is the June 30th low crossing at 1.11790.
The September Canadian Dollar was slightly lower overnight and sets the stage for a slightly lower opening when the day session begins trading. Stochastics and the RSI are oversold but remain neutral to bearish signaling that sideways to lower prices are possible near-term. If September extends the decline off July's high, the 75% retracement level of the March-July rally crossing at $73.49 is the next downside target. Closes above the 20-day moving average crossing at $74.39 would signal that a short-term low has been posted. First resistance is the 10-day moving average crossing at $73.89. Second resistance is the 20-day moving average crossing at $74.39. First support is the 75% retracement level of the March-July rally crossing at $73.49. Second support is the 87% retracement level of the March-July rally crossing at crossing at $73.02.
The September Japanese Yen was slightly lower overnight as it extends the trading range of the past seven-days. Overnight weakness sets the stage for a slightly lower opening when the day session begins trading. Stochastics and the RSI are oversold but remain neutral to bearish signaling that sideways to lower prices are possible near-term. If September extends the decline off the July 14th high, the October-2022 low on the weekly continuation chart crossing at 0.066235 is the next downside target. Closes above the 20-day moving average crossing at 0.069593 would signal that a short-term low has been posted. First resistance is the 20-day moving average crossing at 0.069593. Second resistance is the 50-day moving average crossing at 0.070692. First support is last-Thursday's low crossing at 0.068545. Second support is the October-2022 low on the weekly continuation chart crossing at 0.066235.
PRECIOUS METALS http://quotes.ino.com/ex changes/?c=metals"
Precious Metals: December gold was slightly lower overnight and sets the stage for a slightly lower opening when the day session begins trading later this morning. Stochastics and the RSI are neutral to bullish signaling that sideways to higher prices are possible near-term. Closes above the 20-day moving average crossing at $1950.60 would confirm that a short-term low has been posted. If October renews the decline off July's high, February's low crossing at $1883.80 is the next downside target. First resistance is the 20-day moving average crossing at $1950.60. Second resistance is the 50-day moving average crossing at $192.30. First support is the 50% retracement level of the 2022-2023 rally crossing at $1919.90. Second support is February's low crossing at $1883.80.
September silver was steady to slightly higher overnight. Overnight trading sets the stage for a slightly higher opening when the day session begins trading later this morning. Stochastics and the RSI are overbought but remain neutral to bullish signaling that sideways to higher prices are possible near-term. If September extends the rally off August's low, the July 31st high crossing at 24.985 is the next upside target. Closes below the 10-day moving average crossing at $23.300 would signal that a short-term top has been posted. First resistance is the July 31 high crossing at $24.985. Second resistance is the July 27th high crossing at 25.325. First support is the 50-day moving average crossing at $23.713. Second support is the 20-day moving average crossing at $23.396.
September copper was higher overnight and sets the stage for a higher opening when the day session begins trading. Stochastics and the RSI remain bullish signaling that sideways to higher prices are possible near-term. Closes above the 50-day moving average crossing at 3.8157 would confirm that a short-term low has been posted while opening the door for additional short-term gains. If September renews this month's decline, May's low crossing at 3.5650 is the next downside target. First resistance is the 50-day moving average crossing at 3.8157. Second resistance is the August 4th high crossing at 3.9280. First support is last-Thursday's low crossing at 3.6270. Second support is May's low crossing at 3.5650.
GRAINS http://quotes.ino.com/ex changes/?c=grains
Grains: December corn was lower overnight as the market awaits Pro-Farmer's final corn and soybean crop estimates for 2023 to be released. Overnight trading sets the stage for a lower opening when the day sessions begins trading. Stochastics and the RSI are neutral to bullish signaling that sideways to higher prices are possible near-term. Closes above the August 11th high crossing at $5.07 1/2 would signal that a short-term low has been posted. If December renews the decline off July's high, the 75% retracement level of the 2020-2022 rally crossing at $4.50 3/4 is the next downside target. First resistance is the August 11th high crossing at $5.07 1/2. Second resistance is the 50-day moving average crossing at $5.21 1/4. First support is last-Wednesday's low crossing at $4.73 1/2. Second support is the 75% retracement level of the 2020-2022 rally crossing at $4.50 3/4.
December wheat was slightly higher in quiet trading overnight. Overnight trading sets the stage for a higher opening when the day session begins trading. Stochastics and the RSI are turning neutral to bullish signaling that sideways to higher prices are possible near-term. Closes above the 20-day moving average crossing at $6.49 3/4 would signal that a short-term low has been posted. If December resumes the decline off July's high, May's low crossing at $6.08 1/4 is the next downside target. First resistance is the 20-day moving average crossing at $6.49 3/4. Second resistance is the 50-day moving average crossing at $6.85 3/4. First support is last-Thursday's low crossing at $6.12. Second support is May's low crossing at $6.08 1/4.
December Kansas City wheat was higher overnight as it extends the trading range of the past two-weeks. Overnight trading sets the stage for a higher opening when the day session begins trading later this morning. Stochastics and the RSI are neutral to bullish signaling that sideways to higher prices are possible near-term. Closes above the 20-day moving average crossing at $7.71 1/2 would signal that a short-term low has been posted. If December resumes the decline off July's high, May's low crossing at $7.36 is the next downside target.First resistance is the 20-day moving average crossing at $7.71 1/2. Second resistance is the 50-day moving average crossing at $8.15 1/4. First support is last-Wednesday's low crossing at $7.39. Second support is May's low crossing at $7.36.
December Minneapolis wheat was higher overnight and sets the stage for a higher opening when the day session begins trading. Stochastics and the RSI are oversold but remain neutral to bearish signaling that sideways to lower prices are possible near-term. If December extends the decline off July's high, the May 31st low crossing at $7.85 3/4 is the next downside target. Closes above the 20-day moving average crossing at $8.25 3/4 would signal that a low has been posted. First resistance is the 20-day moving average crossing at $8.25 3/4. Second resistance is the 50-day moving average crossing at $8.55 3/4. First support is the May 31st low crossing at $7.85 3/4. May's low crossing at $7.80 1/2.
SOYBEAN COMPLEX? http://quotes.ino.com/ex?changes/?c=grains "
November soybeans was higher overnight and sets the stage for a higher opening when the day session begins trading later this morning. Stochastics and the RSI are becoming overbought but remain neutral to bullish signaling that sideways to higher prices are possible near-term. Closes above Monday's high crossing at $13.81 would open the door for a possible test of July's low crossing at $14.35. Closes below the 20-day moving average crossing at $13.32 1/2 would signal that a short-term top has been posted. First resistance is Monday's high crossing at $13.81. Second resistance is July's high crossing at $14.35. First support is the 20-day moving average crossing at $13.32 1/2. Second support is the 50% retracement level of the May-July rally crossing at $12.82 3/4.
December soybean meal was slightly lower overnight and sets the stage for a slightly lower opening when the day session begins trading. Stochastics and the RSI are overbought but remain neutral to bullish signaling that sideways to higher prices are possible near-term. If December extends the rally off August's low, July's high crossing at $424.70 is the next upside target Closes below the 50-day moving average crossing at $394.10 would signal that a short-term top has been posted. First resistance is July's high crossing at $424.70. Second resistance is the 87% retracement level of the March-June-decline crossing at $428.00. First support is the 20-day moving average crossing at $394.10. Second support is August's low crossing at $379.00.
December soybean oil was higher in overnight trading and sets the stage for a higher opening when the day session begins trading. Stochastics and the RSI are neutral signaling that sideways trading is possible near-term. Closes below the 50-day moving average crossing at 60.27 would signal that a short-term top has been posted. If December renews the rally off May's low, last-October's high crossing at 66.44 is the next upside target. First resistance is July's high crossing at 65.58. Second resistance is last-October's high crossing at 66.44. First support is the 50-day moving average crossing at 60.27. Second support is the August 8th low crossing at 57.86.
Thanks, tallpine!
Pro Farmer comments were bullish the last 2 days, especially for beans needing rain. They release their report at 1:30pm, just after the markets close.
SX bumping up against 1381 at the moment and looking strong at +9c.
Can we get above it?
Funds will determine that
We have rain on the radar at the moment along the MN/IA border. The market could trade whether that's disappointing or not this morning?
Coverage is likely to be low with this event but convective systems like this one along the periphery of the dome can often blossom unexpectedly with such high dew points.
++++++++++++
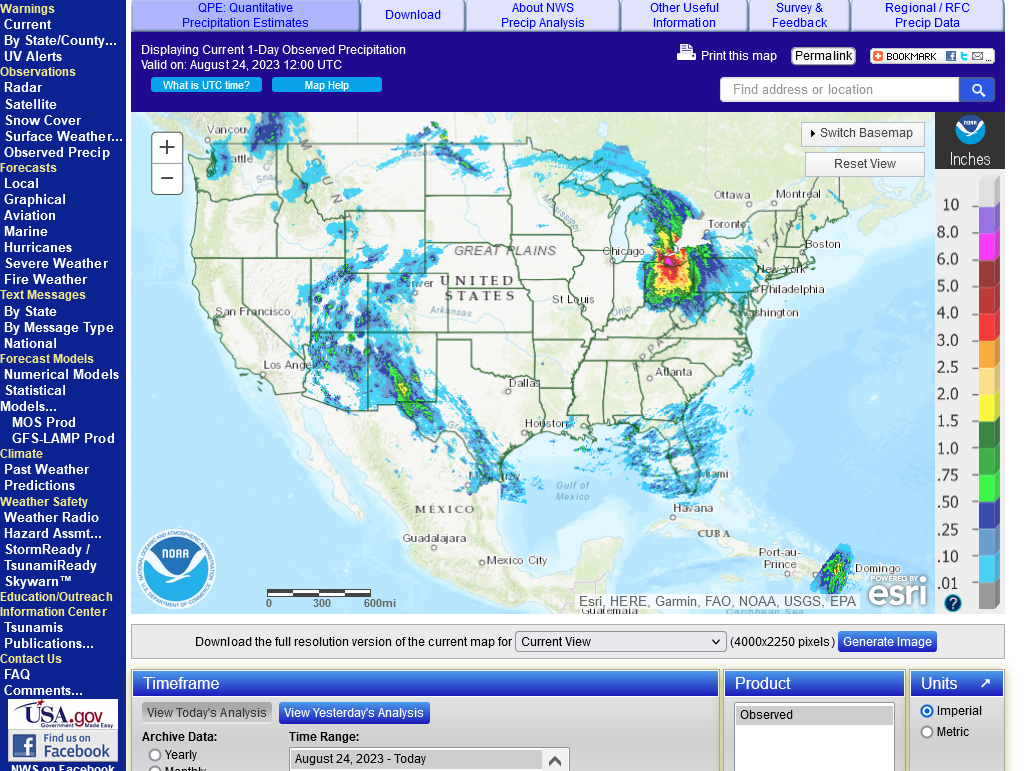
New radar product below
Go to: "Select View" then "Local Radar"
Hit the purple circle to see that local radar site
+++++++++++++++++++++++
This link below provides some great data. After going to the link, hit "Mesoanalysis" then, the center of any box for the area that you want, then go to observation on the far left, then surface observations to get constantly updated surface observations or hit another of the dozens of choices.
 Found a great new link/site that shows us how much precip fell(from 1 hr to 72 hours) for different periods to share with you. https://www.iweathernet.com/total-rainfall-map-24-hours-to-72-hours Data Update Cycle: The 1-hr mosaic is updated every 5 min (approx). All other mosaics are now updated hourly, including the 48h and 72h maps. The site does not allow me to copy the actual images/data here, as we do with all the other links above..........so just go to the link! 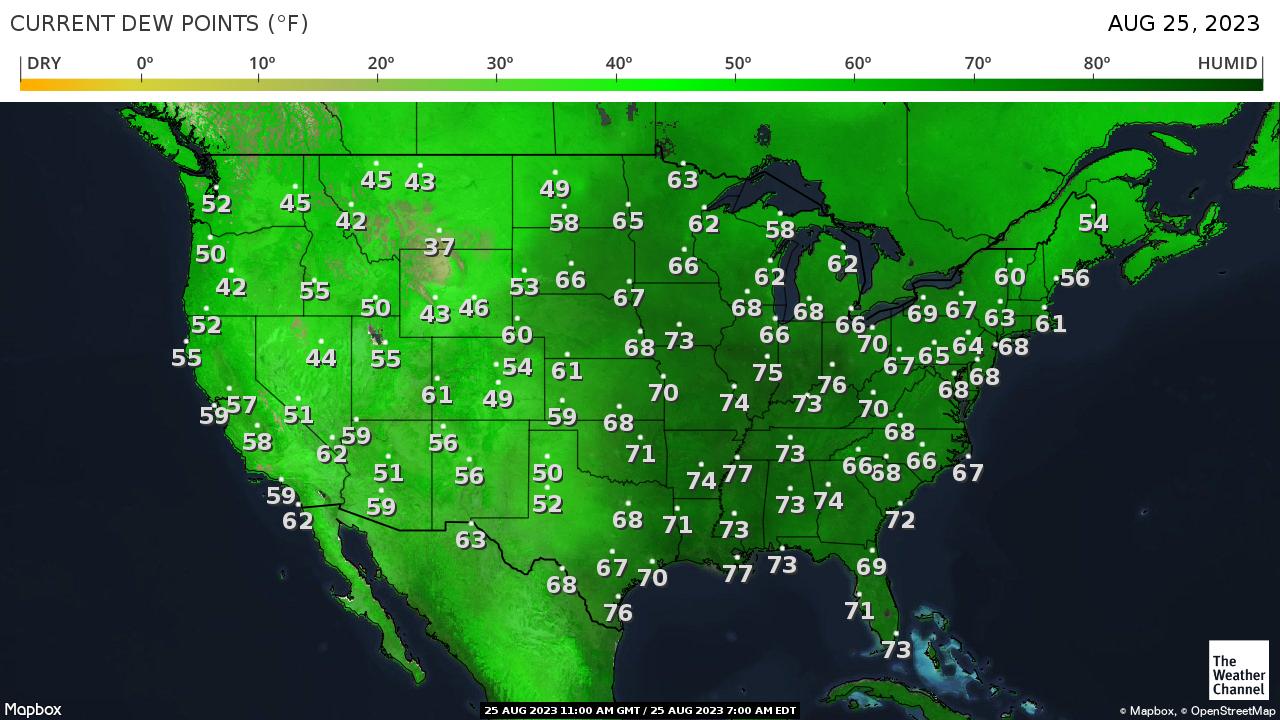 |
This isn't much rain and we need it everywhere, with deterioration expected on Monday's ratings.
After this low coverage event, not much rain expected but a sharp cool down next week, then heating up again in September.
The latest 7 day precip forecasts are below.
Day 1 below:
http://www.wpc.ncep.noaa.gov/qpf/fill_94qwbg.gif?1526306199054

Day 2 below:
http://www.wpc.ncep.noaa.gov/qpf/fill_98qwbg.gif?1528293750112

Day 3 below:
http://www.wpc.ncep.noaa.gov/qpf/fill_99qwbg.gif?1528293842764

Days 4-5 below:
http://www.wpc.ncep.noaa.gov/qpf/95ep48iwbg_fill.gif?1526306162

Days 6-7 below:
http://www.wpc.ncep.noaa.gov/qpf/97ep48iwbg_fill.gif?1526306162

7 Day Total precipitation below:
http://www.wpc.ncep.noaa.govcdx /qpf/p168i.gif?1530796126

Ohio got dumped on Wed night/early Thu!