Previous thread: https://www.marketforum.com/forum/topic/96562/
The threat of the major heat ridge building north and east and up the East Coast after day 10 is the main bullish weather today that has ng up sharply!
The West, South and East will be seeing some hot weather the next 2 weeks(mild in the Northeast). This is bullish for natural gas prices because it increases demand for electricity to use in air conditioning that's generated by burning natural gas.
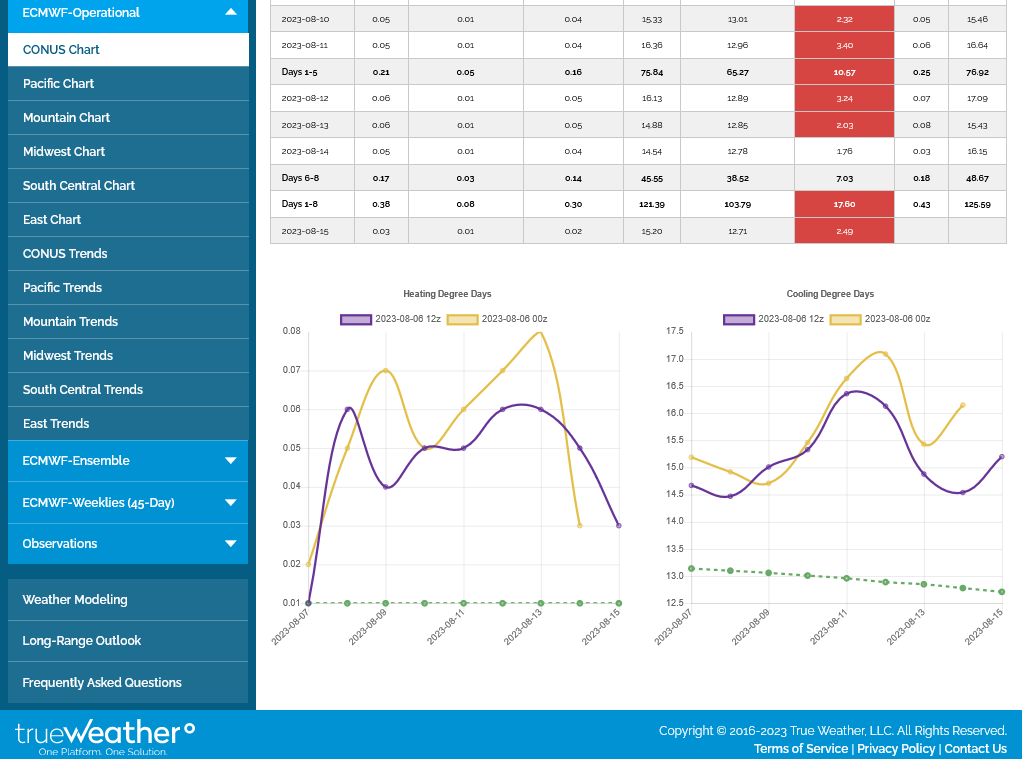
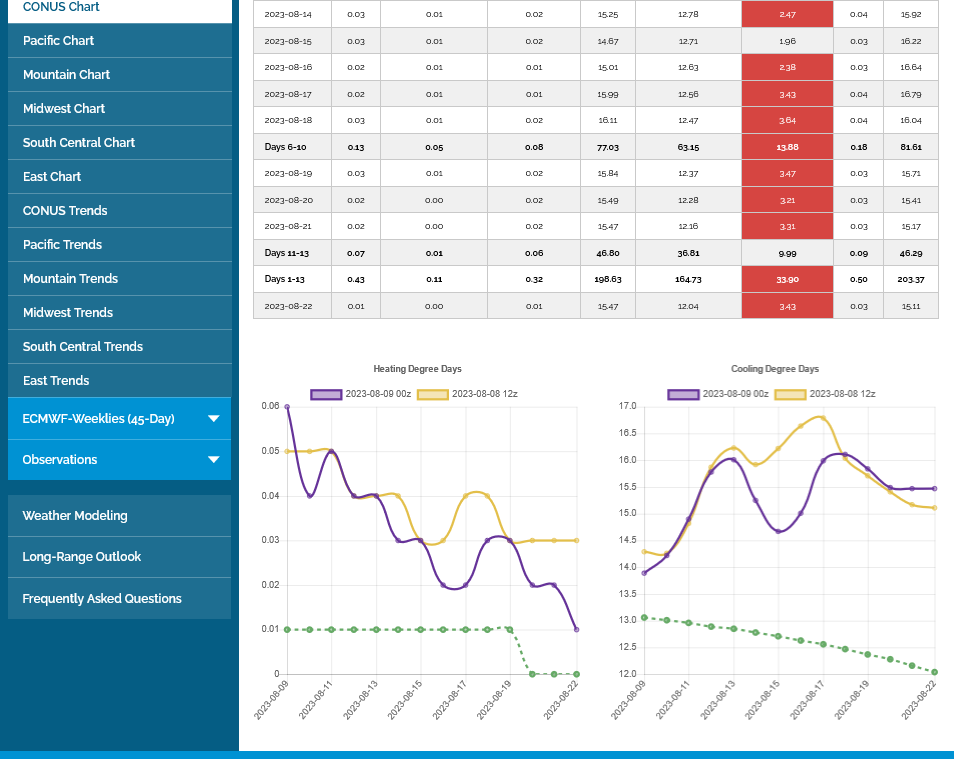
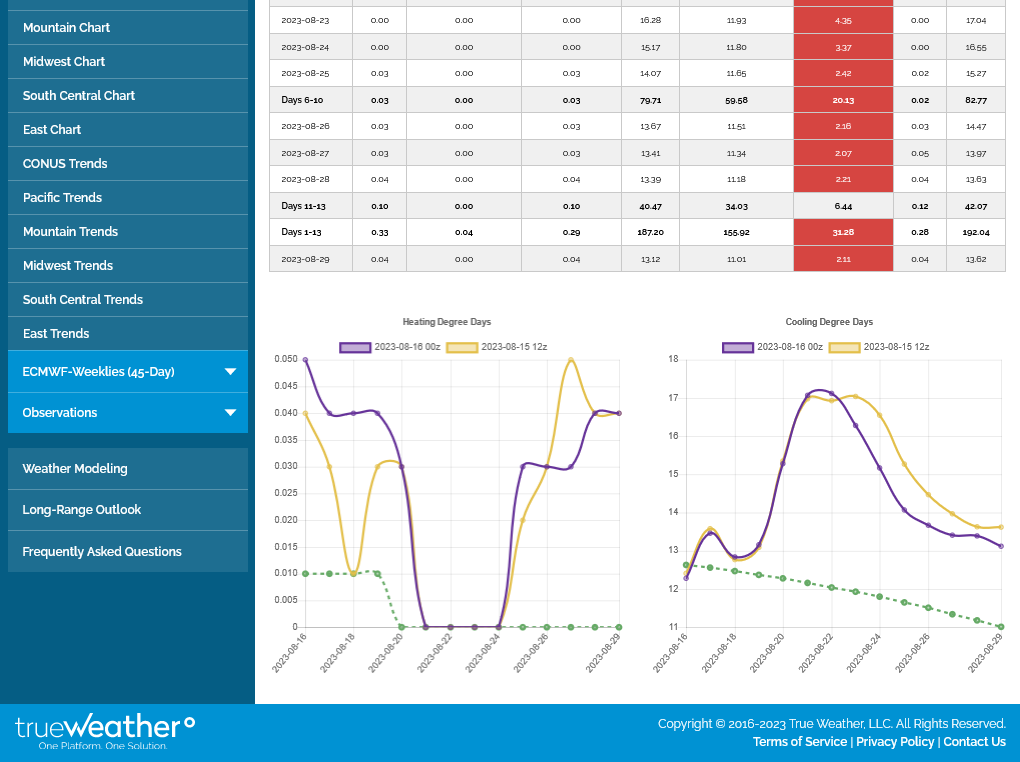
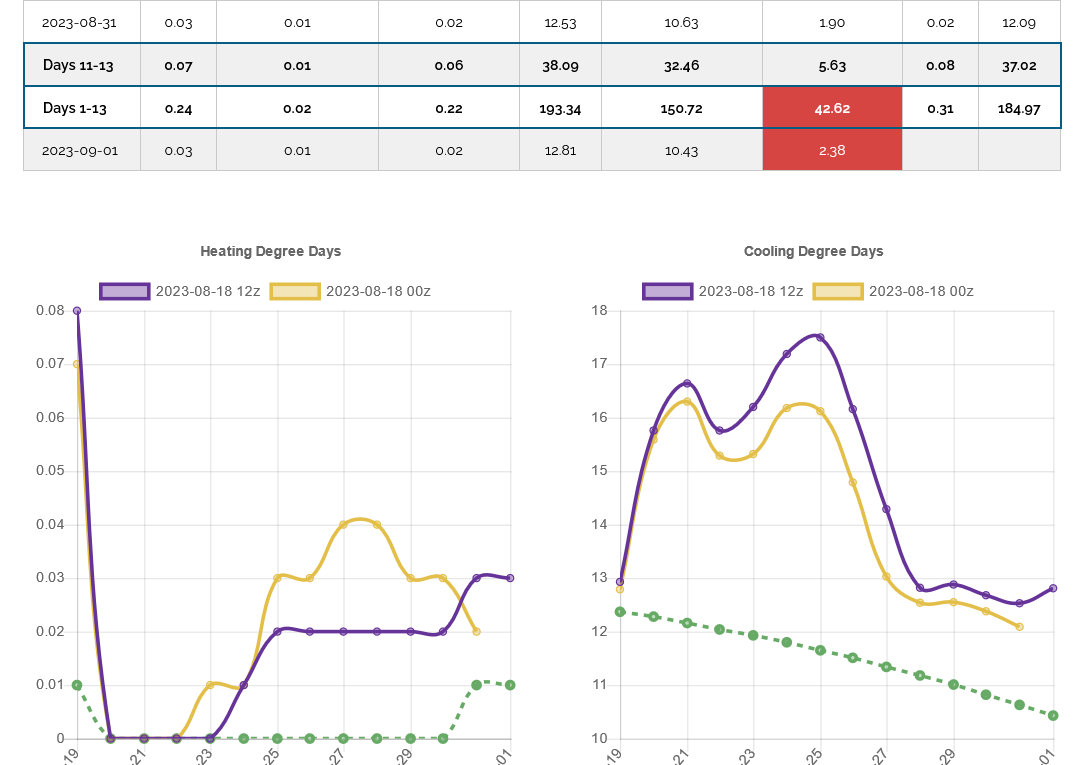
Despite the last EE being -1 CDDs(purple line on the right graph below, the pattern features well above average CDDs the next 2 weeks.
++++++++++++++
Last weeks temps for this Thursday's EIA. HOT in the middle/Plains/TX, mild in the East. Should be another smallish injection.
https://www.cpc.ncep.noaa.gov/products/tanal/temp_analyses.php
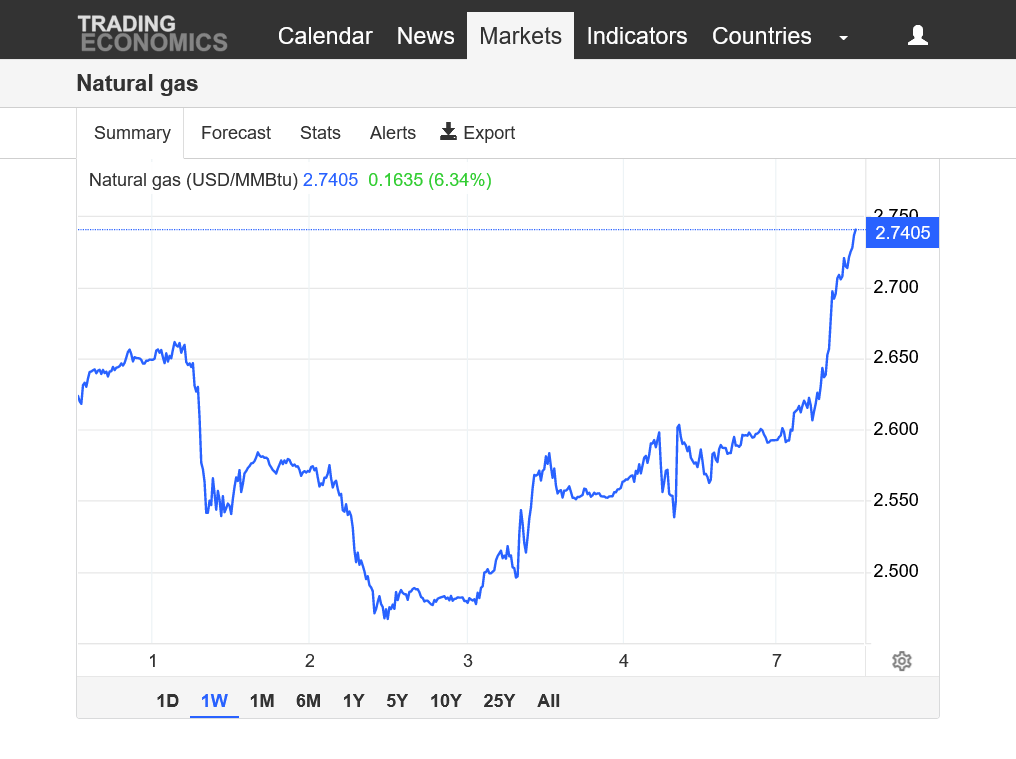
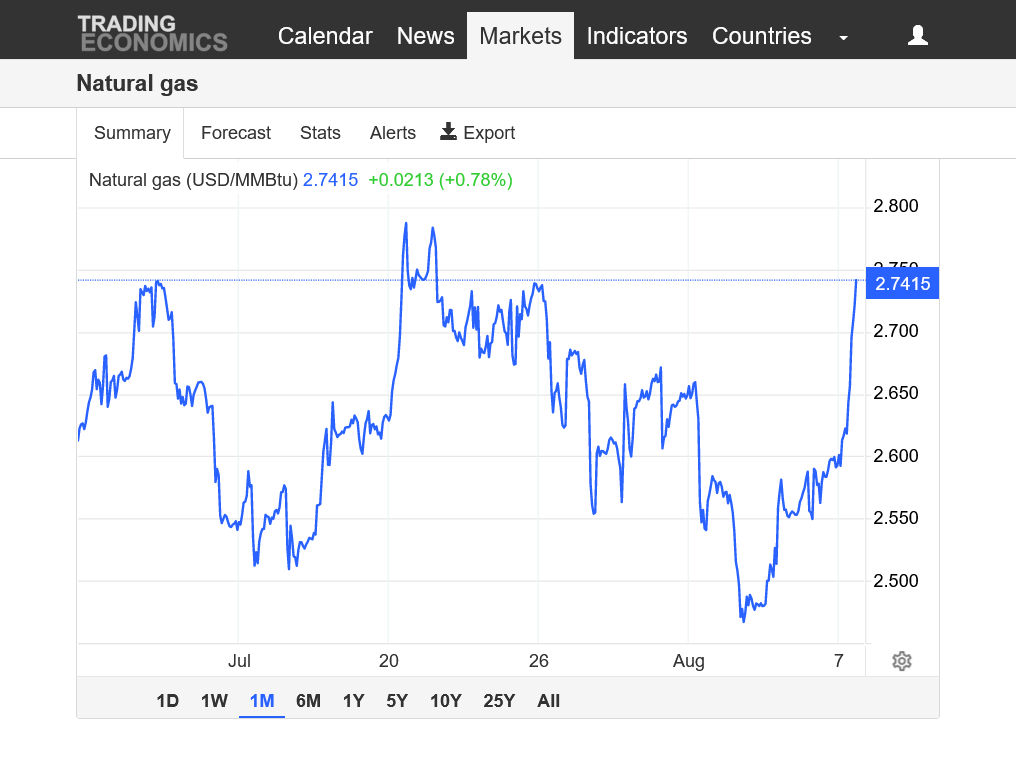
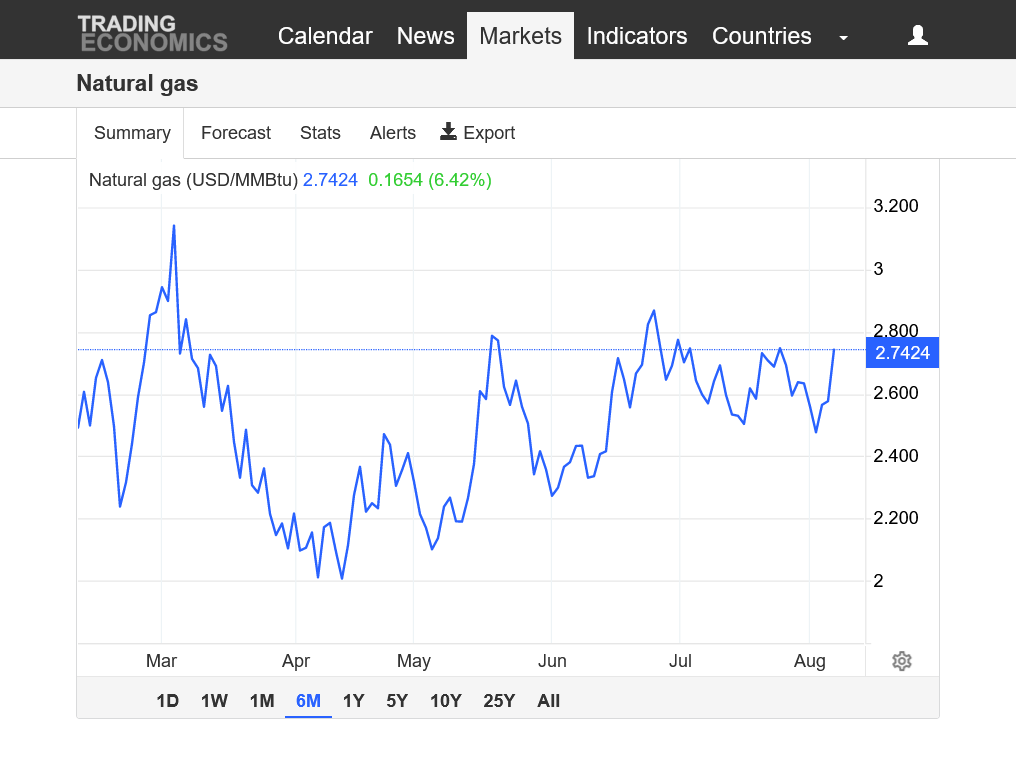
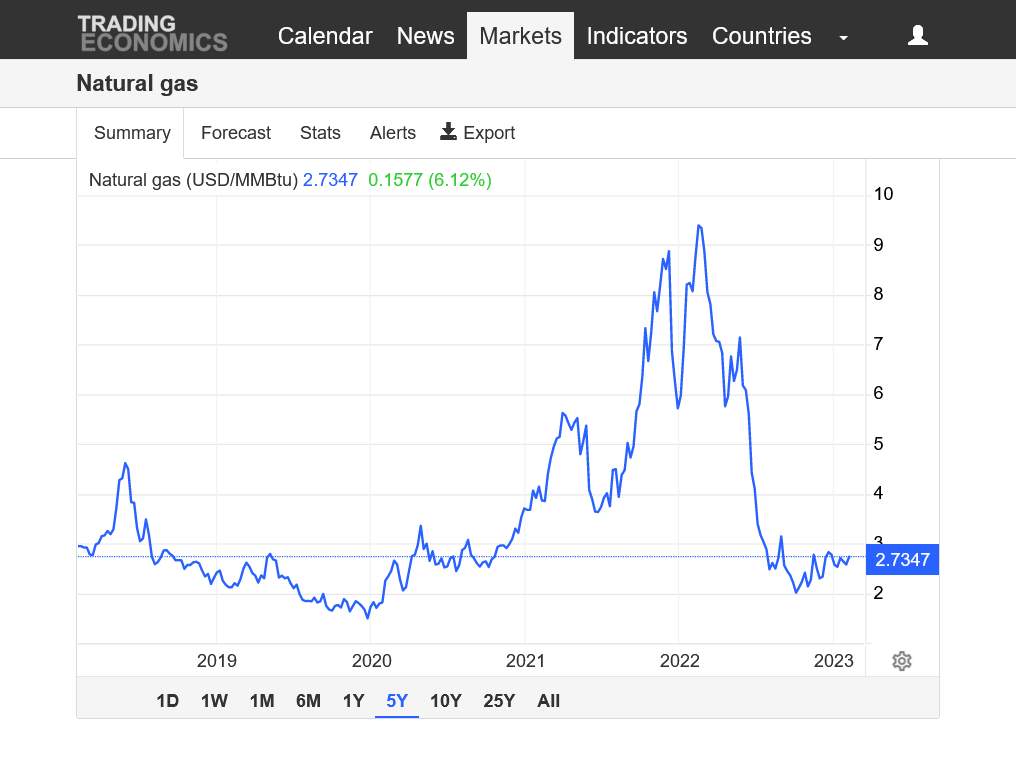
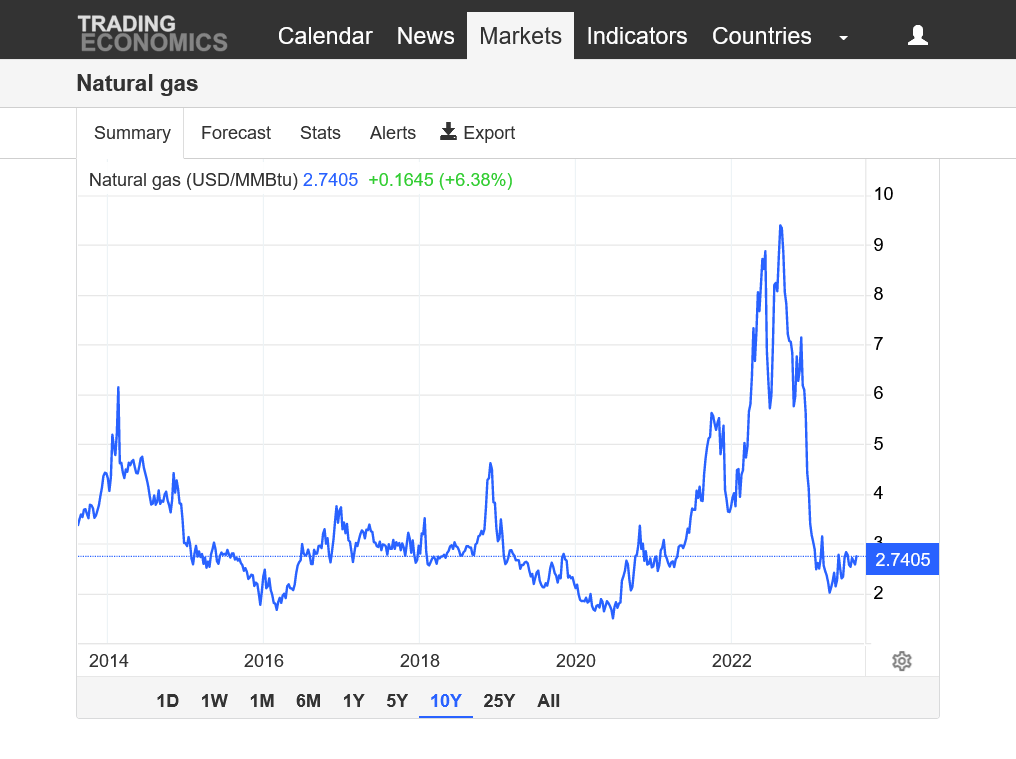
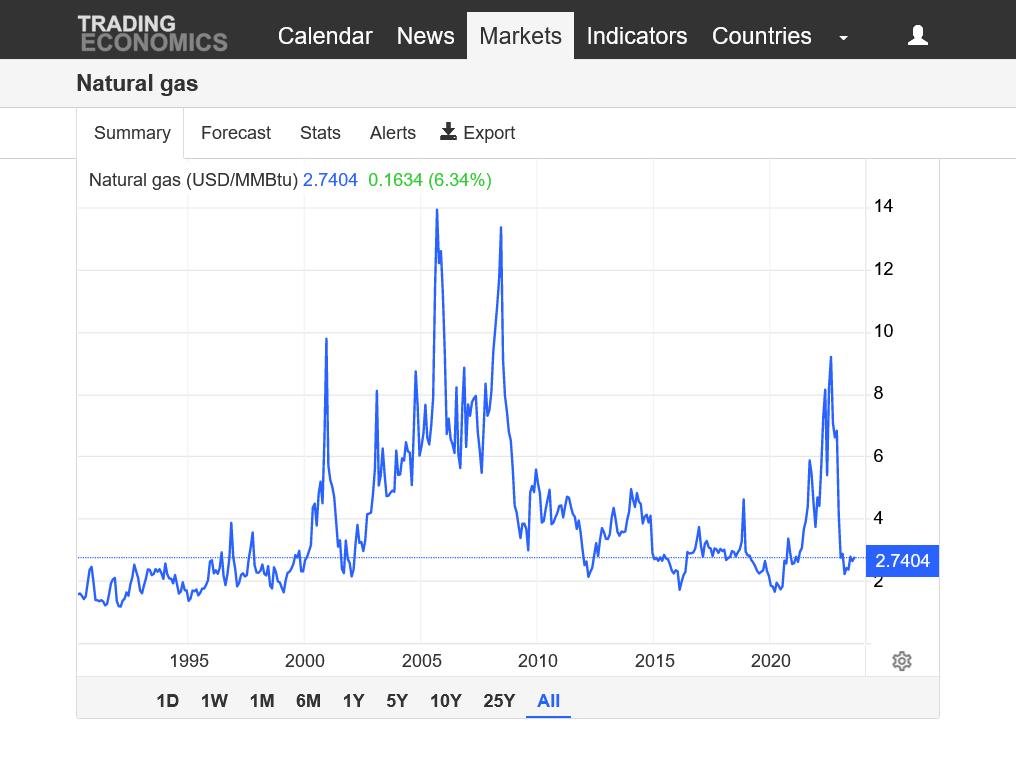
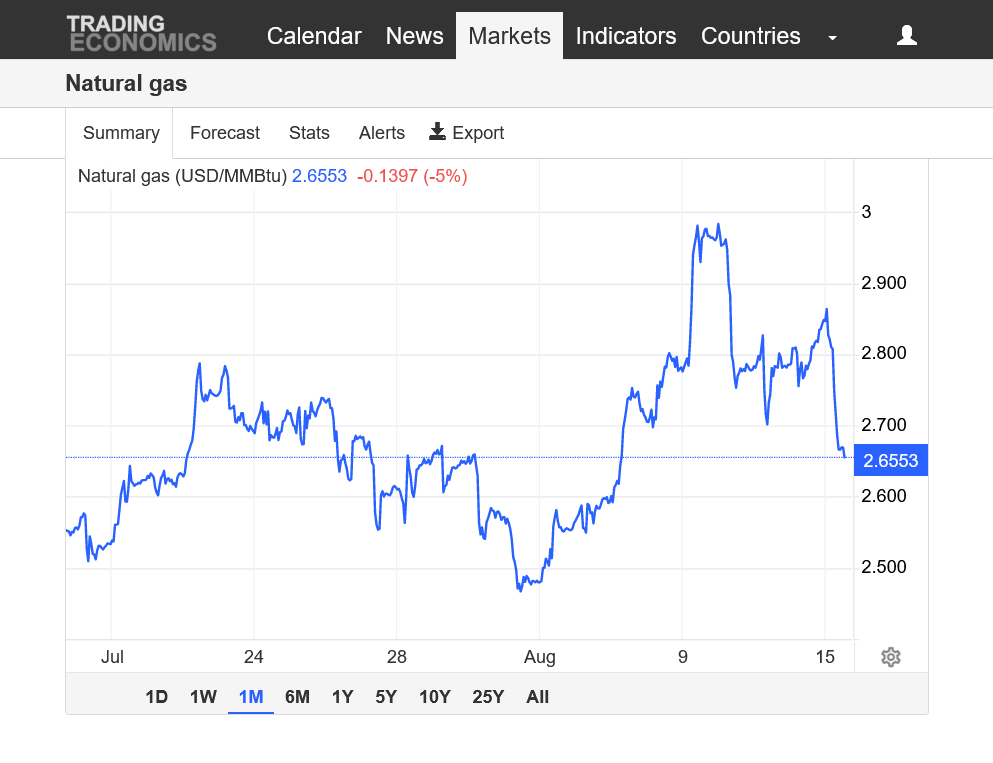
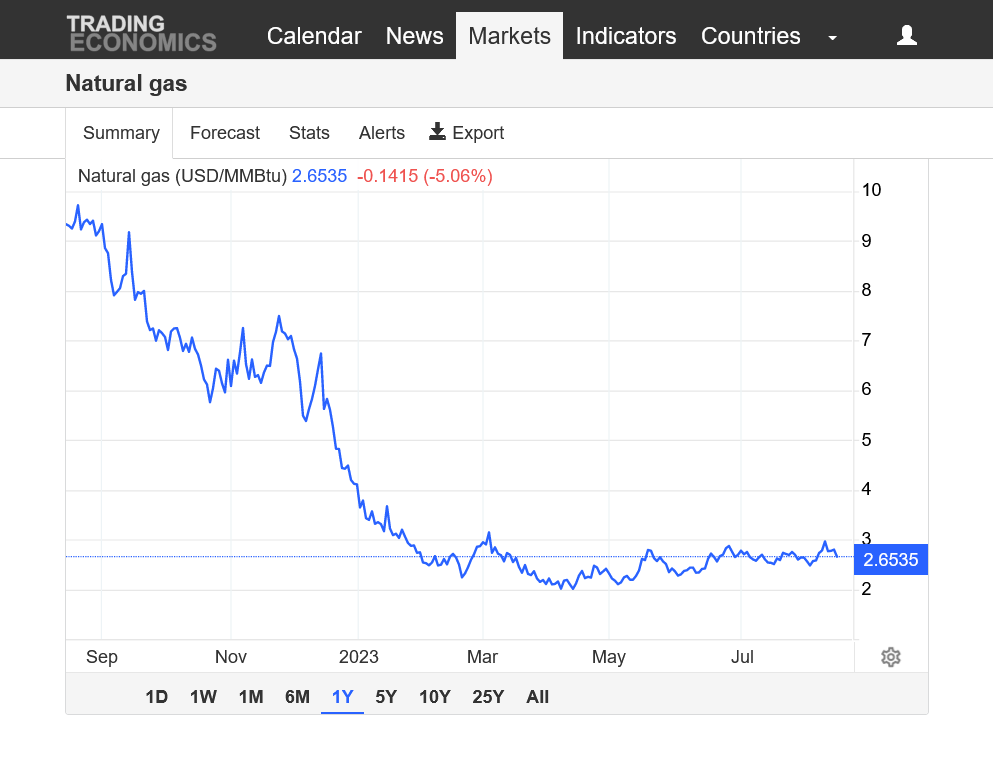
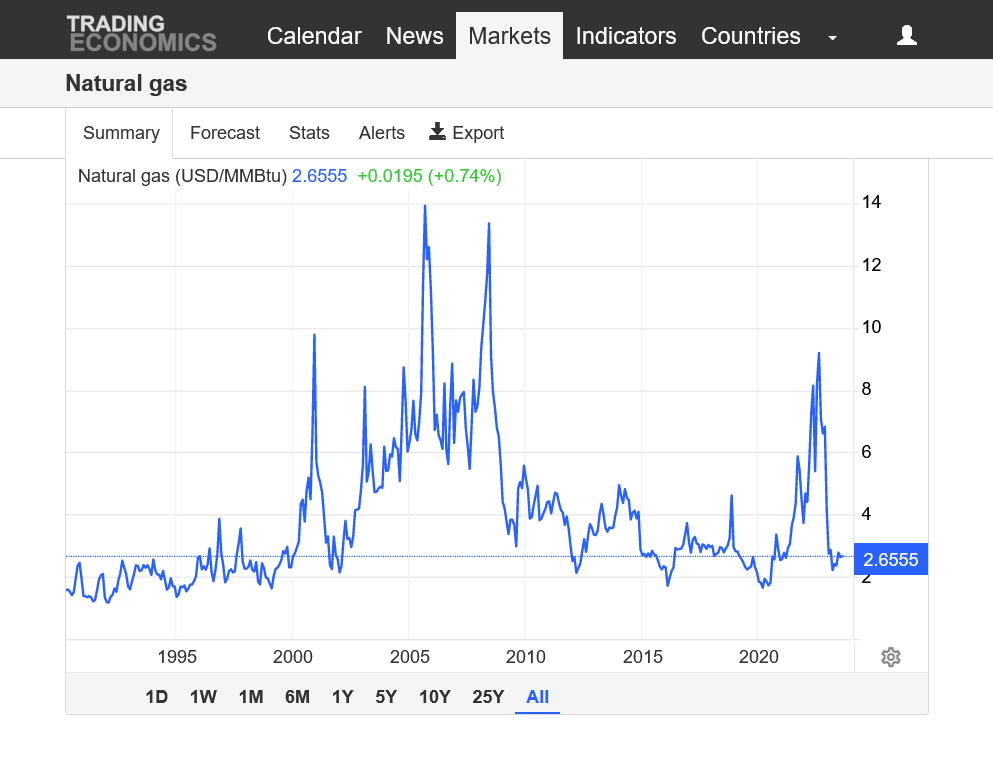
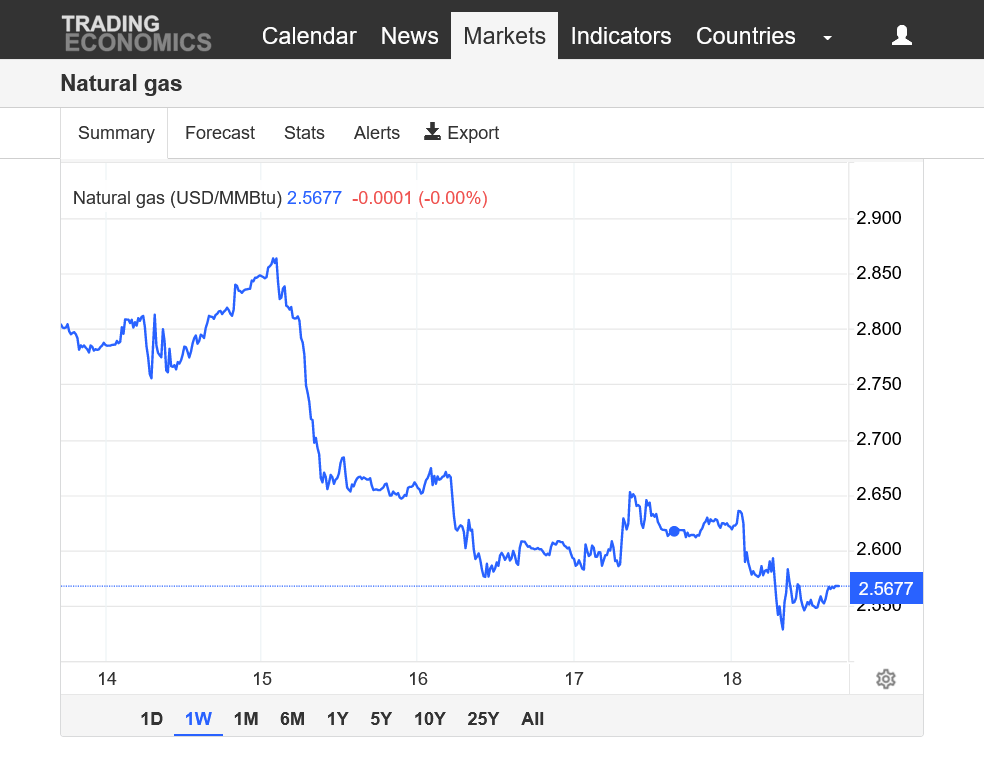
Natural gas on the verge of a majorupside break out! Definitely continuing an uptrend after the major low set earlier this year that may last for a very long time.
https://tradingeconomics.com/commodity/natural-gas
1. 1 week
2. 1 month
3. 6 months
4. 5 years
5. 10 years
6. 30 years
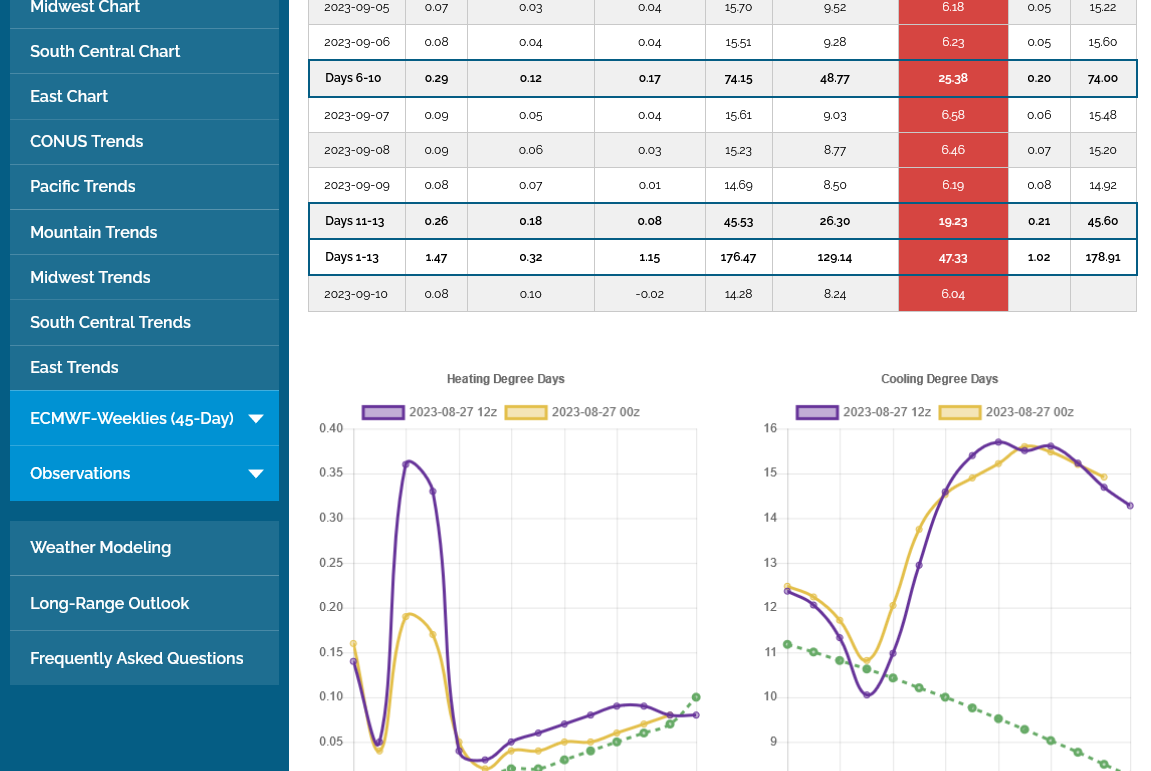
The overnight models were LESS hot but the pattern coming up is still HOT and so ng wouldn't go lower, instead it went higher anyway.
0z EE was -4 CDD's below vs the previous 12z run, on the right in purple. This is LESS bullish. Still alot of heat on the way! Look at how high the lines are compared to the dropping average, dashed green line below it!
https://www.marketforum.com/forum/topic/98086/
The models have changed a great deal overnight for the late 2 week period, confirming the change mentioned yesterday morning that the market ignored.........at first.
They have all shifted back closer to persistence............the heat ridge farther southwest and NOT in the Midwest of East, along with mostly northwest flow in the Midwest.
There is no Bermuda high/moisture pump, so rain amounts are questionable and northwest flow is always tricky.
Probably most traders today care more about the USDA report tomorrow than the weather.
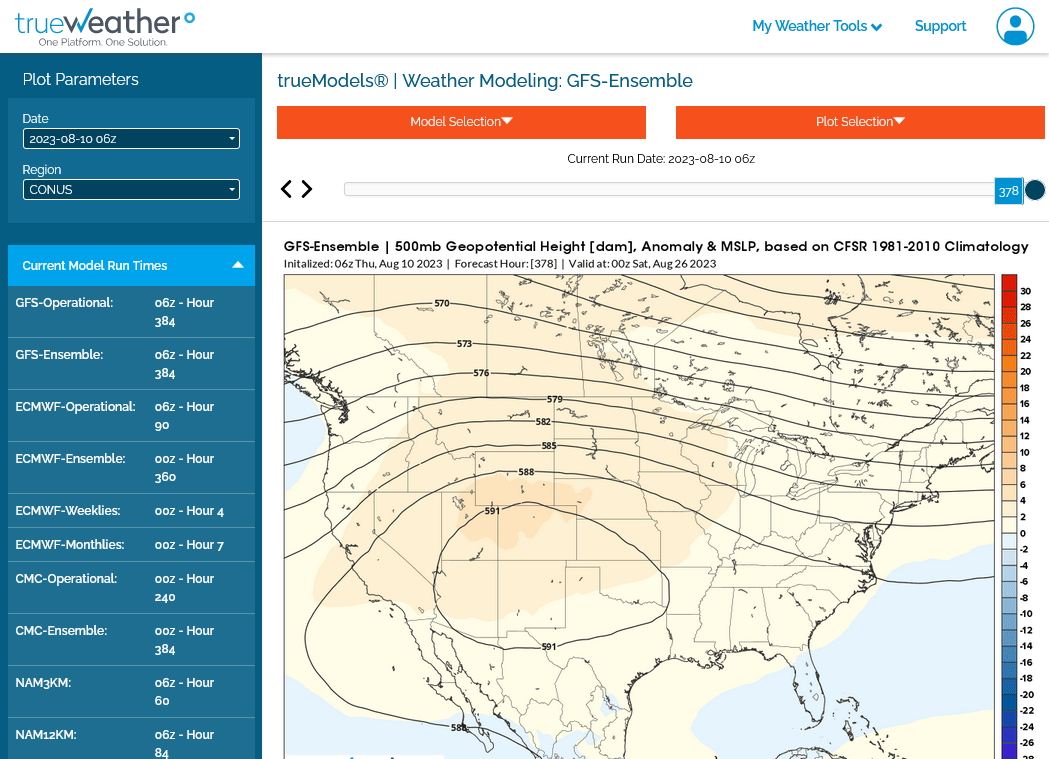
1. Just out 500 mb 6z GEFS-northwest flow for Midwest, trough again in the Northeast-MUCH LESS bullish for NG with less heat in the East.
2. Just out 6z GEFS total rains best amounts Southeast belt
3. 0z European model total rains. Much wetter Upper Midwest/WCB
++++++++++++++++++
Natural gas futures pulled back in early trading Thursday as the market continued to assess the implications of overseas price gains and a shrinking domestic storage surplus. After rallying 18.2 cents in Wednesday’s trade, the September Nymex contract was off 5.4 cents to $2.905/MMBtu at around 8:55 a.m. ET. Domestic natural gas futures soared higher
+++++++++++
Apparently, yesterdays price spike was caused by the TTF strike in Australia which might shut down 10% of the global LNG supply. This is the case of where impossible to predict news can really bite you if you're trading weather.......or help if your lucky.
Traders banking on luck, instead of skill eventually go broke!
Slightly bearish vs expectations:
![]()
for week ending August 4, 2023 | Released: August 10, 2023 at 10:30 a.m. | Next Release: August 17, 2023
| Working gas in underground storage, Lower 48 states Summary text CSV JSN | |||||||||||||||||||||||||
|---|---|---|---|---|---|---|---|---|---|---|---|---|---|---|---|---|---|---|---|---|---|---|---|---|---|
| Historical Comparisons | |||||||||||||||||||||||||
| Stocks billion cubic feet (Bcf) | Year ago (08/04/22) | 5-year average (2018-22) | |||||||||||||||||||||||
| Region | 08/04/23 | 07/28/23 | net change | implied flow | Bcf | % change | Bcf | % change | |||||||||||||||||
| East | 700 | 680 | 20 | 20 | 562 | 24.6 | 622 | 12.5 | |||||||||||||||||
| Midwest | 793 | 775 | 18 | 18 | 660 | 20.2 | 706 | 12.3 | |||||||||||||||||
| Mountain | 196 | 191 | 5 | 5 | 148 | 32.4 | 169 | 16.0 | |||||||||||||||||
| Pacific | 233 | 230 | 3 | 3 | 252 | -7.5 | 264 | -11.7 | |||||||||||||||||
| South Central | 1,108 | 1,124 | -16 | -16 | 873 | 26.9 | 963 | 15.1 | |||||||||||||||||
| Salt | 284 | 297 | -13 | -13 | 193 | 47.2 | 240 | 18.3 | |||||||||||||||||
| Nonsalt | 824 | 828 | -4 | -4 | 680 | 21.2 | 723 | 14.0 | |||||||||||||||||
| Total | 3,030 | 3,001 | 29 | 29 | 2,495 | 21.4 | 2,725 | 11.2 | |||||||||||||||||
Totals may not equal sum of components because of independent rounding. | |||||||||||||||||||||||||
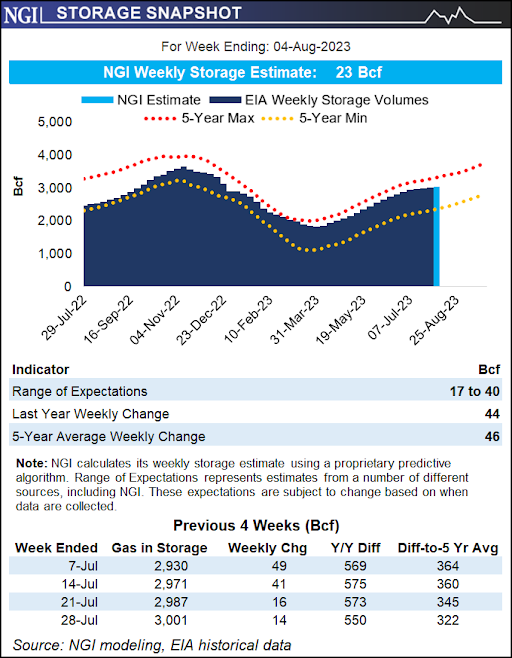
Working gas in storage was 3,030 Bcf as of Friday, August 4, 2023, according to EIA estimates. This represents a net increase of 29 Bcf from the previous week. Stocks were 535 Bcf higher than last year at this time and 305 Bcf above the five-year average of 2,725 Bcf. At 3,030 Bcf, total working gas is within the five-year historical range.
For information on sampling error in this report, see Estimated Measures of Sampling Variability table below.

Note: The shaded area indicates the range between the historical minimum and maximum values for the weekly series from 2018 through 2022. The dashed vertical lines indicate current and year-ago weekly periods.
The Energy Information Administration (EIA) said natural gas storage inventories rose by 29 Bcf for the week ending Aug. 4. The larger-than-expected injection sent futures prices, already more than 5.0 cents lower day/day, tumbling further. The September Nymex futures contract was trading around $2.885/MMBtu in the minutes leading up to the EIA’s weekly inventory report…
++++++++++++++++
The drop would not be so steep if not for the extended maps to take out heat risk later this month as shown above! https://www.marketforum.com/forum/topic/97999/#98089
We got off to a bullish start this evening. However, the 18z GEFS was LESS bullish with more troughing in the East and even some weakness in the upper levels in TX and along the Gulf Coast to FL. Haven't seen that in a LONG time. The heat should become less intense.........but its also late August. Regardless, the heat anomolies look weaker late this month in the areas with the blue shade below, even though this is a 500 mb map(around 4 miles up-close to the midpoint of the atmosphere)

Strongly agree with this assessment. The models all took out heat overnight. The GEFS by a whopping -7 CDDs but the EE a more modest -1.5 CDDS. All models show the magnitude of the heat spike higher next week to be very transient. During week 2, it's still hot in some places but LESS and LESS hot.
The last EE below in the purple. Right side it CDDs.
Major top last week.
https://tradingeconomics.com/commodity/natural-gas
1. 1 month
2. 1 year
3. 30+ years
0z European model a whopping -5 CDDs overnight! All in week 2. Bearish! Bottom/right purple line.
Not much change in temps overnight.
Here's the temps last week for the period covered on this morning's 9:30 am weekly EIA report.
Mild for much of the country but HOT from TX to FL. Also along the Pacific Coast.
The SouthCentral region will have another WITHDRAWAL but storage is in great shape there.
https://www.cpc.ncep.noaa.gov/products/tanal/temp_analyses.php
The Pacific region has low storage and high prices(thanks in part to unreliable green energy schemes wrecking their energy dynamics) and they will not have much of an injection. However, they have been catching up and refilling after the lowest storage in 2 decades earlier this Spring.
https://www.eastdaley.com/media-and-news/long-road-ahead-to-refill-west-coast-storage
![]()
https://ir.eia.gov/ngs/ngs.html
for week ending August 11, 2023 | Released: August 17, 2023 at 10:30 a.m. | Next Release: August 24, 2023
| Working gas in underground storage, Lower 48 states Summary text CSV JSN | |||||||||||||||||||||||||
|---|---|---|---|---|---|---|---|---|---|---|---|---|---|---|---|---|---|---|---|---|---|---|---|---|---|
| Historical Comparisons | |||||||||||||||||||||||||
| Stocks billion cubic feet (Bcf) | Year ago (08/11/22) | 5-year average (2018-22) | |||||||||||||||||||||||
| Region | 08/11/23 | 08/04/23 | net change | implied flow | Bcf | % change | Bcf | % change | |||||||||||||||||
| East | 717 | 700 | 17 | 17 | 570 | 25.8 | 638 | 12.4 | |||||||||||||||||
| Midwest | 812 | 793 | 19 | 19 | 681 | 19.2 | 731 | 11.1 | |||||||||||||||||
| Mountain | 202 | 196 | 6 | 6 | 151 | 33.8 | 172 | 17.4 | |||||||||||||||||
| Pacific | 240 | 233 | 7 | 7 | 249 | -3.6 | 263 | -8.7 | |||||||||||||||||
| South Central | 1,093 | 1,108 | -15 | -15 | 867 | 26.1 | 962 | 13.6 | |||||||||||||||||
| Salt | 272 | 284 | -12 | -12 | 186 | 46.2 | 235 | 15.7 | |||||||||||||||||
| Nonsalt | 821 | 824 | -3 | -3 | 681 | 20.6 | 728 | 12.8 | |||||||||||||||||
| Total | 3,065 | 3,030 | 35 | 35 | 2,516 | 21.8 | 2,766 | 10.8 | |||||||||||||||||
Totals may not equal sum of components because of independent rounding. | |||||||||||||||||||||||||
Working gas in storage was 3,065 Bcf as of Friday, August 11, 2023, according to EIA estimates. This represents a net increase of 35 Bcf from the previous week. Stocks were 549 Bcf higher than last year at this time and 299 Bcf above the five-year average of 2,766 Bcf. At 3,065 Bcf, total working gas is within the five-year historical range.
For information on sampling error in this report, see Estimated Measures of Sampling Variability table below.
++++++
Muted Response from Natural Gas Futures After EIA Reports On-Target 35 Bcf Injection
The U.S. Energy Information Administration (EIA) on Thursday reported an on-target 35 Bcf injection into domestic storage facilities for the week ending Aug. 11, a surplus-trimming result that solicited only a muted response from natural gas futures traders. Futures climbed early Thursday as traders awaited the latest government inventory report, paring losses recorded over the…
++++++++++++++
Note the rising blue line above curving away from the top of the shaded area as we lose a bit of the surplus compared to previous years but storage is still pretty robust everywhere except in the Pacific region, which is catching up from the lowest storage in 20 years earlier this year.
After being bearish -3 CDDs overnight, the last 12z European model was an incredible +8 CDDs, which gave ng an afternoon bounce.
The 12z run is the purple on the bottom right. Warmer during the entire period........but still cooling in week 2. September is usually not great weather trading for natural gas.
Mike Will this have an affect on natural gas prices?
Kinder Morgan Tennessee pipeline hit by explosion, declares force majeure (msn.com)
Great question, cutworm!
This is the sort of news that might spike the market up but I didn't notice that on Friday.
It might have happened too late in the day?
I'll try to find out more.
++++++++++++
update:
The explosion was first reported at the plant on Highway 48 in Nunnelly about 8:20 a.m., a spokesperson with Kinder Morgan said.
+++++++++
That would have been 7:20 am EDT.
The market did spike much higher from 8:01 to 8:40am CDT.
+++++++++
update:
OK, Hickman country TN is on CDT, so this happened at 8:20 am CDT and the market spike higher started 19 minutes before this happened and continued for 20 minutes after it happened.
Either the time it happened is off or the market just happened to start spiking higher 19 minutes before hand.
https://www.timeanddate.com/time/zone/@4629047

I can't get a daily chart from this link below but the weekly does show that spike from the lows on Friday morning that started 19 minutes before the incident happened.
mics.com/commodity/natural-gas
Natural gas futures were higher at the top of the week as searing heat blanketed much of the Lower 48, challenging record power loads and stressing grids. The September Nymex gas futures contract settled Monday at $2.632/MMBtu, up 8.1 cents from Friday’s settlement. October futures climbed 5.2 cents to $2.743. At A Glance: Long-range models…
Temps last week for this Thursday's EIA report at 9:30am. Hot West, TX to Fl to Mid-Atlantic. Pleasant Plains to Midwest to Northeast.
https://www.cpc.ncep.noaa.gov/products/tanal/temp_analyses.php
Bullish!
1. Note below the drawdown in the SouthCentral region from intense heat there/TX
2. Note that the Pacific region, is still the only one that does NOT have robust storage. It has never been able to completely recover from the deep deficits after last Winter.
3. Note that the blue line on the graph, continues to curve inward, away from the top of the 5 year average. Supplies are still quite robust, including in the SouthCentral region.
![]()
for week ending August 18, 2023 | Released: August 24, 2023 at 10:30 a.m. | Next Release: August 31, 2023
| Working gas in underground storage, Lower 48 states Summary text CSV JSN | |||||||||||||||||||||||||
|---|---|---|---|---|---|---|---|---|---|---|---|---|---|---|---|---|---|---|---|---|---|---|---|---|---|
| Historical Comparisons | |||||||||||||||||||||||||
| Stocks billion cubic feet (Bcf) | Year ago (08/18/22) | 5-year average (2018-22) | |||||||||||||||||||||||
| Region | 08/18/23 | 08/11/23 | net change | implied flow | Bcf | % change | Bcf | % change | |||||||||||||||||
| East | 731 | 717 | 14 | 14 | 594 | 23.1 | 659 | 10.9 | |||||||||||||||||
| Midwest | 831 | 812 | 19 | 19 | 710 | 17.0 | 759 | 9.5 | |||||||||||||||||
| Mountain | 206 | 202 | 4 | 4 | 153 | 34.6 | 175 | 17.7 | |||||||||||||||||
| Pacific | 242 | 240 | 2 | 2 | 244 | -0.8 | 261 | -7.3 | |||||||||||||||||
| South Central | 1,072 | 1,093 | -21 | -21 | 870 | 23.2 | 960 | 11.7 | |||||||||||||||||
| Salt | 260 | 272 | -12 | -12 | 184 | 41.3 | 229 | 13.5 | |||||||||||||||||
| Nonsalt | 813 | 821 | -8 | -8 | 686 | 18.5 | 732 | 11.1 | |||||||||||||||||
| Total | 3,083 | 3,065 | 18 | 18 | 2,570 | 20.0 | 2,815 | 9.5 | |||||||||||||||||
Totals may not equal sum of components because of independent rounding. | |||||||||||||||||||||||||
Working gas in storage was 3,083 Bcf as of Friday, August 18, 2023, according to EIA estimates. This represents a net increase of 18 Bcf from the previous week. Stocks were 513 Bcf higher than last year at this time and 268 Bcf above the five-year average of 2,815 Bcf. At 3,083 Bcf, total working gas is within the five-year historical range.
For information on sampling error in this report, see Estimated Measures of Sampling Variability table below.
+++++++++++++++
Read my discussion at the top of the previous post.
NG had a huge gap higher.
The weather forecast is hotter and keeps the heat going for additional days in the forecast.
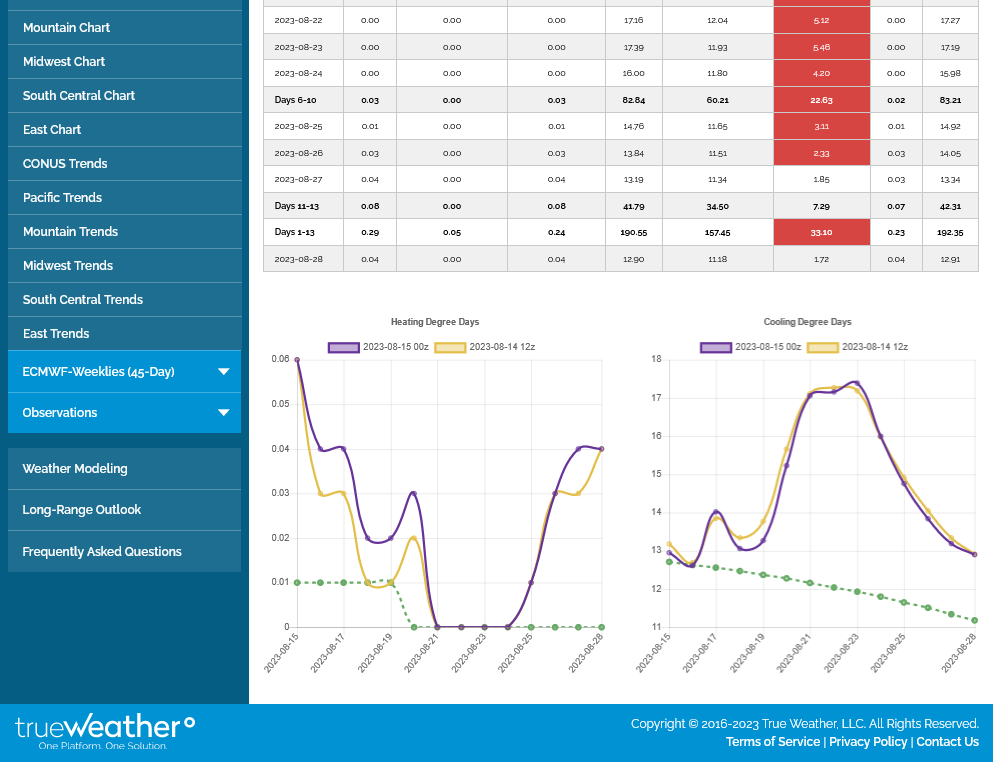
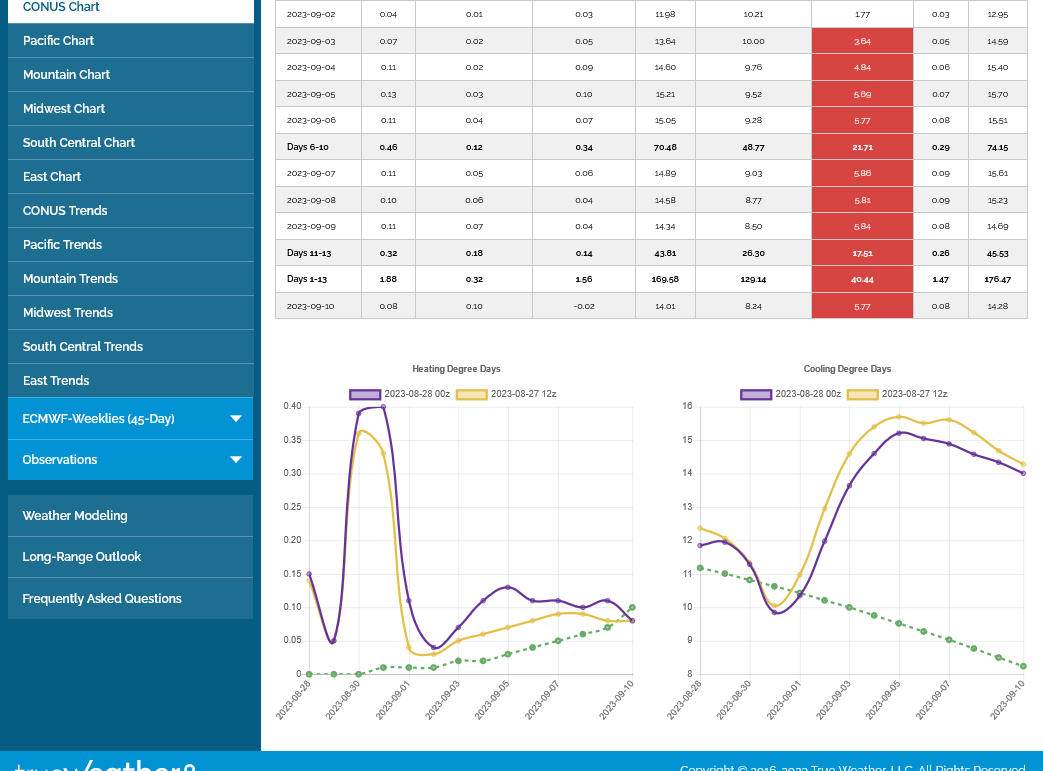
These were the last 2 runs of the European Ensemble model. The CDDs are on the right. Note how the lines are WAY above the average in green(which is rapidly dropping as the September sun get's lower and lower in the sky).
For the 2 week period below, the CDDs/day go from 11 to 8.
By the end of the month, HDDs will begin climbing. They pass up CDDs in October. I think, maybe in the 3rd week?
Regardless, September is the last month that CDDs can really be bullish.
Record heat just can't have much impact anymore and actually turns increasingly bearish later in the month.
Front month, September NGU expires early this week. Volume for October, NGV the next month is already double the NGU volume tonight.
NG held the gap over night, despite the EE being a whopping -7 CDDs. Purple line on the right/below.
A huge factor this week is the fact that the EIA on Thursday at 9:30 am, will be MEGA bullish from last weeks intense heat wave.
Temps from last week, thru last Thursday for the EIA. Intense heat in the center! Below average Northeast and Southwest.
https://www.cpc.ncep.noaa.gov/products/tanal/temp_analyses.php
+++++++++
I completely forgot about the impact of Idalia. 20 years ago, a major hurricane threatening the western GOM was 10 times more bullish than any other weather. Today, most of the production comes from land based fracking. Idalia will be hitting the eastern GOM, that doesn't have the platforms that the west has.