KEY EVENTS TO WATCH FOR:
Monday, August 7, 2023
10:00 AM ET. July Employment Trends Index
ETI (previous 114.31)
ETI, Y/Y%
3:00 PM ET. June Consumer Credit
Consumer Credit Net Chg (USD) (previous +7.3B)
The STOCK INDEXES? http://quotes.ino.com/ex?changes/?c=indexes
The Dow closed lower on Friday due to a sharp sell off in the afternoon session. The low-range close sets the stage for a steady to lower opening when Monday's day session begins trading. Stochastics and the RSI remain neutral to bearish signaling that sideways to lower prices are possible near-term. Closes below the 20-day moving average crossing at 35,023.65 would confirm that a short-term top has been posted. If the Dow extends the rally off July's low, the February-2022 high crossing at 35,824.28 is the next upside target. First resistance is Tuesday's high crossing at 35,679.13. Second resistance is the February-2022 high crossing at 35,824.28. First support is the 20-day moving average crossing at 35,023.28. Second support is the 50-day moving average crossing at 34,268.73.
The September NASDAQ 100 closed lower on Friday. The low-range close sets the stage for a steady to lower opening when Monday's night session begins trading. Stochastics and the RSI are oversold but remain neutral to bearish signaling sideways to lower prices are possible. If September extends this week's decline, the 50-day moving average crossing at 15,199.31 is the next downside target. If September renews this year's rally, the December-2021 high on the weekly continuation chart crossing at 16,659.50 is the next upside target. First resistance is the July 19th high crossing at 16,062.75. Second resistance is the December-2021 high on the weekly continuation chart crossing at 16,659.50. First support is the 50-day moving average crossing at 15,199.31. Second support is July's low crossing at 15,063.25.
The September S&P 500 closed lower on Friday. The low-range close sets the stage for a steady to lower opening when Monday's night session begins trading. Stochastics and the RSI are oversold but remain neutral to bearish signaling that sideways to lower prices are possible near-term. If September extends this week's decline the 50-day moving average crossing at 4445.40 is the next downside target. If September renews the rally off March's low, the 87% retracement level of the 2022 decline on the weekly chart crossing at 4639.37 is the next upside target. First resistance is last-Thursday's high crossing at 4634.50. Second resistance is the 87% retracement level of the 2022 decline on the weekly chart crossing at 4639.37. First support is the 50-day moving average crossing at 4445.40. Second support is July's low crossing at 4411.25.
INTEREST RATES? http://quotes.ino.com/ex?changes/?c=interest ""
September T-bonds closed up 1-26/32's at 122-05.
September T-bonds closed sharply higher on Friday as it consolidates some of the decline off July's high. The high-range close sets the stage for a steady to higher opening when Monday's day session begins trading. Stochastics and the RSI are oversold but remain neutral to bearish signaling that sideways to lower prices are possible near-term. If September extends the decline off July's high, the 50% retracement level of the 1980-2020 rally on the monthly continuation chart crossing at 118-21 is the next downside target. Closes above the 20-day moving average crossing at 124-30 would signal that a short-term low has been posted. First resistance is the 20-day moving average crossing at 124-30. Second resistance is the 50-day moving average crossing at 126-07. First support is today's low crossing at 119-25. Second support is the 50% retracement level of the 1980-2020 rally on the monthly continuation chart crossing at 118-21.
September T-notes closed up 1005-pts. at 111.080.
September T-notes closed sharply higher on Friday as it consolidated some of the decline off July's high. The high-range close sets the stage for a steady to higher opening when Monday's day session begins trading. Stochastics and the RSI are oversold but remain neutral to bearish signaling that sideways to lower prices are possible near-term. If September extends the decline off July's high, the October-2022 low crossing at 108.265 is the next downside target. Closes above the 20-day moving average crossing at 111.252 would signal that a short-term low has been posted. First resistance is the 20-day moving average crossing at 111.252. Second resistance is the 50-day moving average crossing at 112.152. First support is today's low crossing at 109.240. Second support is the October-2022 low crossing at 108.265.
ENERGY MARKETS? http://quotes.ino.com/ex?changes/?c=energy ""
September crude oil closed higher on Friday as it extends the rally off June's low. The high-range close sets the stage for a steady to higher opening when Monday's day session begins. Stochastics and the RSI are overbought but remain neutral to bullish signaling that sideways to higher prices are possible near-term. If September extends the rally off June's low, the 62% retracement level of the 2022-2023 decline on the weekly chart crossing at $84.20 is the next upside target. Closes below the 20-day moving average crossing at $77.88 would signal that a short-term top has been posted. First resistance today's high crossing at $83.24. Second resistance is the 62% retracement level of the 2022-2023 decline on the weekly chart crossing at $84.20. First support is the 20-day moving average crossing at $77.88. Second support is the 50-day moving average crossing at $73.58.
September heating oil closed lower on Friday as it consolidated some of Thursday's rally. The low-range close sets the stage for a steady to lower opening when Monday's day trading session begins. Stochastics and the RSI are overbought but remain neutral to bullish signaling that sideways to higher prices are possible near-term. If September extends the rally off May's low, the 87% retracement level of the 2022-2023 decline crossing at 3.1313 is the next upside target. Closes below the 20-day moving average crossing at 2.7727 would signal that a short-term top has been posted. First resistance is today's high crossing at 3.0954. Second resistance is the 87% retracement level of the 2022-2023 decline crossing at 3.1313. First support is the 10-day moving average crossing at 2.9372. Second support the 20-day moving average crossing at 2.7727.
September unleaded gas closed higher on Friday as it consolidated some of this week's decline. The low-range close sets the stage for a steady to lower opening when Monday's day session begins trading. Stochastics and the RSI are neutral to bearish signaling that sideways to lower prices are possible near-term. Closes below the 20-day moving average crossing at 2.7247 would confirm that a short-term top has been posted. If September extends the rally off the June 23rd low, the October-2022 high on the weekly continuation chart crossing at 3.0221 is the next upside target. First resistance is July's high crossing at 2.9257. Second resistance is the October-2022 high on the weekly continuation chart crossing at 3.0221. First support is the 20-day moving average crossing at 2.7247. Second support is the 50-day moving average crossing at 2.5363.
September Henry natural gas closed slightly higher on Friday.The mid-range close sets the stage for a steady to higher opening when Monday's day session begins trading. Stochastics and the RSI are turning neutral to bullish signaling that sideways to higher prices are possible near-term. If September extends the rally off Wednesday's low, June's high crossing at 2.911 is the next upside target. If September extends this week's decline, June's low crossing at 2.249 is the next downside target. First resistance is the June high crossing at 2.911. Second resistance is the 25% retracement level of the 2022-2023 decline crossing at 3.193. First support is Wednesday's low crossing at 2.457. Second support is the June 1st low crossing at 2.249.
CURRENCIES? http://quotes.ino.com/ex?changes/?c=currencies ""
The September Dollar closed lower on Friday as it consolidates some of the rally off July's low. The low-range close sets the stage for a steady to lower opening when Monday's session begins trading. Stochastics and the RSI are overbought but remain neutral to bullish signaling that sideways to higher prices are possible near-term. If September extends the rally off July's low, July's high crossing at 103.275 is the next upside target. Closes below the 20-day moving average crossing at 100.944 would signal that a short-term top has been posted. First resistance is July's high crossing at 103.275. Second resistance is May's high crossing at 104.205. First support is the 20-day moving average crossing at 100.944. Second support is last-Thursday's low crossing at 100.320.
The September Euro closed sharply higher on Friday as it consolidates some of the decline off July's high. The high-range close sets the stage for a steady to higher opening when Monday's day session begins trading. Stochastics and the RSI are oversold but remain neutral to bearish signaling that sideways to lower prices are possible near-term. If September extends the decline off July's high, July's low crossing at 1.08715 is the next downside target. Closes above the 20-day moving average crossing at 1.11108 would temper the near-term bearish outlook. First resistance is last-Thursday's high crossing at 1.11770. Second resistance is July's high crossing at $1.13105. First support is Thursday's low crossing at $1.09425. Second support is July's low crossing at 1.08715.
The September British Pound closed higher on Friday as it consolidated some of the decline off July's high. The high-range close sets the stage for a steady to higher opening when Monday's day session begins trading. Stochastics and the RSI are oversold but remain neutral to bearish signaling sideways to lower prices are possible near-term. If September extends the decline off July's high, the 50% retracement level of the March-July rally crossing at 1.2508 is the next downside target. Closes above the 20-day moving average crossing at 1.2898 would signal that a short-term low has been posted. First resistance is the 10-day moving average crossing at 1.2814. Second resistance is the 20-day moving average crossing at 1.2898. First support is Thursday's low crossing at 1.2683. Second support is the June 29th low crossing at 1.2594.
The September Swiss Franc closed higher on Thursday as it consolidates some of the decline off July's high. The high-range close sets the stage for a steady to higher opening when Monday's day session begins trading. Stochastics and the RSI are oversold but are turning neutral to bullish hinting that a low might be in or is near. Closes above the 20-day moving average crossing at 1.15864 would signal that a short-term low has been posted. If September extends the aforementioned decline, the 50-day moving average crossing at 1.13643 is the next downside target. First resistance is the 20-day moving average crossing at 1.15864. Second resistance is the July 18th high crossing at 1.17650. First support is Wednesday's low crossing at 1.14130. Second support is the 50-day moving average crossing at 1.13643.
The September Canadian Dollar closed lower for the fourth-day in a row on Friday as it extends the decline off July's high. The low-range close sets the stage for a steady to lower opening when Monday's day session begins trading. Stochastics and the RSI are oversold but remain neutral to bearish signaling that sideways to lower prices are possible near-term. If September extends the decline off July's high, the 50% retracement level of the March-July rally crossing at 74.48 is the next downside target. Closes above the 20-day moving average crossing at 75.68 would signal that a short-term low has been posted. First resistance is the 50-day moving average crossing at 75.34. Second resistance is the 10-day moving average crossing at 75.49. First support is the 50% retracement level of the March-July rally crossing at 74.48. Second support is the 62% retracement level of the March-July rally crossing at 74.01.
The September Japanese Yen closed slightly higher on Friday. The high-range close sets the stage for a steady to higher opening when Monday’s day session begins trading. Stochastics and the RSI are oversold but remain neutral to bearish signaling that sideways to lower prices are possible near-term. If September extends the decline off July's high, June's low crossing at 0.069755 is the next downside target. Closes above the 20-day moving average crossing at 0.071752 would signal that a short-term low has been posted. First resistance is the 20-day moving average crossing at 0.071752. Second resistance is last-Thursday's high crossing at 0.073015. First support is Thursday's low crossing at 0.069970. Second support is June's low crossing at 0.069755.
PRECIOUS METALS? http://quotes.ino.com/ex?changes/?c=metals ""
December gold posted a key reversal up as it closed higher on Friday. The high-range close sets the stage for a steady to higher opening when Monday's day session begins trading. Stochastics and the RSI are oversold but remain neutral to bearish signaling that sideways to lower prices are possible near-term. If December extended the decline off July's high, June's low crossing at $1939.20 is the next downside target. If December renews the rally off June's low, June's high crossing at $2039.00 is the next upside target. First resistance is June's high crossing at $2039.00. Second resistance is the 62% retracement level of the May-June decline crossing at $2057.30. First support is today's low crossing at $1954.50. Second support is June's low crossing at $1919.60.
September silver closed slightly lower on Friday as it extended the decline off July's high. The mid-range close sets the stage for a steady to lower opening when Monday's day session begins trading. Stochastics and the RSI are oversold but remain neutral to bearish signaling that sideways to lower prices are possible near-term. If September extends the decline off July's high, June's low crossing at 22.340 is the next downside target. If July renews the rally off June's low, the 75% retracement level of the April-June decline crossing at 25.561 is the next upside target. First resistance is July's high crossing at 25.475. Second resistance is the 75% retracement level of the April-June decline crossing at 25.561. First support is the July 6th low crossing at 22.720. Second support is June's low crossing at 22.340.
September copper closed lower on Friday. The low-range close sets the stage for a steady to lower opening when Monday's day session begins trading. Stochastics and the RSI are bearish signaling that sideways to lower prices are possible near-term. Closes below the 50-day moving average crossing at 3.8138 would signal that a short-term top has been posted. If September renews the rally off June's low, April's high crossing at 4.1825 is the next upside target. First resistance is Tuesday's high crossing at 4.0240. Second resistance is April's high crossing at 4.1825. First support is the 50-day moving average crossing at 3.8138. Second support is the June 29th low crossing at 3.6830.
GRAINS? http://quotes.ino.com/ex?changes/?c=grains "
December Corn closed up $0.03 3/4-cents at $4.97 1/4.
December corn closed slightly higher on Friday as it consolidates some of the decline off July's high. The low-range close sets the stage for a steady to lower opening when Monday's night session begins trading. Stochastics and the RSI are oversold but remain bearish signaling that sideways to lower prices are possible near-term. If December extends the decline off July's high, July's low crossing at $4.81 is the next downside target. Closes above the 50-day moving average crossing at $5.35 would signal that a short-term low has been posted. First resistance is the 20-day moving average crossing at $5.22. Second resistance is the 50-day moving average crossing at $5.35. First support is July's low crossing at $4.81. Second support is the September-2021 low on the weekly chart crossing at $4.62 1/2.
September wheat closed up $0.06-cents at $6.33.
September wheat closed higher on Friday as it consolidated some of the decline off July's high. The low-range close sets the stage for a steady to lower opening when Monday's day session begins trading. Stochastics and the RSI are oversold but remain neutral to bearish signaling that sideways to lower prices are possible near-term. If September extends the decline off July's high, July's low crossing at $6.22 is the next downside target. Closes above the 10-day moving average crossing at $6.87 1/4 would signal that a short-term low has been posted. First resistance is the 10-day moving average crossing at $6.87 1/4. Second resistance is July's high crossing at $7.77 1/4. First support is Thursday's low crossing at $6.26 1/4. Second support is July's low crossing at $6.22.
September Kansas City Wheat closed down $0.15-cents at $7.52 1/2.
September Kansas City wheat closed lower for the sixth-day in a row on Friday as it extends the decline off July's high. The low-range close sets the stage for a steady to lower opening when Monday's day session begins trading. Stochastics and the RSI are oversold but remain bearish signaling that sideways to lower prices are possible near-term. If September extends the decline off July's high, May's low crossing at $7.33 is the next downside target. Closes above the 10-day moving average crossing at $8.34 1/2 would signal that a short-term low has been posted. First resistance is the 50-day moving average crossing at $8.27 3/4. Second resistance is the 20-day moving average crossing at $8.32 3/4. First support is today's low crossing at $7.52. Second support is May's low crossing at $7.33.
September Minneapolis wheat closed down $0.11 1/4-cents crossing at $8.22 1/4.
September Minneapolis wheat closed lower on Friday as it extended the decline off July's high. The low-range close sets the stage for a steady to lower opening when Monday's day session begins trading. Stochastics and the RSI are oversold but remain bearish signaling that sideways to lower prices are possible near-term. If September extends the decline off July's high, July's low crossing at $8.07 1/4 is the next downside target. Closes above the 10-day moving average crossing at $8.77 3/4 would signal that a short-term low has been posted. First resistance is the 50-day moving average crossing at $8.47 1/4. Second resistance is the 10-day moving average crossing at $8.77 3/4. First support is July's low crossing at $8.07 1/4. Second support is the June 14th low crossing at $8.01 1/4.
SOYBEAN COMPLEX? http://quotes.ino.com/ex?changes/?c=grains "
November soybeans closed up $0.08-cents at $13.33 1/4.
November soybeans closed higher on Friday as it extended the late-week trading range. The low-range close sets the stage for a steady to lower opening when Monday's day session begins trading. Stochastics and the RSI are oversold but remain neutral to bearish signaling that sideways to higher prices are possible near-term. If November extends the aforementioned decline, the 50-day moving average crossing at $13.02 3/4 is the next downside target. Closes above the 20-day moving average crossing at $13.72 3/4 would signal that a short-term low has been posted. First resistance is Monday's gap crossing at $13.79. Second resistance is July's high crossing at $14.35. First support is the July 7th low crossing at $13.15 1/2. Second support is the 50-day moving average crossing at $13.02 3/4.
December soybean meal closed down $0.80 at $397.70.
December soybean meal closed slightly lower on Friday as it extends this week's trading range. The low-range close sets the stage for a steady to lower opening when Friday's day session begins trading. Stochastics and the RSI are oversold but remain neutral to bearish signaling that sideways to lower prices are possible near-term. Closes below the 50-day moving average crossing at $391.70 would open the door for additional weakness near-term. Closes above the 10-day moving average crossing at $405.00 would signal that a short-term low has been posted. First resistance is the 10-day moving average crossing at $405.00. Second resistance is July's high crossing at $424.70. First support is the 50-day moving average crossing at $391.70. Second support is the July 7th low crossing at $384.70.
December soybean oil closed up 148-pts. at 61.52.
December soybean oil closed higher on Friday as it consolidates some of the decline off July's high. The high-range close sets the stage for a steady to higher opening when Friday's day session begins trading. Stochastics and the RSI are turning neutral to bullish signaling that sideways to higher prices are possible near-term. If December renews the rally off May's low, the 87% retracement level of the 2022-2023 decline crossing at 68.81 is the next upside target. If December renews the decline off July's high, the 50-day moving average crossing at 56.52 is the next downside target. First resistance is the 10-day moving average crossing at 61.97. Second resistance is July's high crossing at 65.58. First support is the July 10th low crossing at 58.39. Second support is the 50-day moving average crossing at 56.52.
LIVESTOCKhttp://quotes.ino.com/exchanges/?c=livestock
October hogs closed up $1.20 at $83.25.
October hogs posted an inside day with a higher close on Friday. The high-range close sets the stage for a steady to higher opening when Friday's day session begins trading. Stochastics and the RSI are neutral to bearish signaling that sideways to lower prices are possible near-term. If October extends the rally off May's low, the 75% retracement level of the April-May decline crossing at $87.50 is the next upside target. If October extends this week's decline, the 50-day moving average crossing at $79.99 is the next downside target. First resistance is Tuesday's high crossing at $86.75. Second resistance is the 75% retracement level of the April-May decline crossing at $87.50. First support is the 50-day moving average crossing at $79.99. Second support is the June 30th low crossing at $77.58.
October cattle closed down $1.23 at $180.60.
October cattle closed sharply higher on Friday. The high-range close sets the stage for a steady to higher opening on Monday. Stochastics and the RSI are neutral to bullish signaling that sideways to higher prices are possible near-term. If October renews this year's rally into uncharted territory, upside targets will be hard to project. If October extends the decline off July's high, the 50-day moving average crossing at $177.54 is the next downside target. First resistance is July's high crossing at $185.75. Second resistance is unknown. First support is the 50-day moving average crossing at $177.54. Second support is the June 21st low crossing at $171.83.
October Feeder cattle closed up $1.98 at $255.40.
October Feeder cattle closed higher on Friday as it extends the July-August trading range. The high-range close sets the stage for a steady to higher opening when Friday's day session begins trading. Stochastics and the RSI are neutral to bullish signaling that sideways to higher prices are possible near-term. If October renews the rally off June's low into uncharted territory, upside targets will be hard to project. Closes below the July 6th low crossing at $246.03 would mark a downside breakout of the aforementioned trading range. First resistance is July's high crossing at $256.00. Second resistance is unknown. First support is the July 6th low crossing at $246.03. Second support is the 50-day moving average crossing at $246.78.
FOOD & FIBERhttp://quotes.ino.com/ex changes/?c=food
September coffee closed lower on Friday. The low-range close sets the stage for a steady to lower opening on Friday. Stochastics and the RSI are overbought and are turning neutral to bearish signaling sideways to lower prices are possible near-term. If September resumes the decline off June's high, the 87% retracement level of the January-April rally crossing at $15.20 is the next downside target. If September extends the rally off July's low, the 50-day moving average crossing at $16.85 is the next upside target. First resistance is Thursday's high crossing at $16.83. Second resistance is the 50-day moving average crossing at $16.85. First support is July's low crossing at $15.51. Second support is the 87% retracement level of the January-April rally crossing at $15.20.
September cocoa posted an inside day with a slightly higher close on Friday. The low-range close sets the stage for a steady to lower opening on Friday. Stochastics and the RSI are neutral to bearish signaling that sideways to lower prices are possible near-term. Closes below the 20-day moving average crossing at 34.38 would confirm that a short-term top has been posted. If September renews the rally off March's low, monthly resistance crossing at 37.75 is the next upside target.
October sugar closed lower on Friday. The low-range close sets the stage for a steady to lower opening on Monday. Stochastics and the RSI are neutral to bearish signaling that sideways to lower prices are possible near-term. Today's closes below the 20-day moving average crossing at 24.18 confirms that a short-term top has been posted. If October renews the rally off June's low, June's high crossing at 26.19 is the next upside target.
December cotton posted an inside day with a lower close on Friday. The low-range close sets the stage for a steady to lower opening on Monday. Stochastics and the RSI are neutral to bearish signaling sideways to lower prices are possible near-term. Closes below the 20-day moving average crossing at 83.81 would confirm that a short-term top has been posted. If December renews the rally off June's low, the 75% retracement level of the May-July decline crossing at 91.29 is the next upside target.
Thanks tallpine!
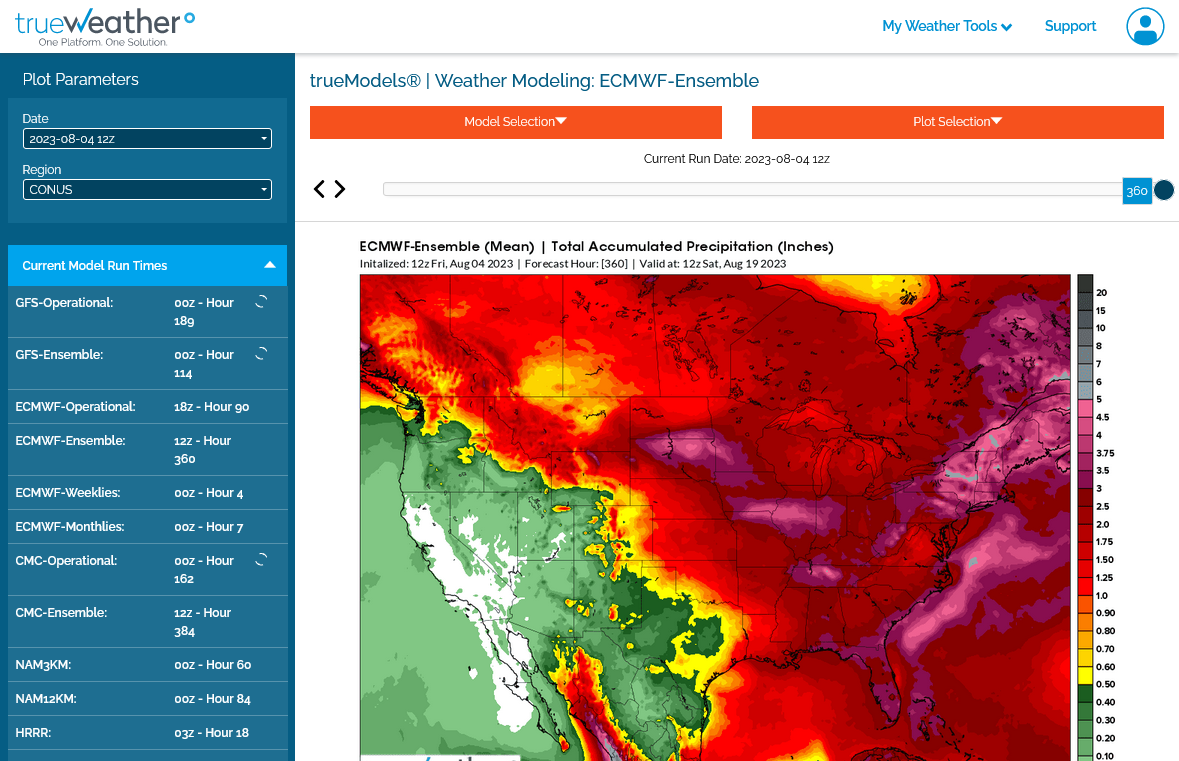
Heres the low skill weeks 3-4 forecast from today.
Not much change to the bearish weather. The market won't care about Fridays weather maps on Sunday Night if it changes.
https://www.cpc.ncep.noaa.gov/products/predictions/WK34/
| Week 3-4 Outlooks | |
| Valid: 19 Aug 2023 to 01 Sep 2023 Updated: 04 Aug 2023 | |
Temperature Probability | Precipitation Probability (Experimental)  |
The last European model was pretty dang wet from the N.Plains, southeast across much of the belt!