KEY EVENTS TO WATCH FOR:
Tuesday, August 1, 2023
8:55 AM ET. Johnson Redbook Retail Sales Index
Ret Sales Mo-to-Date, Y/Y% (previous -0.3%)
Latest Wk, Y/Y% (previous -0.4%)
9:45 AM ET. July US Manufacturing PMI
PMI, Mfg (expected 49.0; previous 46.3)
10:00 AM ET. July ISM Report On Business Manufacturing PMI
Manufacturing PMI (expected 46.9: previous 46.0)
Prices Idx (previous 41.8)
Employment Idx (previous 48.1)
Inventories (previous 44.0)
New Orders Idx (previous 45.6)
Production Idx (previous 46.7)
10:00 AM ET. June Construction Spending - Construction Put in Place
New Construction (expected +0.9%; previous +0.9%)
Residential Construction
10:00 AM ET. June Job Openings & Labor Turnover Survey
11:00 AM ET. July Global Manufacturing PMI
PMI, Mfg (previous 48.8)
4:00 PM ET. July Domestic Auto Industry Sales
4:30 PM ET. API Weekly Statistical Bulletin
Crude Stocks, Net Chg (Bbls) (previous +1.3M)
Gasoline Stocks, Net Chg (Bbls) (previous -1.0M)
Distillate Stocks, Net Chg (Bbls) (previous +1.6M)
The STOCK INDEXES? http://quotes.ino.com/ex?changes/?c=indexes
The Dow closed higher on Monday and the high-range close sets the stage for a higher opening when Tuesday's day session begins trading. Stochastics and the RSI are overbought but remain neutral to bullish signaling that sideways to higher prices are possible near-term. If the Dow extends the rally off July's low, the February-2022 high crossing at 35,824.28 is the next upside target. Closes below the 20-day moving average crossing at 34,773.10 would signal that a short-term top has been posted. First resistance is last-Thursday's high crossing at 35,645.35. Second resistance is the February-2022 high crossing at 35,824.28. First support is the 10-day moving average crossing at 35,305.02. Second support is the 20-day moving average crossing at 34,773.10.
The September NASDAQ 100 closed slightly higher on Monday. The mid-range close sets the stage for a steady to higher opening when Tuesday's night session begins trading. Stochastics and the RSI are turning neutral to bullish signaling sideways to higher prices are possible. If September renews this year's rally, the December-2021 high on the weekly continuation chart crossing at 16,659.50 is the next upside target. Closes below the 20-day moving average crossing at 15,574.31 would confirm that a short-term top has been posted while opening the door for additional weakness. First resistance is the July 19th high crossing at 16,062.75. Second resistance is the December-2021 high on the weekly continuation chart crossing at 16,659.50. First support is the 20-day moving average crossing at 15,574.31. Second support is the 50-day moving average crossing at 15,077.37.
The September S&P 500 closed slightly higher on Monday. The high-range close sets the stage for a steady to higher opening when Tuesday's night session begins trading. Stochastics and the RSI are overbought, diverging but remain neutral to bullish signaling that sideways to higher prices are possible near-term. If September extends the rally off March's low, the 87% retracement level of the 2022 decline on the weekly chart crossing at 4639.07 is the next upside target. Closes below the 20-day moving average crossing at 4539.71 would confirm that a short-term top has been posted. First resistance is last-Thursday's high crossing at 4634.50. Second resistance is the 87% retracement level of the 2022 decline on the weekly chart crossing at 4639.07. First support is the 20-day moving average crossing at 4539.71. Second support is the 50-day moving average crossing at 4420.98.
INTEREST RATES? http://quotes.ino.com/ex?changes/?c=interest ""
September T-bonds closed up 9/32's at 124-18.
September T-bonds closed higher on Monday as it consolidates some of last-Thursday's decline. The high-range close sets the stage for a steady to higher opening when Tuesday's day session begins trading. Stochastics and the RSI are neutral to bearish signaling that sideways to lower prices are possible near-term. If September extends the decline off July's high, July's low crossing at 122-30 is the next downside target. Closes above the 50-day moving average crossing at 126-21 would signal that a short-term low has been posted. First resistance is the 10-day moving average crossing at 125-24. Second resistance is the 50-day moving average crossing at 126-21. First support is last-Friday's low crossing at 123-09. Second support is July's low crossing at 122-30.
September T-notes closed up 20-pts. at 111.130.
September T-notes closed higher on Monday as it consolidates some of the decline off July's high. The mid-range close sets the stage for a steady to higher opening when Tuesday's day session begins trading. Stochastics and the RSI are neutral to bearish signaling that sideways to lower prices are possible near-term. If September extends the decline off July's high, July's low crossing at 110.050 is the next downside target. If September renews the rally off the July 6th low, the 50-day moving average crossing at 112.273 would signal that a short-term low has been posted. First resistance is the 50-day moving average crossing at 112.273. Second resistance is July's high crossing at 113.080. First support is last-Friday's low crossing at 110.255. Second support is July's low crossing at 110.050.
ENERGY MARKETS? http://quotes.ino.com/ex?changes/?c=energy ""
September crude oil closed higher on Monday as it extended the rally off June's low. Today's rally posted its highest close since January of this year. The high-range close sets the stage for a steady to higher opening when Tuesday's day session begins. Stochastics and the RSI are overbought but remain neutral to bullish signaling that sideways to higher prices are possible near-term. If September extends the rally off June's low, the 62% retracement level of the 2022-2023 decline on the weekly chart crossing at $84.20 is the next upside target. Closes below the 20-day moving average crossing at $75.99 would signal that a short-term top has been posted. First resistance January's high crossing at $81.75. Second resistance is the 62% retracement level of the 2022-2023 decline on the weekly chart crossing at $84.20. First support is the 10-day moving average crossing at $78.30. Second support is the 20-day moving average crossing at $75.99.
September heating oil closed higher on Monday as it extended the rally off May's low. The high-range close sets the stage for a steady to higher opening when Tuesday's day trading session begins. Stochastics and the RSI are overbought but remain neutral to bullish signaling that sideways to higher prices are possible near-term. If September extends the rally off May's low, the 75% retracement level of the 2022-2023 decline crossing at 3.0002 is the next upside target. Closes below the 20-day moving average crossing at 2.6581 would signal that a short-term top has been posted. First resistance is today's high crossing at 2.9743. Second resistance is the 75% retracement level of the 2022-2023 decline crossing at 3.0002. First support is the 10-day moving average crossing at 2.7832. Second support the 20-day moving average crossing at 2.6581.
September unleaded gas closed slightly lower on Monday. The high-range close sets the stage for a steady to higher opening when Tuesday's day session begins trading. Stochastics and the RSI are overbought but remain neutral to bullish signaling that sideways to higher prices are possible near-term. If September extends the rally off the June 23rd low, the October-2022 high on the weekly continuation chart crossing at 3.0221 is the next upside target. Closes below the 20-day moving average crossing at 2.6554 would confirm that a short-term top has been posted. First resistance is last-Friday's high crossing at 2.9257. Second resistance is the October-2022 high on the weekly continuation chart crossing at 3.0221. First support is the 10-day moving average crossing at 2.7896. Second support is the 20-day moving average crossing at 2.6554.
September Henry natural gas closed slightly higher on Monday.The low-range close sets the stage for a steady to slightly lower opening when Tuesday's day session begins trading. Stochastics and the RSI are neutral to bearish signaling that sideways to lower prices are possible near-term. If September extends last-Thursday's decline, the July 17th low crossing at 2.477 is the next downside target. If September renews the rally off the July 17th low, June's high crossing at 2.911 is the next upside target. First resistance is the June high crossing at 2.911. Second resistance is the 25% retracement level of the 2022-2023 decline crossing at 3.193. First support is the July 17th low crossing at 2.477. Second support is the June 1st low crossing at 2.249.
CURRENCIES? http://quotes.ino.com/ex?changes/?c=currencies ""
The September Dollar closed slightly higher on Monday as it extends the rally off July's low. The high-range close sets the stage for a steady to higher opening when Tuesday's session begins trading. Stochastics and the RSI are becoming overbought but remain neutral to bullish signaling that sideways to higher prices are possible near-term. If September extends the rally off July's low, the 50-day moving average crossing at 102.142 is the next upside target. Closes below last-Thursday's low crossing at 100.320 would signal that a short-term top has been posted. First resistance is last-Friday's high crossing at 101.825. Second resistance is the 50-day moving average crossing at 102.142. First support is last-Thursday's low crossing at 100.320. Second support is July's low crossing at 99.220.
The September Euro closed slightly lower on Monday leaving last-Friday's upside reversal unconfirmed. The low-range close sets the stage for a steady to lower opening when Tuesday's day session begins trading. Stochastics and the RSI remain neutral to bearish signaling that sideways to lower prices are possible near-term. If September extends the decline off July's high, the 50-day moving average crossing at $1.09651 is the next downside target. Closes above last-Thursday's high crossing at 1.11770 would temper the near-term bearish outlook. First resistance is July's high crossing at $1.13105. Second resistance is the March 30th high crossing at 1.15190. First support is last-Friday's low crossing at 1.10490. Second support is the 50-day moving average crossing at $1.09651.
The September British Pound closed slightly lower on Monday leaving last-Friday's upside reversal unconfirmed. The low-range close sets the stage for a steady to lower opening when Tuesday's day session begins trading. Stochastics and the RSI are neutral to bearish signaling sideways to lower prices are possible near-term. If September extends the decline off July's high, the 50-day moving average crossing at 1.2705 is the next downside target. Closes above last-Thursday's high crossing at 1.2999 would signal that a short-term low has been posted. First resistance is last-Thursday's high crossing at 1.2999. Second resistance is the July 14th high crossing at 1.3146. First support is last-Friday's low crossing at 1.2765. Second support is the 50-day moving average crossing at 1.2705.
The September Swiss Franc closed slightly lower on Monday confirming last-Thursday's key reversal down. The low-range close sets the stage for a steady to lower opening when Tuesday's day session begins trading. Stochastics and the RSI are neutral to bearish signaling that sideways to lower prices are possible near-term. Closes below the 20-day moving average crossing at 1.15428 would confirm that a short-term top has been posted. If September renews the rally off May's low, the January 2019 high crossing at 1.18680 is the next upside target. First resistance is the July 18th high crossing at 1.17650. Second resistance is the January 2019 high crossing at 1.18680. First support is the 20-day moving average crossing at 1.15428. Second support is the 50-day moving average crossing at 1.13458.
The September Canadian Dollar posted a key reversal up as it closed higher on Monday. The high-range close sets the stage for a steady to higher opening when Tuesday's day session begins trading. Stochastics and the RSI are neutral to bearish signaling that sideways to lower prices are possible near-term. If September extends the decline off July's high, the 50-day moving average crossing at 75.27 is the next downside target. If September renews the rally off the January 7th low, the September 12th 2022 high crossing at 77.11 is the next upside target. First resistance is the 38% retracement level of the 2021-2022 decline crossing at 76.28. Second resistance is the September 12th high crossing at 77.11. First support is today's low crossing at 75.97. Second support is the 50-day moving average crossing at 75.27.
The September Japanese Yen closed lower on Monday confirming last-Friday's key reversal down as it extended the decline off July's high. The low-range close sets the stage for a steady to lower opening when Tuesday’s day session begins trading. Stochastics and the RSI have turned neutral to bearish signaling that sideways to lower prices are possible near-term. If September extends the decline off July's high, June's low crossing at 0.069755 is the next downside target. If September resumes the rally off June's low, the 38% retracement level of the January-June decline crossing at 0.074017 is the next upside target. First resistance is July's high crossing at 0.073585. Second resistance is the 38% retracement level of the January-June decline crossing at 0.074017 is the next upside target. First support is today's low crossing at 0.070615. Second support is June's low crossing at 0.069755.
PRECIOUS METALS? http://quotes.ino.com/ex?changes/?c=metals ""
August gold closed higher on Monday. The high-range close sets the stage for a steady to higher opening when Tuesday's day session begins trading. Stochastics and the RSI are neutral to bearish signaling that sideways to lower prices are possible near-term. If August extended last-Thursday's decline, June's low crossing at $1911.40 is the next downside target. If August renews the rally off June's low, June's high crossing at $2000.70 is the next upside target. First resistance is June's high crossing at $2000.70. Second resistance is the 62% retracement level of the May-June decline crossing at $2025.20. First support is last-Thursday's low crossing at $1941.70. Second support is June's low crossing at $1911.40.
September silver closed sharply higher on Monday as it consolidated some of last-Thursday's decline. The high-range close sets the stage for a steady to higher opening when Tuesday's day session begins trading. Stochastics and the RSI are neutral to bearish signaling that sideways to lower prices are possible near-term. Closes below the 50-day moving average crossing at 23.952 would signal that a short-term top has been posted. If July renews the rally off June's low, the 75% retracement level of the April-June decline crossing at 25.561 is the next upside target. First resistance is July's high crossing at 25.475. Second resistance is the 75% retracement level of the April-June decline crossing at 25.561. First support is the 20-day moving average crossing at 24.369. Second support is the 50-day moving average crossing at 23.952.
September copper closed sharply higher on Monday as it extends the rally off May's low. The high-range close sets the stage for a steady to higher opening when Tuesday's day session begins trading. Stochastics and the RSI are neutral to bullish signaling that sideways to higher prices are possible near-term. If September extends the rally off June's low, April's high crossing at 4.1825 is the next upside target. Closes below the 50-day moving average crossing at 3.8002 would signal that a short-term top has been posted. First resistance is today's high crossing at 4.0155. Second resistance is April's high crossing at 4.1825. First support is the 20-day moving average crossing at 3.8492. Second support is the 50-day moving average crossing at 3.8002.
GRAINS? http://quotes.ino.com/ex?changes/?c=grains "
December Corn closed down $0.17 1/4-cents at $5.13.
December corn closed sharply lower on Monday as it extends the decline off July's high. The low-range close sets the stage for a steady to lower opening when Tuesday's night session begins trading. Stochastics and the RSI are bearish signaling that sideways to lower prices are possible near-term. If December extends the decline off July's high, the July 18th low crossing at $5.02 is the next downside target. Closes above the 10-day moving average crossing at $5.43 1/2 would signal that a short-term low has been posted. First resistance is the 10-day moving average crossing at $5.43 1/2. Second resistance is the 62% retracement level of the June-July decline crossing at $5.73. First support is the July 18th low crossing at $5.02. Second support is July's low crossing at $4.81.
September wheat closed down $0.38 1/2-cents at $6.65 3/4.
September wheat closed sharply lower on Monday as it extended the decline off last-Tuesday's high. The low-range close sets the stage for a steady to lower opening when Tuesday's day session begins trading. Stochastics and the RSI are neutral to bearish signaling that sideways to lower prices are possible near-term. If September extends the decline off July's high, July's low crossing at $6.22 is the next downside target. Closes above the 10-day moving average crossing at $7.14 1/4 would signal that a short-term low has been posted. First resistance is the 10-day moving average crossing at $7.14 1/4. Second resistance is last-Tuesday's high crossing at $7.77 1/4. First support is the 50-day moving average crossing at $6.67 1/4. Second support is July's low crossing at $6.22.
September Kansas City Wheat closed down $0.43 1/2-cents at $8.12 3/4.
September Kansas City wheat closed sharply lower on Monday as it extended the decline off last-Tuesday's high. The low-range close sets the stage for a steady to lower opening when Tuesday's day session begins trading. Stochastics and the RSI are bearish signaling that sideways to lower prices are possible near-term. If September extends the decline off July's high, July's low crossing at $7.87 1/4 is the next downside target. Closes above the 10-day moving average crossing at $8.66 would signal that a short-term low has been posted. First resistance is the 50-day moving average crossing at $8.26 3/4. Second resistance is the 10-day moving average crossing at $8.66. First support is the July 12th low crossing at $7.92. Second support is July's low crossing at $7.87 1/4.
September Minneapolis wheat closed down $0.40 1/4-cents crossing at $8.55 3/4.
September Minneapolis wheat closed sharply lower on Monday as it extended the decline off July's high. The low-range close sets the stage for a steady to lower opening when Tuesday's day session begins trading. Stochastics and the RSI are bearish signaling that sideways to lower prices are possible near-term. If September extends the decline off July's high, the 50-day moving average crossing at $8.45 1/2 is the next downside target. Closes above the 10-day moving average crossing at $8.98 1/4 would signal that a short-term low has been posted. First resistance is the 20-day moving average crossing at $8.77 1/4. Second resistance is the 10-day moving average crossing at $8.98 1/4. First support is the 50-day moving average crossing at $8.45 1/2. Second support is July's low crossing at $8.07 1/4.
SOYBEAN COMPLEX? http://quotes.ino.com/ex?changes/?c=grains "
November soybeans closed down $0.50 3/4-cents at $13.31 3/4.
November soybeans gapped down and closed sharply lower on Monday as it extends the decline off last-Monday's high. The low-range close sets the stage for a steady to lower opening when Tuesday's day session begins trading. Stochastics and the RSI are bearish signaling that sideways to lower prices are possible near-term. If November extends the aforementioned decline, the 50-day moving average crossing at $12.91 1/4 is the next downside target. Closes above the 10-day moving average crossing at $13.98 1/2 would signal that a short-term low has been posted. First resistance is today's gap crossing at $13.79. Second resistance is last-Monday's high crossing at $14.35. First support is the July 7th low crossing at $13.15 1/2. Second support is the 50-day moving average crossing at $12.91 1/4.
December soybean meal closed down $9.90 at $395.90.
December soybean meal gapped down and closed sharply lower on Monday. The low-range close sets the stage for a steady to lower opening when Tuesday's day session begins trading. Stochastics and the RSI have turned bearish signaling that sideways to lower prices are possible near-term. If December extends the decline off last-Thursday's high, the 50-day moving average crossing at $390.40 is the next downside target. Closes above the 10-day moving average crossing at $411.30 would signal that a short-term low has been posted. First resistance is the 10-day moving average crossing at $411.30. Second resistance is the 87% retracement level of the March-May decline crossing at $428.00. First support is the 50-day moving average crossing at $390.40. Second support is the July 7th low crossing at $384.70.
December soybean oil closed down 241-pts. at 59.99.
December soybean oil closed sharply lower on Monday and below the 20-day moving average crossing at 61.24 signaling that a short-term top has been posted while opening the door for additional weakness near-term. The low-range close sets the stage for a steady to lower opening when Tuesday's day session begins trading. Stochastics and the RSI are bearish signaling that sideways to lower prices are possible near-term. If December extends the decline off July's high, the 50-day moving average crossing at 55.46 is the next downside target. If December renews the rally off May's low, the 87% retracement level of the 2022-2023 decline crossing at 68.81 is the next upside target. First resistance is last-Monday's high crossing at 65.58. Second resistance is the 87% retracement level of the 2022-2023 decline crossing at 68.81. First support is the July 10th low crossing at 58.39. Second support is the 50-day moving average crossing at 55.46.
LIVESTOCKhttp://quotes.ino.com/exchanges/?c=livestock
October hogs closed up $0.98 at $86.00.
October hogs closed higher on Monday as it extended the rally off May's low. The high-range close sets the stage for a steady to higher opening when Tuesday's day session begins trading. Stochastics and the RSI are neutral to bullish signaling that sideways to higher prices are possible near-term. If October extends the rally off May's low, the 75% retracement level of the April-May decline crossing at $87.50 is the next upside target. Closes below the 20-day moving average crossing at $82.80 would signal that a short-term top has been posted. First resistance is today's high crossing at $86.25. Second resistance is the 75% retracement level of the April-May decline crossing at $87.50. First support is the 20-day moving average crossing at $82.80. Second support is the 50-day moving average crossing at $79.18.
October cattle closed down $0.08 at $179.53.
October cattle closed lower on Monday. The high-range close sets the stage for a steady to slightly lower opening on Tuesday. Stochastics and the RSI are oversold but remain neutral to bearish signaling that sideways to lower prices are possible near-term. If October extends the decline off July's high, the 50-day moving average crossing at $176.44 is the next downside target. If October renews this year's rally into uncharted territory, upside targets will be hard to project. First resistance is July's high crossing at $185.75. Second resistance is unknown. First support is the 50-day moving average crossing at $176.44. Second support is the June 21st low crossing at $171.83.
October Feeder cattle closed unchanged at $251.00.
October Feeder cattle closed unchanged on Monday as it extends July's trading range. The mid-range close sets the stage for a steady opening when Tuesday's day session begins trading. Stochastics and the RSI are turning neutral to bullish signaling that sideways to higher prices are possible near-term. If October renews the rally off June's low into uncharted territory, upside targets will be hard to project. Closes below the July 6th low crossing at $246.03 would mark a downside breakout of the aforementioned trading range. First resistance is July's high crossing at $256.00. Second resistance is unknown. First support is the July 6th low crossing at $246.03. Second support is the 50-day moving average crossing at $245.63.
FOOD & FIBERhttp://quotes.ino.com/ex changes/?c=food
September coffee closed higher on Monday. The high-range close sets the stage for a steady to higher opening on Tuesday. Stochastics and the RSI are turning neutral to bullish signaling sideways to higher prices are possible near-term. If September extends the rally off July's low, the 50-day moving average crossing at $17.03 is the next upside target. If September resumes the decline off June's high, the 87% retracement level of the January-April rally crossing at $15.20 is the next downside target. First resistance is today's high crossing at $16.60. Second resistance is the June 27th high crossing at $16.79. First support is July's low crossing at $15.51. Second support is the 87% retracement level of the January-April rally crossing at $15.20.
September cocoa closed slightly higher on Monday. The mid-range close sets the stage for a steady to higher opening on Tuesday. Stochastics and the RSI are overbought but remain neutral to bullish signaling that sideways to higher prices are possible near-term. If September extends the rally off March's low, monthly resistance crossing at 37.75 is the next upside target. Closes below the 20-day moving average crossing at 34.02 would confirm that a short-term top has been posted.
October sugar closed slightly higher on Monday. The high-range close sets the stage for a steady to higher opening on Tuesday. Stochastics and the RSI are neutral to bearish signaling that sideways to lower prices are possible near-term. Multiple closes below the 20-day moving average crossing at 24.04 would signal that a short-term top has been posted. If October renews the rally off June's low, June's high crossing at 26.19 is the next upside target.
December cotton closed higher on Monday as it trading both sides of neutral. The mid-range close sets the stage for a steady to higher opening on Tuesday. Stochastics and the RSI are bearish signaling sideways to lower prices are possible near-term. Closes below the 20-day moving average crossing at 82.95 would confirm that a short-term top has been posted. If December renews the rally off June's low, the 75% retracement level of the May-July decline crossing at 91.29 is the next upside target.
Thanks tallpine!
The breakaway bearish gap lower started the selling that continued all day. It was also a WEEKLY gap lower. Very powerful negative/bearish chart formations.
Too much rain in the forecast for dry spots in a key developmental stage.
https://www.marketforum.com/forum/topic/97726/
https://www.marketforum.com/forum/topic/97756/
Latest models next page
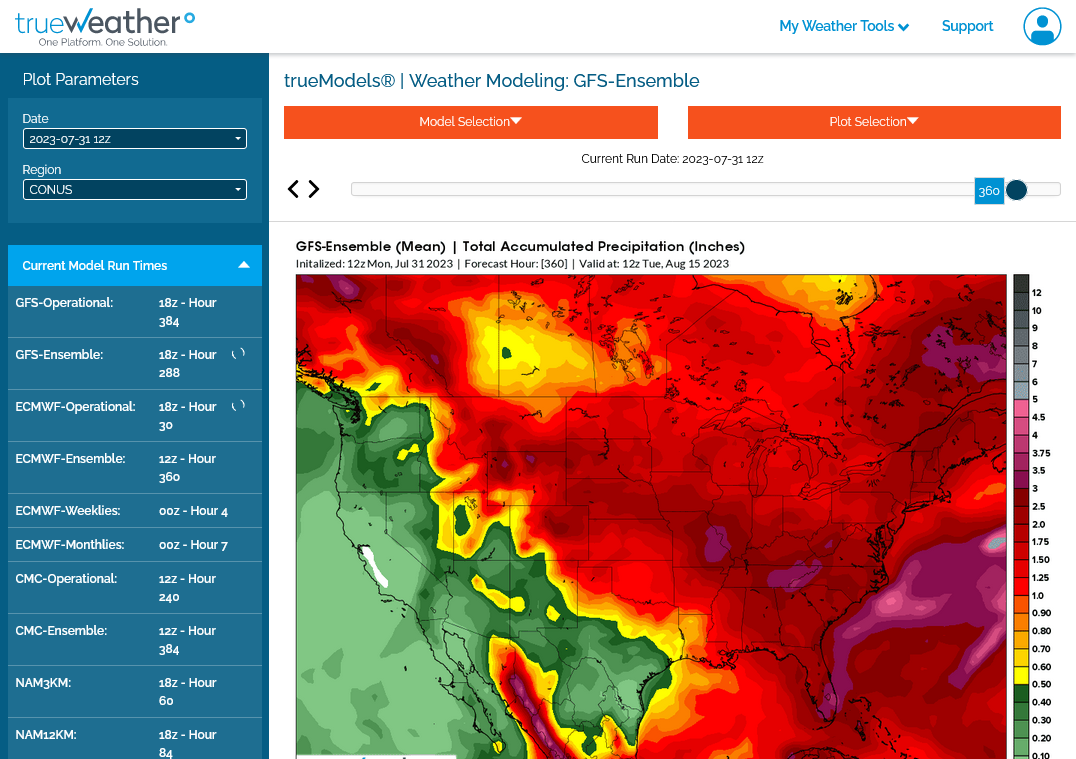
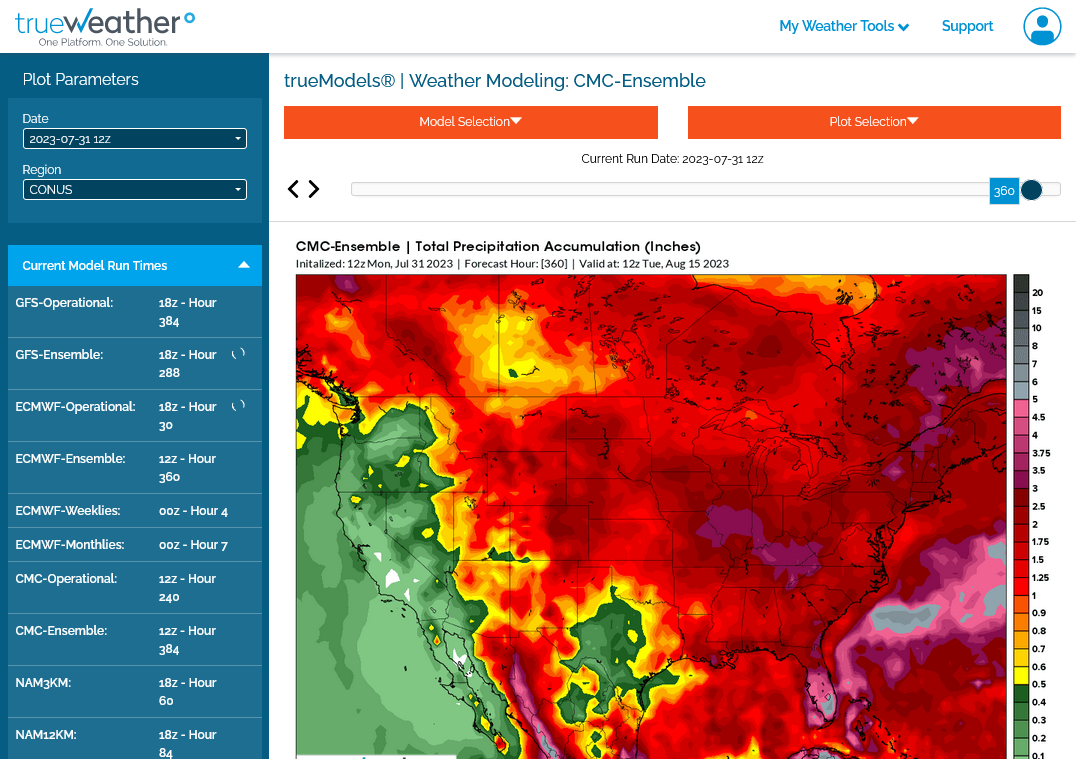
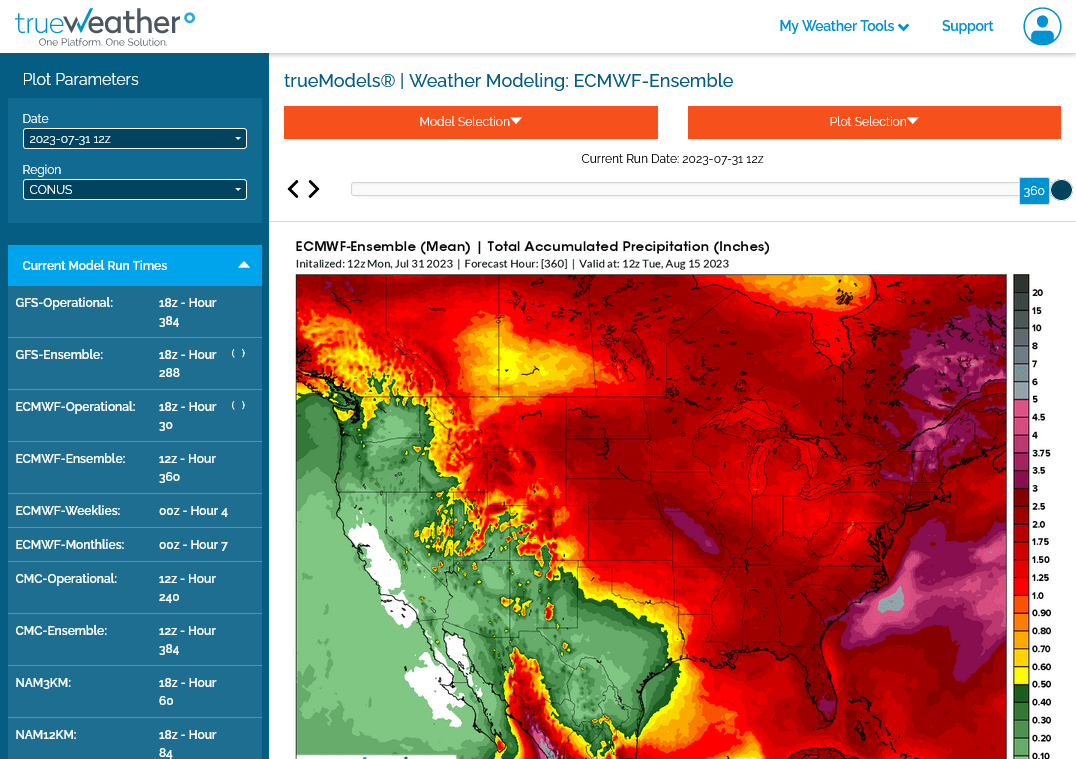
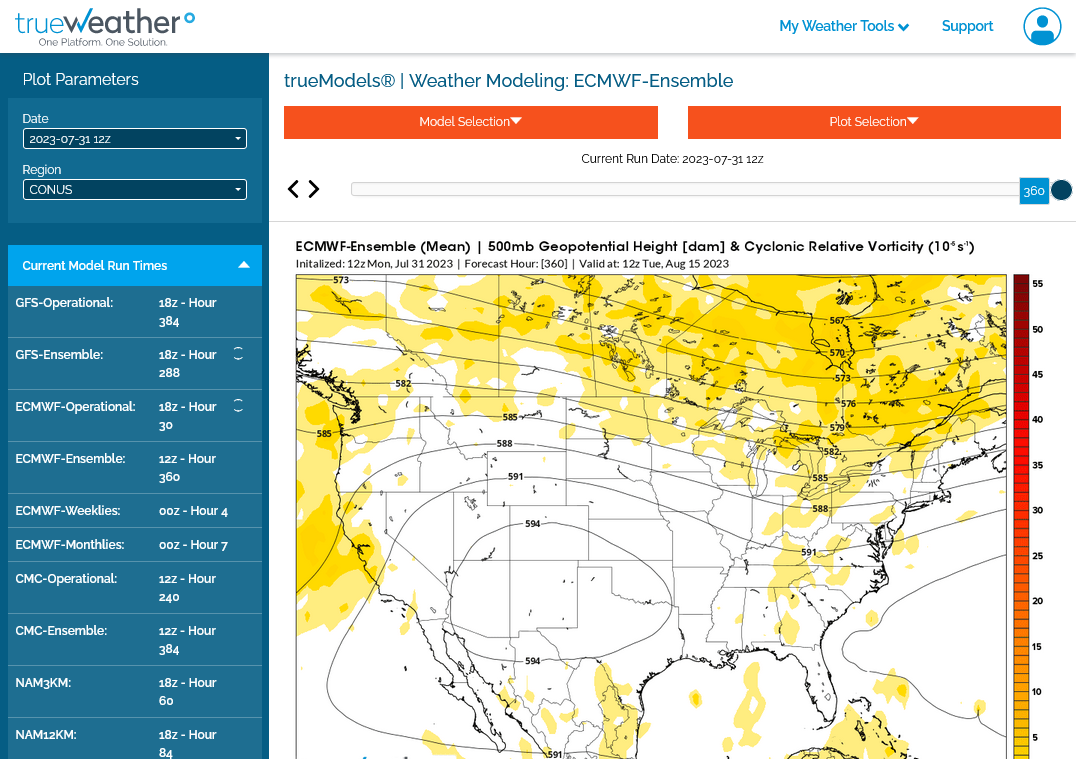
Maps from the last model runs.
1. 12z GEFS 2 week rains-2+ inches in the dark reds
2. Canadian model rains-especially wet
3. European model rains-northeast belt gets less but the rest is pretty wet
4. Upper levels European model-Heat dome southwest to TX. Bermuda High trying to build into the Southeast. Northwest flow in the Midwest with perturbations coming over the periphery of the heat ridge and dumping heavy rains.