KEY EVENTS TO WATCH FOR:
Friday, July 28, 2023
8:30 AM ET. June Personal Income and Outlays
Personal Income, M/M% (previous +0.4%)
Consumer Spending, M/M% (previous +0.1%)
PCE Price Idx, M/M% (previous +0.1%)
PCE Price Idx, Y/Y% (previous +3.8%)
PCE Core Price Idx, M/M% (previous +0.3%)
PCE Core Price Idx, Y/Y% (previous +4.6%)
8:30 AM ET. 2nd Quarter Employment Cost Index
ECI, Q/Q% (previous +1.2%)
ECI, Y/Y% (previous +4.8%)
10:00 AM ET. July University of Michigan Survey of Consumers - final
End-Mo Sentiment Idx (previous 64.4)
End-Mo Expectations Idx (previous 61.5)
12-Month Inflation Forecast (previous 3.3%)
5-Year Inflation Forecast (previous 3.0%)
End-Mo Current Idx (previous 69.0)
3:00 PM ET. June Agricultural Prices
Farm Prices, M/M% (previous -2.8%)
The STOCK INDEXES? http://quotes.ino.com/ex?changes/?c=indexes
The STOCK INDEXES: The September NASDAQ 100 was higher overnight as it extends this week's trading range. Overnight trading sets thestage a higher opening when the day session begins trading. Stochastics and the RSI are turning neutral to bullish signaling that sideways to higher prices are possible near-term. If September renews this year's rally, the December-2021 high on the weekly continuation chart crossing at 16,659.50 is the next upside target. Closes below the 20-day moving average crossing at 15,540.34 would confirm that a short-term top has been posted. First resistance is last-Wednesday's high crossing at 16,062.75. Second resistance is the December-2021 high on the weekly continuation chart crossing at 16,659.50. First support is the 20-day moving average crossing at 15,540.34. Second support is the 50-day moving average crossing at 15,032.98.
The September S&P 500 was was higher overnight as it consolidated some of Thursday's loss. Overnight trading sets the stage for a higher opening when the day session begins trading. Stochastics and the RSI are overbought and are turning neutral to bearish signaling that sideways to lower prices are possible near-term. If June extends the rally off March's low, the 87% retracement level of the 2022 decline crossing at 4639.07 is the next upside target. Closes below the 20-day moving average crossing at 4532.04 would confirm that a short-term top has been posted. First resistance is Thursday's high crossing at 4634.50. Second resistance is the 87% retracement level of the 2022 decline crossing at 4639.07. First support is the 20-day moving average crossing at 4532.07. Second support is the 50-day moving average crossing at 4412.35.
INTEREST RATES http://quotes.ino.com/ex changes/?c=interest"
INTEREST RATES: September T-bonds was slightly higher overnight and sets the stage for a higher opening when the day session begins trading. Stochastics and the RSI are neutral to bearish signaling that sideways to lower prices are possible near-term. If September extends the decline off last-Wednesday's high, July's low crossing at 122-30 is the next downside target. Closes above the 50-day moving average crossing at 126-24 would signal that a short-term low has been posted. First resistance is the 10-day moving average crossing at 125-30. Second resistance is the 50-day moving average crossing at 126-24. First support is the overnight low crossing at 123-09. Second support is July's low crossing at 122-30.
September T-notes were higher overnight and sets the stage for a higher opening when the day session begins trading. Stochastics and the RSI remain neutral to bearish signaling that sideways to lower prices are possible near-term. If September extends the decline off last-Tuesday's high, July's low crossing at 110.050 is the next downside target. Closes above the 10-day moving average crossing at 112.033 would signal that a short-term low has been posted. First resistance is the 50-day moving average crossing at 112.297. Second resistance is the 50% retracement level of the April-July decline crossing at 113.313. First support is the overnight low crossing at 110.255. Second support is July's low crossing at 110.050.
ENERGY MARKETS? http://quotes.ino.com/ex?changes/?c=energy ""
ENERGIES:Septembercrude oil was slightly lower overnight and is working on a possible inside day. Overnight trading sets the stage for a slightly lower opening when the day session begins trading. Stochastics and the RSI are overbought but remain neutral to bullish signaling that sideways to higher prices are possible near-term. If September extends the rally off the June 28th low, April's high crossing at $81.44 is the next upside target. Closes below the 20-day moving average crossing at $75.41 would signal that a short-term top has been posted. First resistance is Thursday's high crossing at $80.60. Second resistance is April's high crossing at $81.44. First support is the 10-day moving average crossing at 77.48. Second support is the 20-day moving average crossing at $75.41.
September heating oil was slightly lower overnight as it consolidates some of Thursday's rally. Overnight trading sets the stage for a slightly lower opening when the day session begins trading. Stochastics and the RSI are overbought but remain neutral to bullish signaling that sideways to higher prices are possible near-term. If September extends the rally off May's low, the 75% retracement level of the 2022-2023 decline crossing at 3.0002 is the next upside target. Closes below the 20-day moving average crossing at 2.6284 would signal that a short-term top has been posted. First resistance is Thursday's high crossing at 2.9153. Second resistance is the 75% retracement level of the 2022-2023 decline crossing at 2.6011. First support is the 10-day moving average crossing at 2.7358. Second support is the 20-day moving average crossing at 2.6284.
September unleaded gas was slightly lower overnight. Overnight trading sets the stage for a slightly lower opening when the day session begins trading. Stochastics and the RSI are overbought but remain neutral to bullish signaling that sideways to higher prices are possible near-term. If September extends the rally off the June 23rd low, the October-2022 high on the weekly continuation chart crossing at 3.0221 is the next upside target. Closes below the 20-day moving average crossing at 2.6327 would signal that a short-term top has been posted. First resistance is Thursday's high crossing at $2.8955. Second resistance is the October-2022 high on the weekly continuation chart crossing at $3.0221. First support is the 10-day moving average crossing at $2.7554. Second support is the 20-day moving average crossing at $2.6327.
September natural gas was slightly lower overnight and sets the stage for a slightly lower opening when the day session begins trading. Stochastics and the RSI are bearish signaling that sideways to lower prices are possible near-term. If September extends this week's decline, the July 17th low crossing at 2.477 is the next downside target. If September renews the rally off the July 17th low, the June 26th high crossing at 2.911 is the next upside target. First resistance is the June 26th high crossing at 2.911. Second resistance is the 25% retracement level of the 2022-2023 decline crossing at 3.193. First support is the July 17th low crossing at 2.477. Second support is the June 1st low crossing at 2.249.
CURRENCIEShttp://quotes.ino.com/ex changes/?c=currencies"
CURRENCIES:The September Dollar was lower overnight as it consolidates some of Thursday's rally. Overnight trading sets the stage for a lower opening when the day session begins trading later this morning. Stochastics and the RSI are neutral to bullish signaling that sideways to higher prices are possible near-term. If September extends the rally off July's low, the 50-day moving average crossing at $102.162 is the next upside target. Closes below Thursday's low crossing at $100.320 would temper the near-term friendly outlook in the market. First resistance is the overnight high crossing at $101.825. Second resistance is the 50-day moving average crossing at $102.161. First support is Thursday's low crossing at $100.320. Second support is July's low crossing at $99.220.
The September Euro was higher overnight as it consolidates some of the decline off last-Tuesday's high. Overnight trading sets the stage for a higher opening when the day session begins trading. Stochastics and the RSI remain neutral to bearish signaling that sideways to lower prices are possible near-term. If September extends the decline off last-Tuesday's high, the 50-day moving average crossing at 1.09625 is the next downside target. Closes above the 10-day moving average crossing at $1.11442 would temper the near-term bearish outlook in the market. First resistance is the 10-day moving average crossing at $1.11442. Second resistance is the July 18th high crossing at $1.13105. First support is the overnight low crossing at 1.09700. Second support is the 50-day moving average crossing at 1.09626.
The September British Pound was higher overnight as it consolidates some of the decline off July's high. Overnight trading and sets the stage for a higher opening when the day session begins trading. Stochastics and the RSI are neutral to bearish signaling that sideways to lower prices near-term. If September extends this month's decline, the 50-day moving average crossing at 1.2699 is the next downside target. Closes below Thursday's high crossing at 1.2999 would signal that a short-term low has been posted. First resistance is the July 14th high crossing at 1.3146. Second resistance is the 75% retracement level of the 2022-2023 decline crossing at 1.3253. First support is the 50-day moving average crossing at 1.2699. Second support is the June 29th low crossing at 1.2594.
The September Swiss Franc was slightly higher overnight and sets the stage for a higher opening when the day session begins trading. Stochastics and the RSI are neutral to bearish signaling that sideways to lower prices are possible near-term. If September resumes the rally off May's low, the January 2019 high crossing at 1.18680 is the next upside target. Closes below the 20-day moving average crossing at 1.15302 would signal that a short-term top has been posted. First resistance is the July 18th high crossing at 1.17650. Second resistance is the January 2019 high crossing at 1.18680. First support is the 20-day moving average crossing at 1.15302. Second support is the 50-day moving average crossing at 1.13410.
The September Canadian Dollar was higher overnight as it extends the trading range of the past three-week's and sets the stage for a higher opening when the day session begins trading. Stochastics and the RSI are neutral to bearish signaling that sideways to lower prices are possible near-term. Closes below the July 18th low crossing at $75.57 would signal that a short-term top has been posted. If September renews the rally off July's low, the September-12th -2022 high crossing at $77.11 is the next upside target. First resistance is the 38% retracement level of the 2022-2023 decline crossing at $76.28. Second resistance is the September-12th -2022 high crossing at $77.11. First support is the July 18th low crossing at $75.57. Second support is the 50-day moving average crossing at $75.25.
The September Japanese Yen was slightly higher overnight and is working on a possible key reversal up. Overnight trading sets the stage for a slightly higher opening when the day session begins trading. Stochastics and the RSI have turned neutral to bullish signaling that sideways to higher prices are possible near-term. If September renews the rally off July's low, the July 14th high crossing at 0.073585 is the next upside target. If September extends the decline off the July 14th high, June's low crossing at 0.069755 is the next downside target. First resistance is the July14th high crossing at 0.073585. Second resistance is the 38% retracement level of the January-June decline crossing at 0.074017. First support is the overnight low crossing at 0.070640. Second support is June's low crossing at 0.069755.
PRECIOUS METALS http://quotes.ino.com/ex changes/?c=metals"
Precious Metals: Augustgold was higher overnight and is working on a possible inside day. Overnight trading sets the stage for a higher opening when the day session begins trading later this morning. Stochastics and the RSI have turned neutral to bearish signaling that sideways to lower prices are possible near-term. If August renews the rally off June's low, the 50% retracement level of the May-June decline crossing at $2001.40 is the next upside target. Thursday's close below the 20-day moving average crossing at $1952.10 signal that a short-term top has been posted. First resistance is the July 20th high crossing at $1989.80. Second resistance is the 50% retracement level of the May-June decline crossing at $2001.40. First support is Thursday's low crossing at $1941.70. Second support is June's low crossing at $1900.60.
September silver was steady to slightly higher overnight. Overnight trading sets the stage for a slightly higher opening when the day session begins trading later this morning. Stochastics and the RSI are neutral to bearish signaling that sideways to lower prices are possible near-term. Closes below the 50-day moving average crossing at $23.935 would signal that a short-term top has been posted. If July resumes the rally off June's low, the 75% retracement level of the May-June decline crossing at $25.561 is the next upside target. First resistance is last-Thursday's high crossing at $25.475. Second resistance is the 75% retracement level of the May-June decline crossing at 25.561. First support is the 20-day moving average crossing at $24.273. Second support is the 50-day moving average crossing at $23.935.
September copper was higher overnight and sets the stage for a higher opening when the day session begins trading. Stochastics and the RSI are neutral to bullish signaling that sideways to higher prices are possible near-term. If September renews the rally off the June 29th low, June's high crossing at 3.9640 is the next upside target. Closes below the 50-day moving average crossing at 3.7950 would signal that a short-term top has been posted. First resistance June's high crossing at 3.9640. Second resistance is May's high crossing at 4.0100. First support is the 50-day moving average crossing at 3.7950. Second support is the June 29th low crossing at 3.6830.
GRAINS http://quotes.ino.com/ex changes/?c=grains
Grains: December corn was lower overnight as it extends the decline off Monday's high. Overnight trading sets the stage for a lower opening when the day sessions begins trading. Stochastics and the RSI have turned neutral to bearish signaling that sideways to lower prices are possible near-term. Closes below last-Friday's low crossing at $5.31 1/4 would signal that a short-term top has been posted. If December renews the rally off July's low, the 75% retracement level of the June-July decline crossing at $5.92 3/4 is the next upside target. First resistance is the 62% retracement level of the June-July decline crossing at $5.73. Second resistance is the 75% retracement level of the June-July decline crossing at $5.92 3/4. First support is last-Friday's low crossing at $5.31 1/4. Second support is the 20-day moving average crossing at $5.20 3/4.
September wheat was lower overnight as it extends the decline off Tuesday's high. Overnight trading sets the stage for a lower opening when the day session begins trading. Stochastics and the RSI have turned neutral to bearish signaling that sideways to lower prices are possible near-term. Closes below last-Friday's low crossing at $6.93 1/2 would confirm that a short-term top has been posted. If September renews the rally off July's low, the 38% retracement level of the 2022-2023 decline crossing at $7.95 1/4 is the next upside target. First resistance is Tuesday's high crossing at $7.77 1/4. Second resistance is the 38% retracement level of the 2022-2023 decline crossing at $7.95 1/4. First support is last-Friday's low crossing at $6.93 1/2. Second support is the 20-day moving average crossing at $6.82.
September Kansas City wheat was lower overnight as it extends this week's losses. Overnight trading sets the stage for a lower opening when the day session begins trading later this morning. Stochastics and the RSI are bearish signaling that sideways to lower prices are possible near-term. Closes below the 10-day moving average crossing at $8.66 would temper the near-term friendly outlook. If September renews this month's rally, the 50% retracement level of the 2022-2023 decline crossing at $9.46 3/4 is the next upside target. First resistance is Tuesday's high crossing at $9.29 3/4. Second resistance is the 50% retracement level of the 2022-2023 decline crossing at $9.46 3/4. First support is the 10-day moving average crossing at $8.66. Second support is the 20-day moving average crossing at $8.41 1/2.
September Minneapolis wheat was lower overnight and sets the stage for a lower opening when the day session begins trading. Stochastics and the RSI have turned neutral to bearish signaling that sideways to lower prices are possible near-term. Closes below the 20-day moving average crossing at $8.75 1/4 would confirm that a short-term top has been posted. If September renews the rally off July's low, the 50% retracement level of the 2022-2023 decline crossing at $9.60 3/4 is the next upside target. First resistance is Tuesday's high crossing at $9.47 3/4. Second resistance is the 50% retracement level of the 2022-2023 decline crossing at $9.60 3/4. First support is the 20-day moving average crossing at $8.75 1/4. Second support is the 50-day moving average crossing at $8.45 1/2.
SOYBEAN COMPLEX? http://quotes.ino.com/ex?changes/?c=grains "
November soybeans were lower overnight and sets the stage for a lower opening when the day session begins trading later this morning. Stochastics and the RSI are overbought and are turning neutral to bearish signaling that sideways to lower prices are possible near-term. Closes below the 20-day moving average crossing at $13.76 would signal that a short-term top has been posted. If November extends the rally off May's low, the May-2022 high crossing at $14.48 1/4 is the next upside target. First resistance is Monday's high crossing at $14.35. Second resistance is the May-2022 high crossing at $14.48 1/4. First support is the 20-day moving average crossing at $13.76. Second support is the July 7th low crossing at $13.15 1/2.
December soybean meal was lower overnight and sets the stage for a lower opening when the day session begins trading. Stochastics and the RSI are overbought, diverging and are turning neutral to bearish signaling that sideways to lower prices are possible near-term.Closes below the 20-day moving average crossing at $403.70 would confirm that a short-term top has been posted. If December resumes the rally off the June 29th low, the 87% retracement level of the March-May decline crossing at $428.00 is the next upside target.First resistance is the 75% retracement level of the March-May decline crossing at $418.80. Second resistance is the 87% retracement level of the March-May decline crossing at $428.00. First support is the 20-day moving average crossing at $403.70. Second support is the 50-day moving average crossing at $390.30.
December soybean oil was slightly higher in overnight trading as it consolidates some of its recent losses. Overnight trading sets the stage for a slightly higher opening when the day session begins trading. Stochastics and the RSI are bearish signaling that sideways to lower prices are possible near-term. Closes below the 20-day moving average crossing at 61.17 would signal that a short-term top has been posted. If December extends the rally off May's low, the 87% retracement level of the 2022-2023 decline crossing at 68.81 is the next upside target. First resistance is the 75% retracement level of the 2022-2023 decline crossing at 65.45. Second resistance is the 87% retracement level of the 2022-2023 decline crossing at 68.81. First support is the 20-day moving average crossing at 61.17. Second support is the July 7th low crossing at 58.20.
Thanks much, tallpine!
Rain amounts went up in the forecast overnight. Wheat getting clobbered isn't helping either.
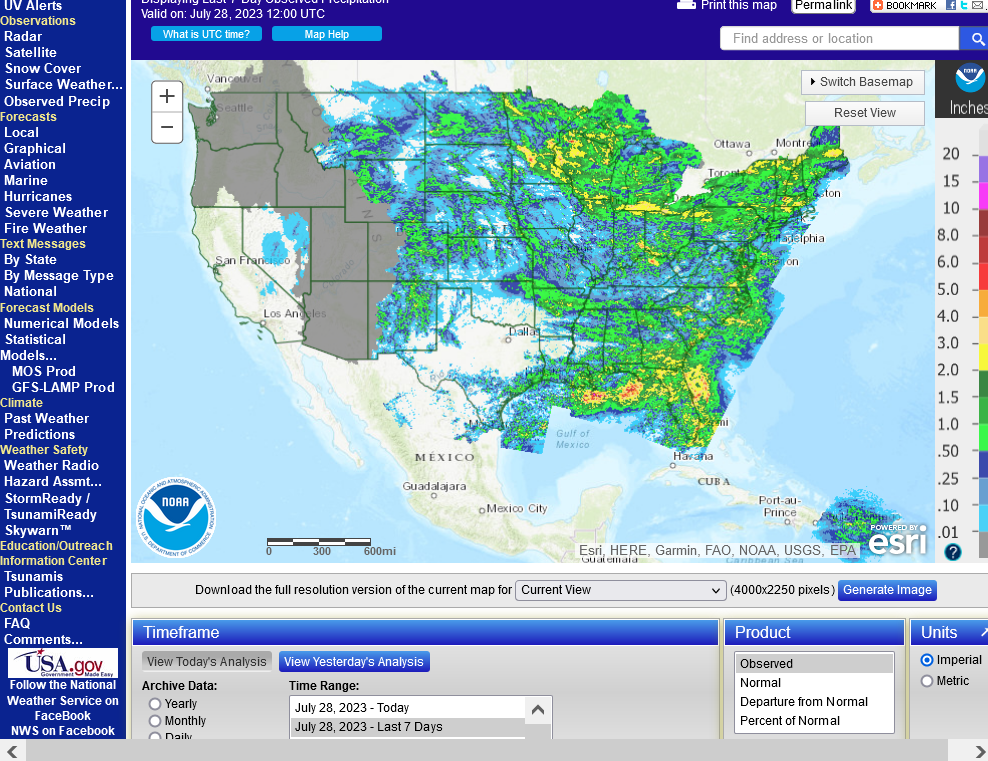
Check out rain amounts up to the last 72 hours here(scroll to your location and pick the time frame):
To see rain amounts, go here: https://www.iweathernet.com/total-rainfall-map-24-hours-to-72-hours
1. Rains the last 24 hours
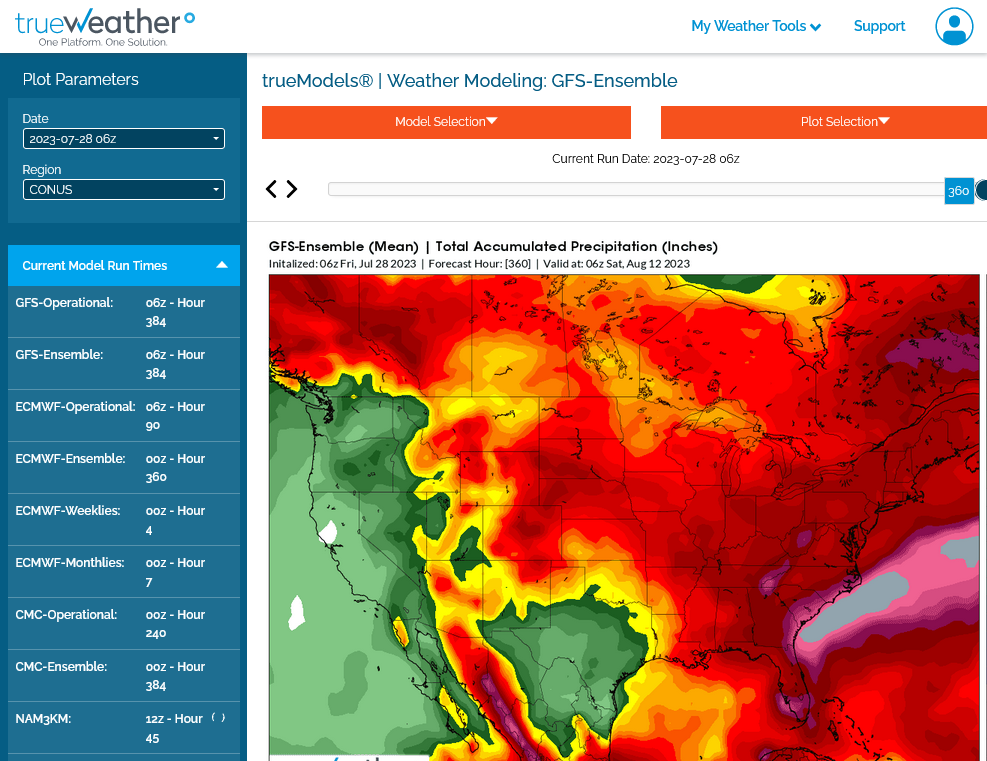
2. Rains the next 2 weeks GEFS-driest model. Added alot of rains from earlier this week.
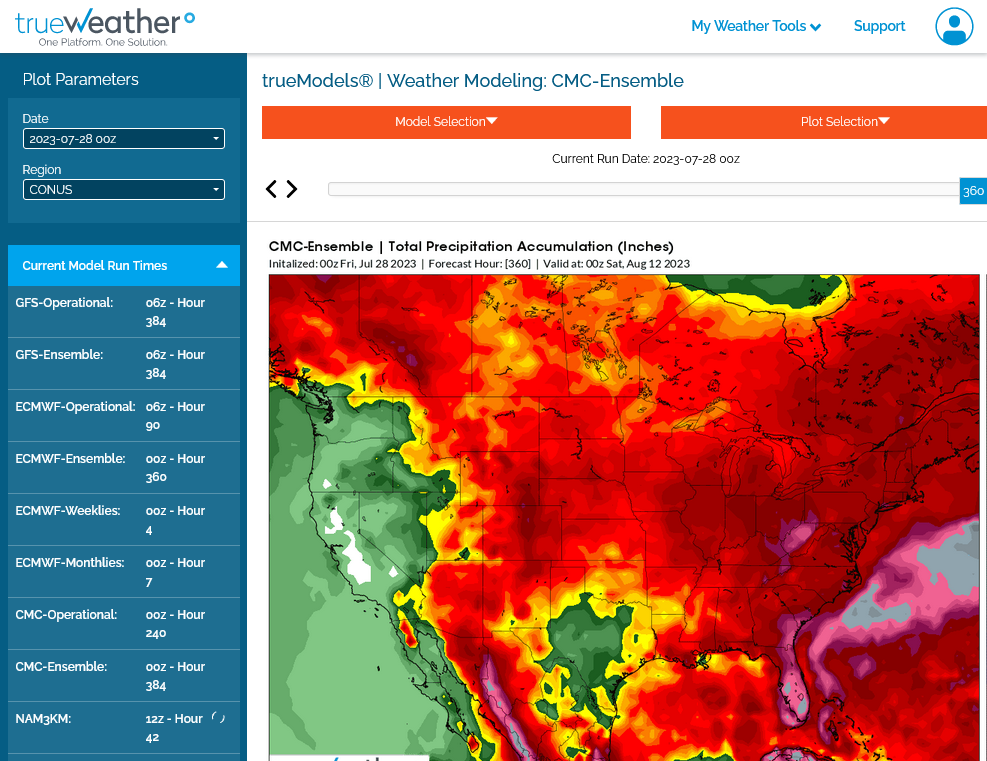
3. Canadian model-2nd wettest especially wet ECB
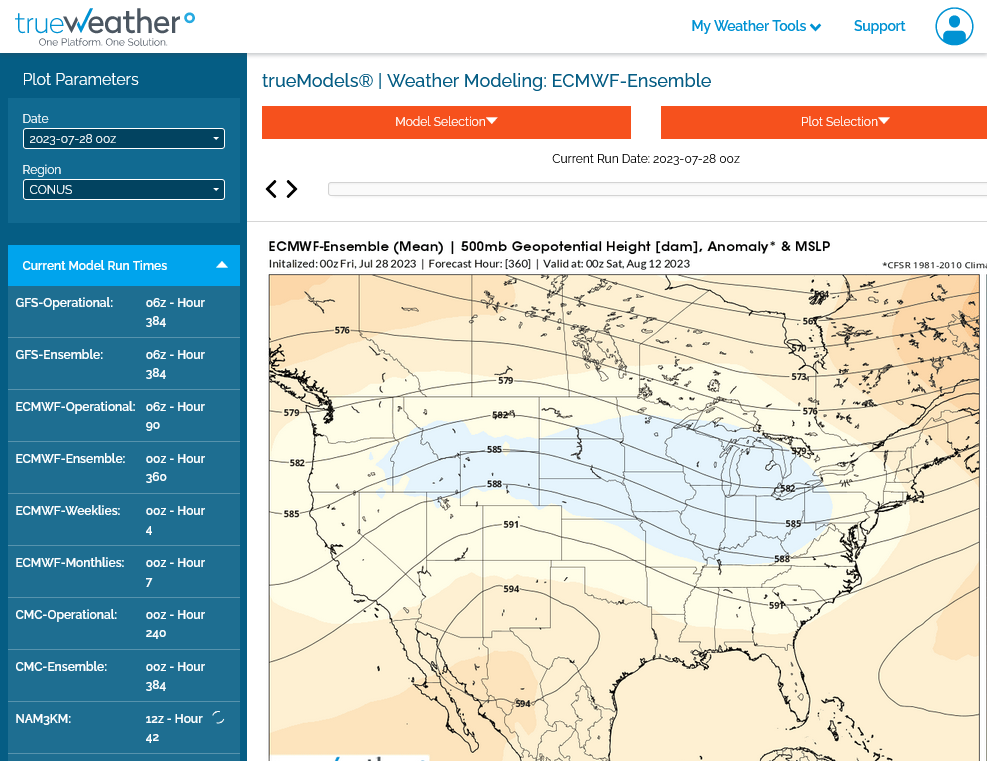
4. European model-wettest especially WCB and CCB
5. Northwest flow in 2 weeks

The latest 7 day precip forecasts are below.
Day 1 below:
http://www.wpc.ncep.noaa.gov/qpf/fill_94qwbg.gif?1526306199054

Day 2 below:
http://www.wpc.ncep.noaa.gov/qpf/fill_98qwbg.gif?1528293750112

Day 3 below:
http://www.wpc.ncep.noaa.gov/qpf/fill_99qwbg.gif?1528293842764

Days 4-5 below:
http://www.wpc.ncep.noaa.gov/qpf/95ep48iwbg_fill.gif?1526306162

Days 6-7 below:
http://www.wpc.ncep.noaa.gov/qpf/97ep48iwbg_fill.gif?1526306162

7 Day Total precipitation below:
http://www.wpc.ncep.noaa.govcdx /qpf/p168i.gif?1530796126

The Canadian model has several very bullish members with the dome shifting east.........so the forecast is not especially high confidence.
The Upper Midwest looks safe from the heat but where will the dome be to the south?
This will also determine where the heavy rains occur around the periphery of the dome
Having it farther north might be good for the Upper Midwest to get wetter.
384h GZ 500 forecast valid on Aug 13, 2023 00 UTC


Forecasts for the control (GEM 0) and the 20 ensemble members
Just out 12z Canadian model.
Twice as many members are bearish as bullish, so that's the most likely scenario. It seems a tad drier in week 2 compared to before but not enough to be a big deal.
2 days from now this means zilch!
https://weather.gc.ca/ensemble/charts_e.html?Hour=384&Day=0&RunTime=12&Type=gz
384h GZ 500 forecast valid on Aug 13, 2023 12UTC

Forecasts for global GEM, control (GEM 0) and the 20 ensemble members


