KEY EVENTS TO WATCH FOR:
Friday, July 28, 2023
8:30 AM ET. June Personal Income and Outlays
Personal Income, M/M% (previous +0.4%)
Consumer Spending, M/M% (previous +0.1%)
PCE Price Idx, M/M% (previous +0.1%)
PCE Price Idx, Y/Y% (previous +3.8%)
PCE Core Price Idx, M/M% (previous +0.3%)
PCE Core Price Idx, Y/Y% (previous +4.6%)
8:30 AM ET. 2nd Quarter Employment Cost Index
ECI, Q/Q% (previous +1.2%)
ECI, Y/Y% (previous +4.8%)
10:00 AM ET. July University of Michigan Survey of Consumers - final
End-Mo Sentiment Idx (previous 64.4)
End-Mo Expectations Idx (previous 61.5)
12-Month Inflation Forecast (previous 3.3%)
5-Year Inflation Forecast (previous 3.0%)
End-Mo Current Idx (previous 69.0)
3:00 PM ET. June Agricultural Prices
Farm Prices, M/M% (previous -2.8%)
The STOCK INDEXES? http://quotes.ino.com/ex?changes/?c=indexes
The Dow closed sharply lower on Thursday as it consolidated some of this week's rally. The low-range close sets the stage for a lower opening when Friday's day session begins trading. The latest economic data showed that the US economy grew at a faster-than-expected pace in the second quarter of 2023 at 2.4%. Today's data provided additional signs that the threat of a recession has faded at least in the short-term.Stochastics and the RSI are overbought but remain neutral to bullish signaling that sideways to higher prices are possible near-term. If the Dow extends the rally off July's low, the February-2022 high crossing at 35,824.28 is the next upside target. Closes below the 20-day moving average crossing at 34,654.50 would signal that a short-term top has been posted. First resistance is today's high crossing at 35,645.35. Second resistance is the February-2022 high crossing at 35,824.28. First support is the 10-day moving average crossing at 35,125.79. Second support is the 20-day moving average crossing at 34,654.50.
The September NASDAQ 100 closed lower on Thursday. The low-range close sets the stage for a steady to lower opening when Friday's night session begins trading. Stochastics and the RSI are neutral to bearish signaling sideways to lower prices are possible. Closes below the 20-day moving average crossing at 15,509.42 would confirm that a short-term top has been posted while opening the door for additional weakness. If September renews this year's rally, the December-2021 high on the weekly continuation chart crossing at 16,659.50 is the next upside target. First resistance is last-Wednesday's high crossing at 16,062.75. Second resistance is the December-2021 high on the weekly continuation chart crossing at 16,659.50. First support is the 20-day moving average crossing at 15,509.42. Second support is the 50-day moving average crossing at 14,991.26.
The September S&P 500 closed lower on Thursday. The low-range close sets the stage for a steady to lower opening when Friday's night session begins trading. Stochastics and the RSI are overbought, diverging and are turning neutral to bearish signaling that sideways to lower prices are possible near-term. Closes below the 20-day moving average crossing at 4524.81 would confirm that a short-term top has been posted. If September extends the rally off March's low, the 87% retracement level of the 2022 decline on the weekly chart crossing at 4639.07 is the next upside target. First resistance is today's high crossing at 4634.50. Second resistance is the 87% retracement level of the 2022 decline on the weekly chart crossing at 4639.07. First support is the 20-day moving average crossing at 4524.82. Second support is the 50-day moving average crossing at 4403.99.
INTEREST RATES? http://quotes.ino.com/ex?changes/?c=interest ""
September T-bonds closed down 2-08/32's at 123-30.
September T-bonds closed sharply lower on Thursday in response to the Fed's latest interest increase of a 1/4 point. The low-range close sets the stage for a steady to lower opening when Friday's day session begins trading. Stochastics and the RSI are neutral to bearish signaling that sideways to lower prices are possible near-term. If September extends the decline off July's high, July's low crossing at 122-30 is the next downside target.If September renews the rally off July's low, the 50% retracement level of the April-July decline crossing at 128-21 is the next upside target. First resistance is the 50% retracement level of the April-July decline crossing at 128-21. Second resistance is the June high crossing at 129-16. First support is today's low crossing at 123-21. Second support is July's low crossing at 122-30.
September T-notes closed down 1045-pts. at 111.000.
September T-notes closed sharply lower on Thursday. The low-range close sets the stage for a steady to lower opening when Friday's day session begins trading. Stochastics and the RSI are neutral to bearish signaling that sideways to lower prices are possible near-term. If September extends this week's decline, July's low crossing at 110.050 is the next downside target. If September renews the rally off the July 6th low, the 50-day moving average crossing at 113.005 would signal that a short-term low has been posted. First resistance is the 50-day moving average crossing at 113.005. Second resistance is the 50% retracement level of the May-July decline crossing at 113.313. First support is today's low crossing at 110.305. Second support is July's low crossing at 110.050.
ENERGY MARKETS? http://quotes.ino.com/ex?changes/?c=energy ""
September crude oil closed higher on Thursday as it extended the rally off June's low. The mid-range close sets the stage for a steady to higher opening when Friday's day session begins. Stochastics and the RSI are overbought but remain neutral to bullish signaling that sideways to higher prices are possible near-term. If September extends the rally off June's low, April's high crossing at $81.44 is the next upside target. Closes below the 20-day moving average crossing at $74.91 would signal that a short-term top has been posted. First resistance today's high crossing at $80.60. Second resistance is April's high crossing at $81.44. First support isthe 10-day moving average crossing at $77.01. Second support is the 20-day moving average crossing at $74.91.
September heating oil closed higher on Thursday as it extended the rally off May's low. The high-range close sets the stage for a steady to higher opening when Friday's day trading session begins. Stochastics and the RSI are overbought but remain neutral to bullish signaling that sideways to higher prices are possible near-term. If September extends the rally off May's low, the 75% retracement level of the 2022-2023 decline crossing at 3.0002 is the next upside target. Closes below the 20-day moving average crossing at 2.6037 would signal that a short-term top has been posted. First resistance is today's high crossing at 2.9153. Second resistance is the 75% retracement level of the 2022-2023 decline crossing at 3.0002. First support is the 10-day moving average crossing at 2.7051. Second support the 20-day moving average crossing at 2.6037.
September unleaded gas closed higher on Thursday as it extended the rally off May's low. The high-range close sets the stage for a steady to higher opening when Friday's day session begins trading. Stochastics and the RSI are overbought but remain neutral to bullish signaling that sideways to higher prices are possible near-term. If September extends the rally off the June 23rd low, the October-2022 high on the weekly continuation chart crossing at 3.0221 is the next upside target. Closes below the 20-day moving average crossing at 2.6103 would confirm that a short-term top has been posted. First resistance is today's high crossing at 2.8955. Second resistance is the October-2022 high on the weekly continuation chart crossing at 3.0221. First support is the 10-day moving average crossing at 2.7268. Second support is the 20-day moving average crossing at 2.6103.
September Henry natural gas closed lower on Thursday and below the 20-day moving average crossing at 2.642. The low-range close sets the stage for a steady to lower opening when Friday's day session begins trading. Stochastics and the RSI are turning neutral to bearish signaling that sideways to lower prices are possible near-term. If September extends today's decline. The July 17th low crossing at 2.477 is the next downside target. If September extends the rally off the July 17th low, June's high crossing at 2.911 is the next upside target. First resistance is the June high crossing at 2.911. Second resistance is the 25% retracement level of the 2022-2023 decline crossing at 3.193. First support is the July 17th low crossing at 2.477. Second support is the June 1st low crossing at 2.249.
CURRENCIES? http://quotes.ino.com/ex?changes/?c=currencies ""
The September Dollar posted a key reversal up and closed higher on Thursday as it extended the rally off July's low. The high-range close sets the stage for a steady to higher opening when Friday's session begins trading. Stochastics and the RSI are neutral to bullish signaling that sideways to higher prices are possible near-term. If September extends the rally off July's low, the 50-day moving average crossing at 102.191 is the next upside target. Closes below the 10-day moving average crossing at 100.452 would signal that a short-term top has been posted. First resistance is today's high crossing at 101.615. Second resistance is the 50-day moving average crossing at 102.191. First support is the 10-day moving average crossing at 100.452. Second support is July's low crossing at 99.220.
The September Euro posted a huge key reversal down as it closed sharply lower on Friday as it renewed the decline off last-Tuesday's high. The low-range close sets the stage for a steady to lower opening when Friday's day session begins trading. Stochastics and the RSI remain neutral to bearish signaling that sideways to lower prices are possible near-term. If September extends the decline off July's high, the 50-day moving average crossing at $1.09604 is the next downside target. Closes above the 10-day moving average crossing at 1.11667 would temper the near-term bearish outlook. First resistance is July's high crossing at $1.13105. Second resistance is the March 30th high crossing at 1.15190. First support is today's low crossing at 1.09955 Second support is the 50-day moving average crossing at $1.09604.
The September British Pound posted a key reversal down as it closed sharply lower on Friday as it resumed the decline off the July 14th high. The low-range close sets the stage for a steady to lower opening when Friday's day session begins trading. Stochastics and the RSI are neutral to bearish signaling sideways to lower prices are possible near-term. If September extends the aforementioned decline, the 50-day moving average crossing at 1.2691 is the next downside target. Closes above the 10-day moving average crossing at 1.2938 would signal that a short-term low has been posted. First resistance is the 10-day moving average crossing at 1.2938. Second resistance is the July 14th high crossing at 1.3146. First support is today's low crossing at 1.2796. Second support is the 50-day moving average crossing at 1.2691.
The September Swiss Franc posted a key reversal down as it closed sharply lower on Thursday as it renewed the decline off July's high. The low-range close sets the stage for a steady to lower opening when Friday's day session begins trading. Stochastics and the RSI are neutral to bearish signaling that sideways to lower prices are possible near-term. If September extends the decline off last-week's high. the 20-day moving average crossing at 1.15108 is the next downside target. If September renews the rally off May's low, the January 2019 high crossing at 1.18680 is the next upside target. First resistance is the July 18th high crossing at 1.17650. Second resistance is the January 2019 high crossing at 1.18680. First support is the 20-day moving average crossing at 1.15108. Second support is the 50-day moving average crossing at 1.13354.
The September Canadian Dollar closed lower on Thursday. The low-range close sets the stage for a steady to lower opening when Friday's day session begins trading. Stochastics and the RSI have turned neutral to bearish signaling that sideways to lower prices are possible near-term. Closes below last-Tuesday's low crossing at 75.57 would confirm that a short-term top has been posted while opening the door for additional weakness near-term. If September renews the rally off the January 7th low, the September 12th 2022 high crossing at 77.11 is the next upside target. First resistance is the 38% retracement level of the 2021-2022 decline crossing at 76.28. Second resistance is the September 12th high crossing at 77.11. First support is last-Tuesday's low crossing at 75.57. Second support is the 50-day moving average crossing at 75.19.
The September Japanese Yen closed higher on Thursday as it extended the rally off last-Friday's low. The high-range close sets the stage for a steady to higher opening when Friday’s day session begins trading. Stochastics and the RSI have turned neutral to bullish signaling that sideways to higher prices are possible near-term. If September resumes the rally off June's low, the 38% retracement level of the January-June decline crossing at 0.074017 is the next upside target. If September extends the decline off July's high, June's low crossing at 0.069755 is the next downside target. First resistance is July's high crossing at 0.073585. Second resistance is the 38% retracement level of the January-June decline crossing at 0.074017 is the next upside target. First support is last-Friday's low crossing at 0.071065. Second support is June's low crossing at 0.069755.
PRECIOUS METALS? http://quotes.ino.com/ex?changes/?c=metals ""
August gold posted a key reversal down as it closed sharply lower on Thursday and below the 20-day moving average crossing at $1950.30 signaling that a short-term top has been posted. The low-range close sets the stage for a steady to lower opening when Friday's day session begins trading. Stochastics and the RSI are neutral to bearish signaling that sideways to lower prices are possible near-term. If August extended today's decline, June's low crossing at $1911.40 is the next downside target. If August renews the rally off June's low, June's high crossing at $2000.70 is the next upside target. First resistance is June's high crossing at $2000.70. Second resistance is the 62% retracement level of the May-June decline crossing at $2025.20. First support is today's low crossing at $1941.70. Second support is June's low crossing at $1911.40.
September silver posted a key reversal down as it closed sharply lower on Thursday as it extended the decline off last-Thursday's high. The low-range close sets the stage for a steady to lower opening when Friday's day session begins trading. Stochastics and the RSI are turning neutral to bearish signaling that sideways to lower prices are possible near-term. Closes below the 50-day moving average crossing at 23.926 would signal that a short-term top has been posted. If July renews the rally off June's low, the 75% retracement level of the April-June decline crossing at 25.561 is the next upside target. First resistance is last-Thursday's high crossing at 25.475. Second resistance is the 75% retracement level of the April-June decline crossing at 25.561. First support is the 20-day moving average crossing at 24.185. Second support is the 50-day moving average crossing at 23.926.
September copper posted a key reversal down as it closed lower on Thursday. The low-range close sets the stage for a steady to lower opening when Friday's day session begins trading. Stochastics and the RSI are turning neutral to bearish signaling that sideways to lower prices are possible near-term. Closes below the 50-day moving average crossing at 3.7896 would signal that a short-term top has been posted. If September extends the rally off June's low, June's high crossing at 3.9640 is the next upside target. First resistance is July's high crossing at 3.9540. Second resistance is June's high crossing at 3.9640. First support is the 50-day moving average crossing at 3.7896. Second support is the June 29th low crossing at 3.6830.
GRAINS? http://quotes.ino.com/ex?changes/?c=grains "
December Corn closed down $0.06-cents at $5.42 1/4.
December corn closed lower on Thursday as it extended the decline off Monday's high. The low-range close sets the stage for a steady to lower opening when Friday's night session begins trading. Stochastics and the RSI are overbought and are turning neutral to bearish signaling that sideways to lower prices are possible near-term. Closes below last-Friday's low crossing at $5.31 1/4 would confirm that a short-term top has been posted. If December resumes the rally off July's low, the 75% retracement level of the June-July decline crossing at $5.92 3/4 is the next upside target. First resistance is the 62% retracement level of the June-July decline crossing at $5.73. Second resistance is the 75% retracement level of the June-July decline crossing at $5.92 3/4. First support is last-Friday's low crossing at $5.31 1/4. Second support is the 20-day moving average crossing at $5.20 1/2.
September wheat closed down $0.07 1/4-cents at $7.12 3/4.
September wheat closed lower on Thursday as it consolidated some of the rally off July's low. The low-range close sets the stage for a steady to lower opening when Friday's day session begins trading. Stochastics and the RSI are overbought and are turning neutral to bearish signaling that sideways to lower prices are possible near-term. Closes below last-Friday's low crossing at $6.93 1/2 would confirm that a short-term top has been posted. If September renews the rally off July's low, the 38% retracement level of the 2022-2023 decline crossing at $7.95 1/4 is the next upside target. First resistance is Tuesday's high crossing at $7.77 1/4. Second resistance is 38% retracement level of the 2022-2023 decline crossing at $7.95 1/4. First support is the 10-day moving average crossing at $7.08 3/4. Second support is the 20-day moving average crossing at $6.80 1/2.
September Kansas City Wheat closed up $0.01 1/4-cents at $8.66 1/2.
September Kansas City wheat closed higher on Thursday as it consolidated some of Wednesday's sharp decline. The low-range close sets the stage for a steady to slightly higher opening when Friday's day session begins trading. Stochastics and the RSI have turned neutral to bearish signaling that sideways to lower prices are possible near-term. Closes below last-Friday's low crossing at $8.42 would confirm that a short-term top has been posted. If September renews the rally off July's low, the 50% retracement level of the 2022-2023 decline crossing at $9.46 3/4 is the next upside target. First resistance is Tuesday's high crossing at $9.29 3/4. Second resistance is the 50% retracement level of the 2022-2023 decline crossing at $9.46 3/4. First support is the 10-day moving average crossing at $8.31. Second support is the 20-day moving average crossing at $8.38 3/4.
September Minneapolis wheat closed up $0.08 1/2-cents crossing at $9.04 1/4.
September Minneapolis wheat posted an inside day with a higher close on Thursday. The mid-range close sets the stage for a steady to higher opening when Friday's day session begins trading. Stochastics and the RSI have turned neutral to bearish signaling that sideways to lower prices are possible near-term. Closes below the 20-day moving average crossing at $8.71 3/4 would confirm that a short-term top has been posted. If September renewed the rally off July's low, the 50% retracement level of the 2022-2023 decline crossing at $9.60 3/4 is the next upside target. First resistance is the 50% retracement level of the 2022-2023 decline crossing at $9.60 3/4. Second resistance is the 62% retracement level of the 2022-2023 decline crossing at $10.05 1/2 is the next upside target. First support is the 20-day moving average crossing at $8.71 3/4. Second support is the 50-day moving average crossing at $8.45 1/4.
SOYBEAN COMPLEX? http://quotes.ino.com/ex?changes/?c=grains "
November soybeans closed down $0.22-cents at $13.98.
November soybeans posted a key reversal down as it closed lower on Thursday. The low-range close sets the stage for a steady to lower opening when Friday's day session begins trading. Stochastics and the RSI are overbought, diverging and are turning neutral to bearish signaling that sideways to lower prices are possible near-term. Closes below the 20-day moving average crossing at $13.69 3/4 would signal that a short-term top has been posted. If November extends the rally off May's low, the April-2022 high crossing at $14.48 1/4 is the next upside target. First resistance is Monday's high crossing at $14.35. Second resistance is the April-2022 high crossing at $14.48 1/4. First support is last-Friday's low crossing at $13.85 1/4. Second support is the 20-day moving average crossing at $13.69 3/4.
December soybean meal closed down $3.00 at $415.60.
December soybean meal closed lower on Thursday. The low-range close sets the stage for a steady to lower opening when Friday's day session begins trading. Stochastics and the RSI are overbought, diverging and are turning neutral to bearish signaling that sideways to lower prices are possible near-term. Closes below the 20-day moving average crossing at $402.30 would signal that a short-term top has been posted. If December extends this month's rally, the 87% retracement level of the March-May decline crossing at $428.00 is the next upside target. First resistance is the 75% retracement level of the March-May decline crossing at $418.80. Second resistance is the 87% retracement level of the March-May decline crossing at $428.00. First support is the 20-day moving average crossing at $402.30. Second support is the July 7th low crossing at $384.70.
December soybean oil closed down 112-pts. at 62.07.
December soybean oil closed lower on Thursday as it consolidated some of the rally off May's low.The low-range close sets the stage for a steady to lower opening when Friday's day session begins trading. Stochastics and the RSI have turned neutral to bearish signaling that sideways to lower prices are possible near-term. Closes below the 20-day moving average crossing at 60.81 would signal that a short-term top has been posted. If December renews the rally off May's low, the 87% retracement level of the 2022-2023 decline crossing at 68.81 is the next upside target. First resistance is Monday's high crossing at 65.58. Second resistance is the 87% retracement level of the 2022-2023 decline crossing at 68.81. First support is the 20-day moving average crossing at 60.81. Second support is the June 29th low crossing at 54.67.
LIVESTOCKhttp://quotes.ino.com/exchanges/?c=livestock
August hogs closed up $0.30 at $101.95.
August hogs closed higher on Thursday as it extends this week's trading range. The high-range close sets the stage for a steady to slightly higher opening when Friday's day session begins trading. Stochastics and the RSI are overbought but remain neutral to bullish signaling that sideways to higher prices are possible near-term. If August extends the rally off May's low, the 87% retracement level of the 2022-2023 decline crossing at $104.40 is the next upside target. Closes below the 20-day moving average crossing at $97.22 would signal that a short-term top has been posted. First resistance is today's high crossing at $102.15. Second resistance is the 87% retracement level of the 2022-2023 decline crossing at $104.40. First support is the 10-day moving average crossing at $99.18. Second support is the 20-day moving average crossing at $97.22.
August cattle closed down $0.60 at $178.08.
August cattle closed lower on Thursday. The low-range close sets the stage for a steady to lower opening on Friday. Stochastics and the RSI are neutral to bearish signaling that sideways to lower prices are possible near-term. Closes below the 20-day moving average crossing at $175.09 would signal that a short-term top has been posted. If August renews this year's rally into uncharted territory, upside targets will be hard to project. First resistance is last-Thursday's high crossing at $183.98. Second resistance is unknown. First support is the 20-day moving average crossing at $175.09. Second support is the 50-day moving average crossing at $172.82.
August Feeder cattle closed up $0.65 at $244.85.
August Feeder cattle closed higher on Thursday as it extends the trading range of the past three-weeks. The high-range close sets the stage for a steady to higher opening when Friday's day session begins trading. Stochastics and the RSI are neutral to bearish signaling that sideways to lower prices are possible near-term. Closes below the July 6th low crossing at $240.80 would mark a downside breakout of the aforementioned trading range. If August renews the rally off June's low into uncharted territory, upside targets will be hard to project. First resistance is July's high crossing at $251.30. Second resistance is unknown. First support is the July 6th low crossing at $240.80. Second support is the 50-day moving average crossing at $240.01.
FOOD & FIBERhttp://quotes.ino.com/ex changes/?c=food
September coffee closed lower on Thursday. The low-range close sets the stage for a steady to lower opening on Friday. Stochastics and the RSI are neutral to bullish signaling sideways to higher prices are possible near-term. Closes above Monday's high crossing at $16.55 would signal that a short-term low has been posted while opening the door for additional short-term gains near-term. If September resumes the decline off June's high, the 87% retracement level of the January-April rally crossing at $15.20 is the next downside target. First resistance is Monday's high crossing at $16.55. Second resistance is the June 27th high crossing at $16.79. First support is last-Monday's low crossing at $15.51. Second support is the 87% retracement level of the January-April rally crossing at $15.20.
September cocoa closed lower on Thursday as it consolidated some of this week's rally. The low-range close sets the stage for a steady to lower opening on Friday. Stochastics and the RSI are overbought but remain neutral to bullish signaling that sideways to higher prices are possible near-term. If September extends the rally off March's low, monthly resistance crossing at 37.75 is the next upside target. Closes below the 20-day moving average crossing at 33.80 would confirm that a short-term top has been posted.
October sugar closed slightly higher on Thursday. The high-range close sets the stage for a steady to higher opening on Friday. Stochastics and the RSI are neutral to bearish signaling that sideways to lower prices are possible near-term. Closes below the 20-day moving average crossing at 23.88 would signal that a short-term top has been posted. If October extends the rally off June's low, June's high crossing at 26.19 is the next upside target.
December cotton posted a huge key reversal down as it closed sharply lower on Thursday ending and eight-day rally. The low-range close sets the stage for a steady to lower opening on Friday. Stochastics and the RSI are overbought and are turning neutral to bearish signaling sideways to lower prices are possible near-term. Closes below the 20-day moving average crossing at 82.47 would signal that a short-term top has been posted. If December extends the rally off June's low, the 75% retracement level of the May-July decline crossing at 91.29 is the next upside target.
Thanks much, tallpine!
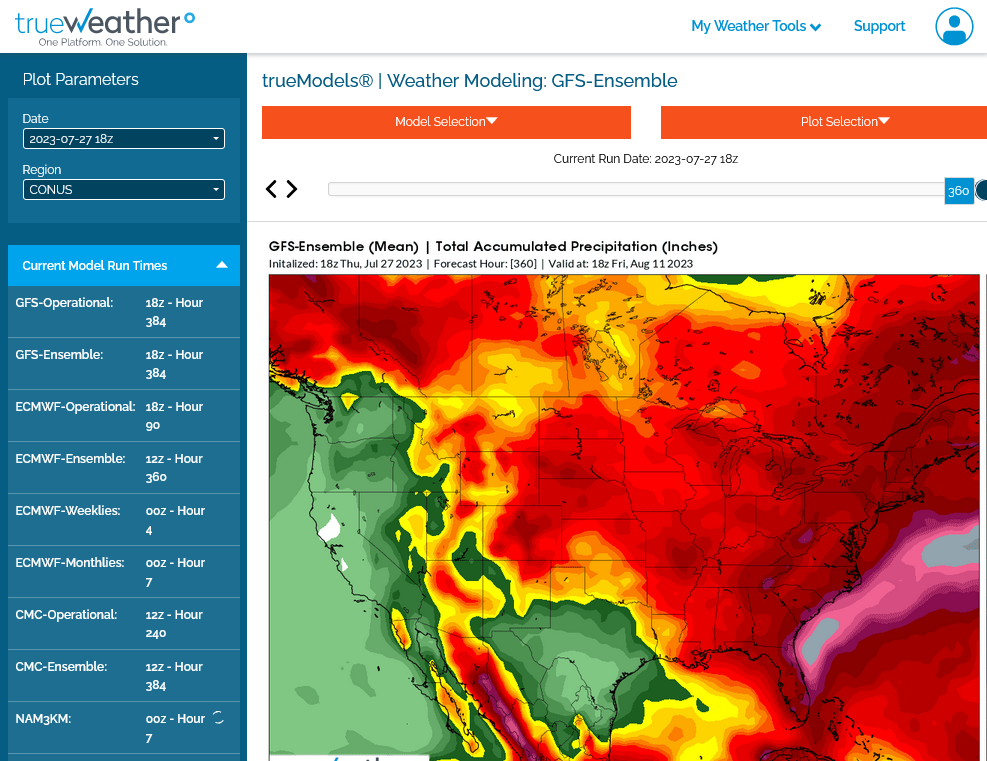
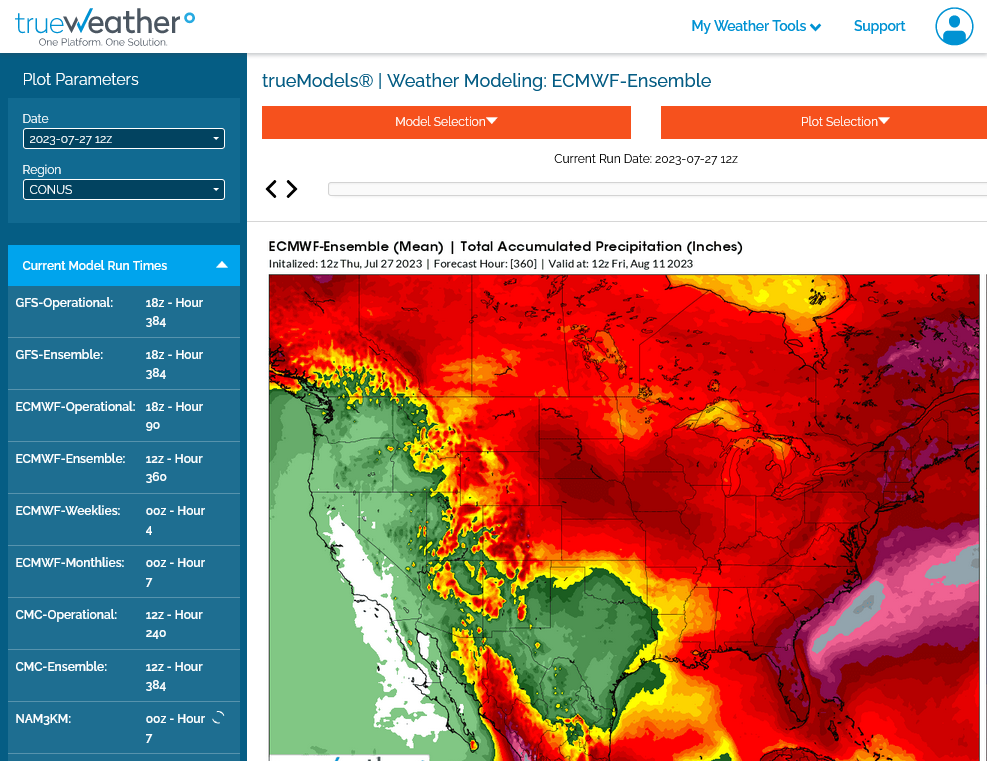
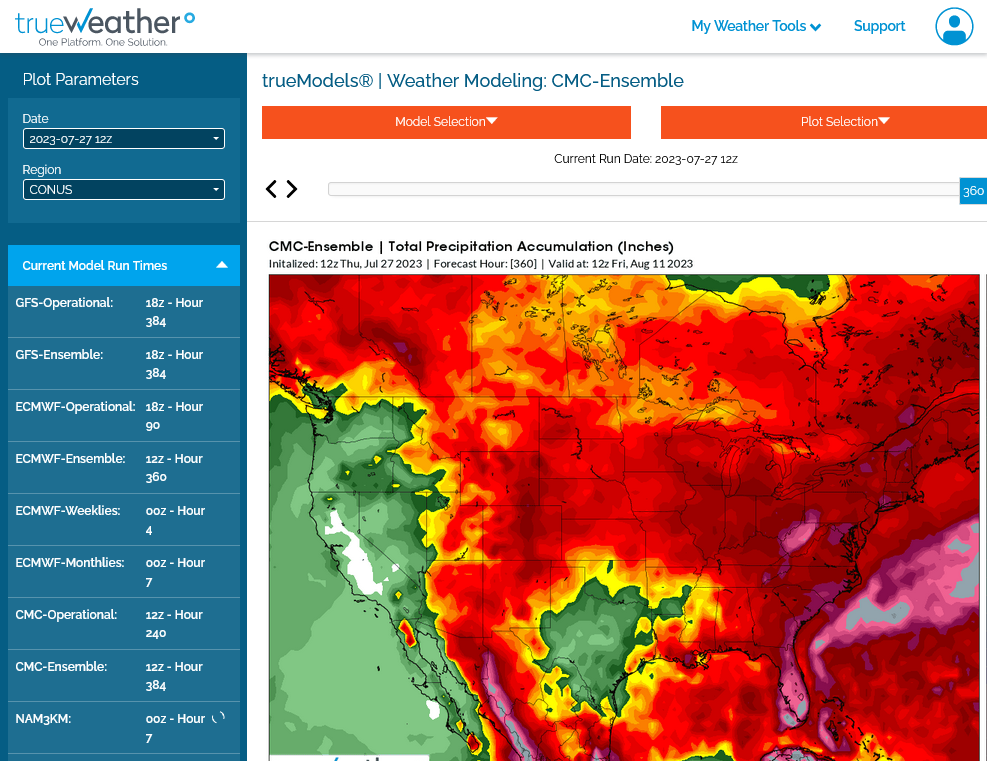
The models are all over the place with rain amounts but they agree on it turning cooler.
This map below is about the only thing we can have moderate confidence in. So the first half of August is looking cool-ish for the Midwest which is a plus for the crops.

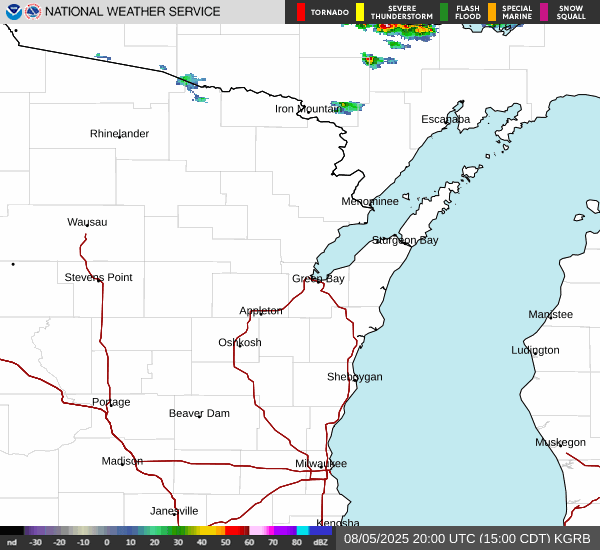
Been watching the radars for our Relevant Radio friends in MN/WI today and happy with the results.
The storms may die out overnight, however before getting too far south.
MSP
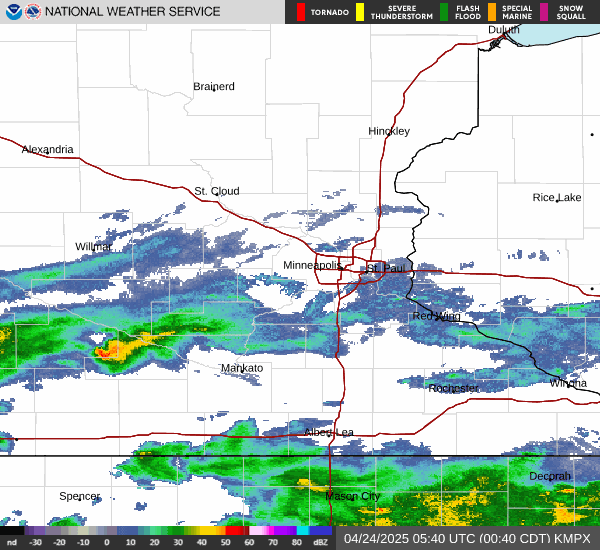
+++++++++++++++++
Green Bay
Weather map now.
In 24 hours and
In 48 hours.
https://www.wpc.ncep.noaa.gov/#

+++++++++++++++++++++++++++++++++++++++++++++++++
Surface Weather maps for days 3-7 below:
https://www.wpc.ncep.noaa.gov/medr/medr.shtml

+++++++++++++++++++++++++++++++++++++++++++
The latest 7 day precip forecasts are below.
Day 1 below:
http://www.wpc.ncep.noaa.gov/qpf/fill_94qwbg.gif?1526306199054

Day 2 below:
http://www.wpc.ncep.noaa.gov/qpf/fill_98qwbg.gif?1528293750112

Day 3 below:
http://www.wpc.ncep.noaa.gov/qpf/fill_99qwbg.gif?1528293842764

Days 4-5 below:
http://www.wpc.ncep.noaa.gov/qpf/95ep48iwbg_fill.gif?1526306162

Days 6-7 below:
http://www.wpc.ncep.noaa.gov/qpf/97ep48iwbg_fill.gif?1526306162

7 Day Total precipitation below:
http://www.wpc.ncep.noaa.govcdx /qpf/p168i.gif?1530796126

Latest model rains thru 15 days.
1. 18z GEFS-driest-more moisture C.Plains SCB and ECB
2. 12 European-pretty wet Plains/WCB and maybe CCB
3. 12z Canadian-pretty wet CCB and ECB