KEY EVENTS TO WATCH FOR:
Wednesday, July 26, 2023
7:00 AM ET. MBA Weekly Mortgage Applications Survey
Composite Idx (previous 210.7)
Composite Idx, W/W% (previous +1.1%)
Purchase Idx-SA (previous 163.2)
Purchase Idx-SA, W/W% (previous -1.3%)
Refinance Idx (previous 446.4)
Refinance Idx, W/W% (previous +7.3%)
10:00 AM ET. June New Residential Sales
New Home Sales (previous 763K)
New Home Sales, M/M% (previous +12.2%)
New Home Sales Months Supply (previous 6.7)
10:30 AM ET. EIA Weekly Petroleum Status Report
Crude Oil Stocks (Bbl) (previous 457.42M)
Crude Oil Stocks, Net Chg (Bbl) (previous -0.708M)
Gasoline Stocks (Bbl) (previous 218.386M)
Gasoline Stocks, Net Chg (Bbl) (previous -1.066M)
Distillate Stocks (Bbl) (previous 118.194M)
Distillate Stocks, Net Chg (Bbl) (previous +0.013M)
Refinery Usage (previous 94.3%)
Total Prod Supplied (Bbl/day) (previous 20.767M)
Total Prod Supplied, Net Chg (Bbl/day) (previous +2.066M)
2:00 PM ET. U.S. interest rate decision
Federal Funds Rate
Federal Funds Rate Change (Pts)
Fed Funds Rate-Range High (previous 5.25)
Fed Funds Rate-Range Low (previous 5.00)
FOMC Vote For Action (previous 11)
FOMC Vote Against Action (previous 0)
Discount Rate (previous 5.25)
Discount Rate Change (Pts) (previous +0.00)
Discount Rate-Range High
Discount Rate-Range Low
Thursday, July 27, 2023
8:30 AM ET. U.S. Weekly Export Sales
8:30 AM ET. Unemployment Insurance Weekly Claims Report - Initial Claims
Jobless Claims
Jobless Claims, Net Chg
Continuing Claims
Continuing Claims, Net Chg
8:30 AM ET. June Advance Report on Durable Goods
Durable Goods-SA, M/M% (previous +1.7%)
Dur Goods, Ex-Defense, M/M% (previous +3%)
Dur Goods, Ex-Transport, M/M% (previous +0.6%)
Orders: Cap Gds, Non-Def, Ex-Air, M/M% (previous +0.7%)
Shipmnts: Cap Gds, Non-Def, Ex-Air, M/M% (previous +0.2%)
8:30 AM ET. 2nd Quarter Advance estimate GDP
Annual Rate, Q/Q% (previous +2.0%)
Chain-Weighted Price Idx, Q/Q% (previous +4.1%)
PCE Price Idx, Q/Q% (previous +4.1%)
Purchase Price Idx, Q/Q%
Real Final Sales 1st Est, Q/Q%
Core PCE Price Idx, Q/Q%
Personal Consumption, Q/Q% (previous +4.2%)
8:30 AM ET. June Advance Economic Indicators Report
10:00 AM ET. June Pending Home Sales Index
Pending Home Sales (previous 76.5)
Pending Home Sales Idx, M/M% (previous -2.7%)
Pending Home Sales Idx , Y/Y% (previous -22.2%)
10:30 AM ET. EIA Weekly Natural Gas Storage Report
Working Gas In Storage (Cbf)
Working Gas In Storage, Net Chg (Cbf)
11:00 AM ET. July Federal Reserve Bank of Kansas City Survey of Tenth District Manufacturing
Mfg Activity Idx (previous -10)
6-Mo Exp Prod Idx (previous 15)
Mfg Composite Idx (previous -12)
6-Mo Exp Composite Idx (previous -2)
4:30 PM ET. Federal Discount Window Borrowings
4:30 PM ET. Foreign Central Bank Holdings
Friday, July 28, 2023
8:30 AM ET. June Personal Income and Outlays
Personal Income, M/M% (previous +0.4%)
Consumer Spending, M/M% (previous +0.1%)
PCE Price Idx, M/M% (previous +0.1%)
PCE Price Idx, Y/Y% (previous +3.8%)
PCE Core Price Idx, M/M% (previous +0.3%)
PCE Core Price Idx, Y/Y% (previous +4.6%)
8:30 AM ET. 2nd Quarter Employment Cost Index
ECI, Q/Q% (previous +1.2%)
ECI, Y/Y% (previous +4.8%)
10:00 AM ET. July University of Michigan Survey of Consumers - final
End-Mo Sentiment Idx (previous 64.4)
End-Mo Expectations Idx (previous 61.5)
12-Month Inflation Forecast (previous 3.3%)
5-Year Inflation Forecast (previous 3.0%)
End-Mo Current Idx (previous 69.0)
3:00 PM ET. June Agricultural Prices
Farm Prices, M/M% (previous -2.8%)
The STOCK INDEXES? http://quotes.ino.com/ex?changes/?c=indexes
The STOCK INDEXES: The September NASDAQ 100 was lower overnight and sets the stage a lower opening when the day session begins trading. Stochastics and the RSI are turning neutral to bullish signaling that sideways to higher prices are possible near-term. If September renews this year's rally, the December-2021 high on the weekly continuation chart crossing at 16,659.50 is the next upside target. Closes below the 20-day moving average crossing at 15,489.14 would confirm that a short-term top has been posted. First resistance is last-Wednesday's high crossing at 16,062.75. Second resistance is the December-2021 high on the weekly continuation chart crossing at 16,659.50. First support is the 20-day moving average crossing at 15,489.14. Second support is the 50-day moving average crossing at 14,952.95.
The September S&P 500 was was steady to slightly lower overnight. Overnight trading sets the stage for a slightly lower opening when the day session begins trading. Stochastics and the RSI are overbought but remain neutral to bullish signaling that sideways to higher prices are possible near-term. If June extends the rally off March's low, the 87% retracement level of the 2022 decline crossing at 4639.07 is the next upside target. Closes below the 20-day moving average crossing at 4517.06 would confirm that a short-term top has been posted. First resistance is last-Wednesday's high crossing at 4609.25. Second resistance is the 87% retracement level of the 2022 decline crossing at 4639.07. First support is the 10-day moving average crossing at 4571.70. Second support is the 20-day moving average crossing at 4517.05.
INTEREST RATES http://quotes.ino.com/ex changes/?c=interest"
INTEREST RATES: September T-bonds was slightly higher overnight. Overnight trading sets the stage for a slightly higher opening when the day session begins trading. Stochastics and the RSI are turning neutral to bearish signaling that sideways to lower prices are possible near-term. If September extends the decline off last-Wednesday's high, July's low crossing at 122-30 is the next downside target. If September renews this month's rally, the 50% retracement level of the April-July decline crossing at 128-21 is the next upside target. First resistance is the 50% retracement level of the April-July decline crossing at 128-21. Second resistance is June's high crossing at 129-16. First support is Tuesday's low crossing at 125-10. Second support is July's low crossing at 122-30.
September T-notes were slightly higher overnight as it consolidates some of the decline off last-Tuesday's high. Overnight trading sets the stage for a slightly higher opening when the day session begins trading. Stochastics and the RSI remain neutral to bearish signaling that sideways to lower prices are possible near-term. If September extends the decline off last-Tuesday's high, July's low crossing at 110.050 is the next downside target. If September renews this month's rally, the 50% retracement level of the April-July decline crossing at 113.313 is the next upside target. First resistance is the 50-day moving average crossing at 113.035. Second resistance is the 50% retracement level of the April-July decline crossing at 113.313. First support is Tuesday's low crossing at 111.175. Second support is July's low crossing at 110.050.
ENERGY MARKETS? http://quotes.ino.com/ex?changes/?c=energy ""
ENERGIES:Septembercrude oil was lower overnight and is working on a possible inside day as it consolidates some of the rally off June's low. Overnight trading sets the stage for a lower opening when the day session begins trading. Stochastics and the RSI are overbought but remain neutral to bullish signaling that sideways to higher prices are possible near-term. If September extends the rally off the June 28th low, April's high crossing at $81.44 is the next upside target. Closes below the 20-day moving average crossing at $74.41 would signal that a short-term top has been posted. First resistance is Tuesday's high crossing at $79.90. Second resistance is April's high crossing at $81.44. First support is the 10-day moving average crossing at 76.71. Second support is the 20-day moving average crossing at $74.41.
September heating oil was slightly higher overnight as it extends the rally off May's low. Overnight trading sets the stage for a steady to slightly higher opening when the day session begins trading. Stochastics and the RSI are overbought but remain neutral to bullish signaling that sideways to higher prices are possible near-term. If September extends the rally off May's low, the 62% retracement level of the 2022-2023 decline crossing at 2.8561 is the next upside target. Closes below the 20-day moving average crossing at 2.5758 would signal that a short-term top has been posted. First resistance is Monday's high crossing at 2.8279. Second resistance is the 62% retracement level of the 2022-2023 decline crossing at 2.8561. First support is the 10-day moving average crossing at 2.6705. Second support is the 20-day moving average crossing at 2.5758.
September unleaded gas was slightly higher in late-overnight trading. Overnight trading sets the stage for a slightly higher opening when the day session begins trading. Stochastics and the RSI are overbought but remain neutral to bullish signaling that sideways to higher prices are possible near-term. If September extends the rally off the June 23rd low, the October-2022 high on the weekly continuation chart crossing at 3.0221 is the next upside target. Closes below the 20-day moving average crossing at 2.5847 would signal that a short-term top has been posted. First resistance is Monday's high crossing at $2.8867. Second resistance is the October-2022 high on the weekly continuation chart crossing at $3.0221. First support is the 10-day moving average crossing at $2.6963. Second support is the 20-day moving average crossing at $2.5847.
September natural gas was slightly lower overnight and sets the stage for a slightly lower opening when the day session begins trading. Stochastics and the RSI are neutral to bullish signaling that sideways to higher prices are possible near-term. If September extends the rally off last-week's low, the June 26th high crossing at 2.911 is the next upside target. If September renews the decline off June's high, June's low crossing at 2.249 is the next downside target. First resistance is the June 26th high crossing at 2.911. Second resistance is the 25% retracement level of the 2022-2023 decline crossing at 3.193. First support is last-Monday's low crossing at 2.477. Second support is the June 1st low crossing at 2.249.
CURRENCIEShttp://quotes.ino.com/ex changes/?c=currencies"
CURRENCIES:The September Dollar was lower overnight as it consolidates some of the rally off last-Tuesday's low. Overnight trading sets the stage for a higher opening when the day session begins trading later this morning. Stochastics and the RSI are neutral to bullish signaling that sideways to higher prices are possible near-term. Closes above the 20-day moving average crossing at $101.229 would signal that a short-term low has been posted. Closes below the 10-day moving average crossing at $100.259 would temper the near-term friendly outlook in the market. If September renews the decline off the July 6th high, the March 30th low on the weekly continuation chart crossing at $97.730 is the next downside target. First resistance is the 20-day moving average crossing at $101.229. Second resistance is the 50-day moving average crossing at $102.225. First support is the 10-day moving average crossing at $100.259. Second support is July's low crossing at $99.220.
The September Euro was higher overnight as it consolidates some of the decline off last-Tuesday's high. Overnight trading sets the stage for a higher opening when the day session begins trading. Stochastics and the RSI remain neutral to bearish signaling that sideways to lower prices are possible near-term. If September extends the decline off last-Tuesday's high, the 50-day moving average crossing at 1.09590 is the next downside target. Closes above the 10-day moving average crossing at $1.11908 would temper the near-term bearish outlook in the market. First resistance is the 10-day moving average crossing at $1.11908. Second resistance is last-Tuesday's high crossing at $1.13105. First support is Tuesday's low crossing at 1.10510. Second support is the 50-day moving average crossing at 1.09590.
The September British Pound was steady to slightly higher overnight as it consolidates some of the decline off July's high. Overnight trading and sets the stage for a slightly higher opening when the day session begins trading. Stochastics and the RSI remain neutral to bearish signaling that sideways to lower prices near-term. If September extends this month's decline, the 50-day moving average crossing at 1.2686 is the next downside target. If September resumes the rally off May's low, the 75% retracement level of the 2022-2023 decline crossing at 1.3253 is the next upside target. First resistance is the July 14th high crossing at 1.3146. Second resistance is the 75% retracement level of the 2022-2023 decline crossing at 1.3253. First support is the 50-day moving average crossing at 1.2686. Second support is the June 29th low crossing at 1.2594.
The September Swiss Franc was higher overnight and sets the stage for a higher opening when the day session begins trading. Stochastics and the RSI are turning neutral to bullish signaling that sideways to higher prices are possible near-term. If September resumes the rally off May's low, the January 2019 high crossing at 1.18680 is the next upside target. If September extends the decline off last-Tuesday's high, the 20-day moving average crossing at 1.14938 is the next downside target. First resistance is last-Tuesday's high crossing at 1.17650. Second resistance is the January 2019 high crossing at 1.18680. First support is the 20-day moving average crossing at 1.14938. Second support is the 50-day moving average crossing at 1.13301.
The September Canadian Dollar was lower overnight as it extends the trading range of the past three-week's and sets the stage for a lower opening when the day session begins trading. Stochastics and the RSI are neutral signaling that sideways trading is possible near-term. If September renews the rally off July's low, the September-12th -2022 high crossing at $77.11 is the next upside target. Closes below the July 18th low crossing at $75.57 would signal that a short-term top has been posted. First resistance is the 38% retracement level of the 2022-2023 decline crossing at $76.28. Second resistance is the September-12th -2022 high crossing at $77.11. First support is the July 18th low crossing at $75.57. Second support is the 50-day moving average crossing at $75.20.
The September Japanese Yen was slightly higher overnight and sets the stage for a slightly higher opening when the day session begins trading. Stochastics and the RSI are turning neutral to bullish signaling that sideways to higher prices are possible near-term. If September renews the rally off last-Friday's low, the July 14th high crossing at 0.073585 is the next upside target. If September extends the decline off the July 14th high, June's low crossing at 0.069755 is the next downside target. First resistance is the July14th high crossing at 0.073585. Second resistance is the 38% retracement level of the January-June decline crossing at 0.074017. First support is last-Friday's crossing at 0.071065. Second support is June's low crossing at 0.069755.
PRECIOUS METALS http://quotes.ino.com/ex changes/?c=metals"
Precious Metals: Augustgold was higher overnight and sets the stage for a higher opening when the day session begins trading later this morning. Stochastics and the RSI are turning neutral to bullish signaling that sideways to higher prices are possible near-term. Closes below the 20-day moving average crossing at $1946.50 would signal that a short-term top has been posted. If August renews the rally off June's low, the 50% retracement level of the May-June decline crossing at $2001.40 is the next upside target. First resistance is the July 20th high crossing at $1989.80. Second resistance is the 50% retracement level of the May-June decline crossing at $2001.40. First support is the 20-day moving average crossing at $1949.40. Second support is June's low crossing at $1900.60.
September silver was steady to slightly higher overnight as it consolidates some of the decline off last- Thursday's high. Overnight trading sets the stage for a slightly higher opening when the day session begins trading later this morning. Stochastics and the RSI are turning neutral signaling that sideways to lower prices are possible near-term. Closes below the 20-day moving average crossing at $24.122 would signal that a short-term top has been posted. If July resumes the rally off June's low, the 75% retracement level of the May-June decline crossing at $25.561 is the next upside target. First resistance is last-Thursday's high crossing at $25.475. Second resistance is the 75% retracement level of the May-June decline crossing at 25.561. First support is the 20-day moving average crossing at $24.122. Second support is the 50-day moving average crossing at $23.929.
September copper was lower overnight and is working on a possible inside day as it consolidates some of the rally off Monday's low. Overnight trading sets the stage for a lower opening when the day session begins trading. Stochastics and the RSI have turned neutral to bullish signaling that sideways to higher prices are possible near-term. If September renews the rally off the June 29th low, June's high crossing at 3.9640 is the next upside target. Closes below the 50-day moving average crossing at 3.7879 would signal that a short-term top has been posted. First resistance June's high crossing at 3.9640. Second resistance is May's high crossing at 4.0100. First support is the 50-day moving average crossing at 3.7879. Second support is the June 29th low crossing at 3.6830.
GRAINS http://quotes.ino.com/ex changes/?c=grains
Grains: December corn was lower overnight as it consolidates some of the rally off July's low. Overnight trading sets the stage for a lower opening when the day sessions begins trading. Stochastics and the RSI are overbought but remain neutral to bullish signaling that sideways to higher prices are possible near-term. If December extends the rally off July's low, the 75% retracement level of the June-July decline crossing at $5.92 3/4 is the next upside target. Closes below last-Friday's low crossing at $5.31 1/4 would signal that a short-term top has been posted. First resistance is the 62% retracement level of the June-July decline crossing at $5.73. Second resistance is the 75% retracement level of the June-July decline crossing at $5.92 3/4. First support is last-Friday's low crossing at $5.31 1/4. Second support is the 20-day moving average crossing at $5.20 1/2.
September wheat was sharply lower overnight as it consolidates some of this week's gains. Overnight trading sets the stage for a sharply lower opening when the day session begins trading. Stochastics and the RSI are overbought but remain neutral to bullish signaling that sideways to higher prices are possible near-term. If September extends the rally off July's low, the 38% retracement level of the 2022-2023 decline crossing at $7.95 1/4 is the next upside target. Closes below last-Friday's low crossing at $6.93 1/2 would confirm that a short-term top has been posted. First resistance is Tuesday's high crossing at $7.77 1/4. Second resistance is the 38% retracement level of the 2022-2023 decline crossing at $7.95 1/4. First support is last-Friday's low crossing at $6.93 1/2. Second support is the 20-day moving average crossing at $6.79 1/4.
September Kansas City wheat was lower overnight as it consolidates some of the rally off July's low. Overnight trading sets the stage for a lower opening when the day session begins trading later this morning. Stochastics and the RSI are overbought but remain neutral to bullish signaling that sideways to higher prices are possible near-term. If September extends this month's rally, the 50% retracement level of the 2022-2023 decline crossing at $9.46 3/4 is the next upside target. Closes below the 10-day moving average crossing at $8.61 would temper the near-term friendly outlook. First resistance is Tuesday's high crossing at $9.29 3/4. Second resistance is the 50% retracement level of the 2022-2023 decline crossing at $9.46 3/4. First support is the 10-day moving average crossing at $8.61. Second support is the 50-day moving average crossing at $8.29 3/4.
September Minneapolis wheat was lower overnight as it consolidates some of the rally off May's low. Overnight trading sets the stage for a lower opening when the day session begins trading. Stochastics and the RSI are overbought but remain neutral to bullish signaling that sideways to higher prices are possible near-term. If September extends the rally off July's low, the 50% retracement level of the 2022-2023 decline crossing at $9.60 3/4 is the next upside target. Closes below the 20-day moving average crossing at $8.69 would confirm that a short-term top has been posted. First resistance is Tuesday's high crossing at $9.47 3/4. Second resistance is the 50% retracement level of the 2022-2023 decline crossing at $9.60 3/4. First support is the 10-day moving average crossing at $8.98. Second support is the 20-day moving average crossing at $8.69.
SOYBEAN COMPLEX? http://quotes.ino.com/ex?changes/?c=grains "
November soybeans were slightly lower overnight and sets the stage for a steady to lower opening when the day session begins trading later this morning. Stochastics and the RSI are overbought but remain neutral to bullish signaling that sideways to higher prices are possible near-term. If November extends the rally off May's low, the May-2022 high crossing at $14.35 is the next upside target. Closes below the 20-day moving average crossing at $13.63 1/4 would signal that a short-term top has been posted. First resistance is Monday's high crossing at $14.35. Second resistance is the May-2022 high crossing at $14.35. First support is the 10-day moving average crossing at $13.99 1/4. Second support is the 20-day moving average crossing at $13.63 1/4.
December soybean meal was higher overnight. Overnight trading sets the stage for a higher opening when the day session begins trading. Stochastics and the RSI have turned neutral to bullish signaling that sideways to higher prices are possible near-term. If December resumes the rally off the June 29th low, the 87% retracement level of the March-May decline crossing at $428.00 is the next upside target. Closes below the 20-day moving average crossing at $400.40 would confirm that a short-term top has been posted. First resistance is the 75% retracement level of the March-May decline crossing at $418.80. Second resistance is the 87% retracement level of the March-May decline crossing at $428.00. First support is the 20-day moving average crossing at $400.40. Second support is the 50-day moving average crossing at $389.60.
December soybean oil was lower in overnight trading as it consolidates some of its recent gains. Overnight weakness sets the stage for a lower opening when the day session begins trading. Stochastics and the RSI are overbought, diverging and are poised to turn bearish with additional weakness that would signal sideways to lower prices are possible near-term. If December extends the rally off May's low, the 87% retracement level of the 2022-2023 decline crossing at 68.81 is the next upside target. Closes below the 20-day moving average crossing at 60.51 would signal that a short-term top has been posted. First resistance is the 75% retracement level of the 2022-2023 decline crossing at 65.45. Second resistance is the 87% retracement level of the 2022-2023 decline crossing at 68.81. First support is the 10-day moving average crossing at 62.14. Second support is the 20-day moving average crossing at 60.51.
Thanks, tallpine!
Wheat is pulling down corn the most but also beans.
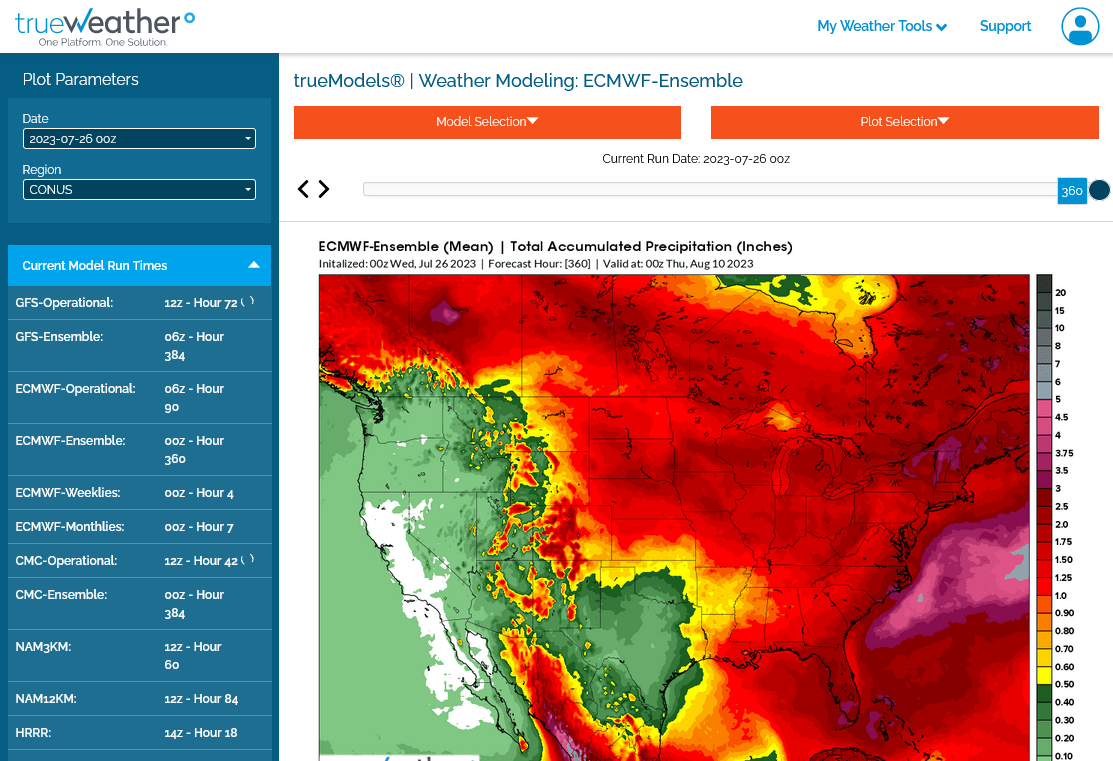
The weather is more bearish, especially the EE that really backs up the trough and brings widespread below temps to the cornbelt in early August.
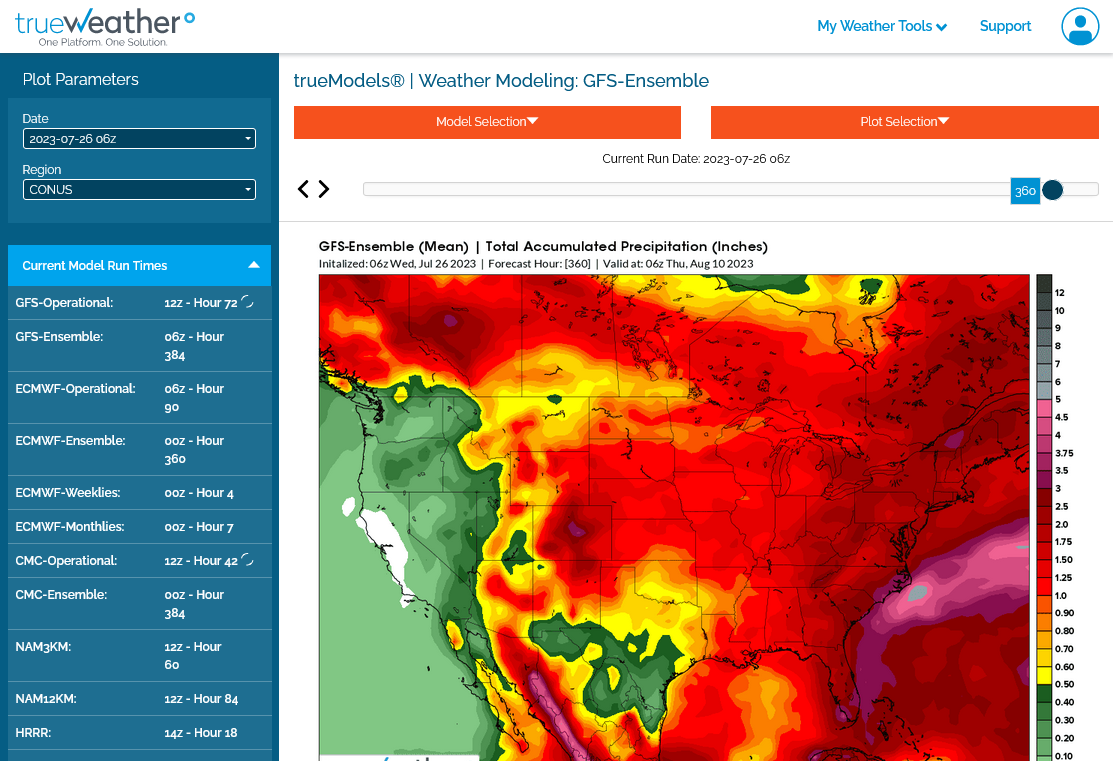
The GEFS continues not as cool and with much less rain.
1. GEFS rain total for 15 days
2. EE rains
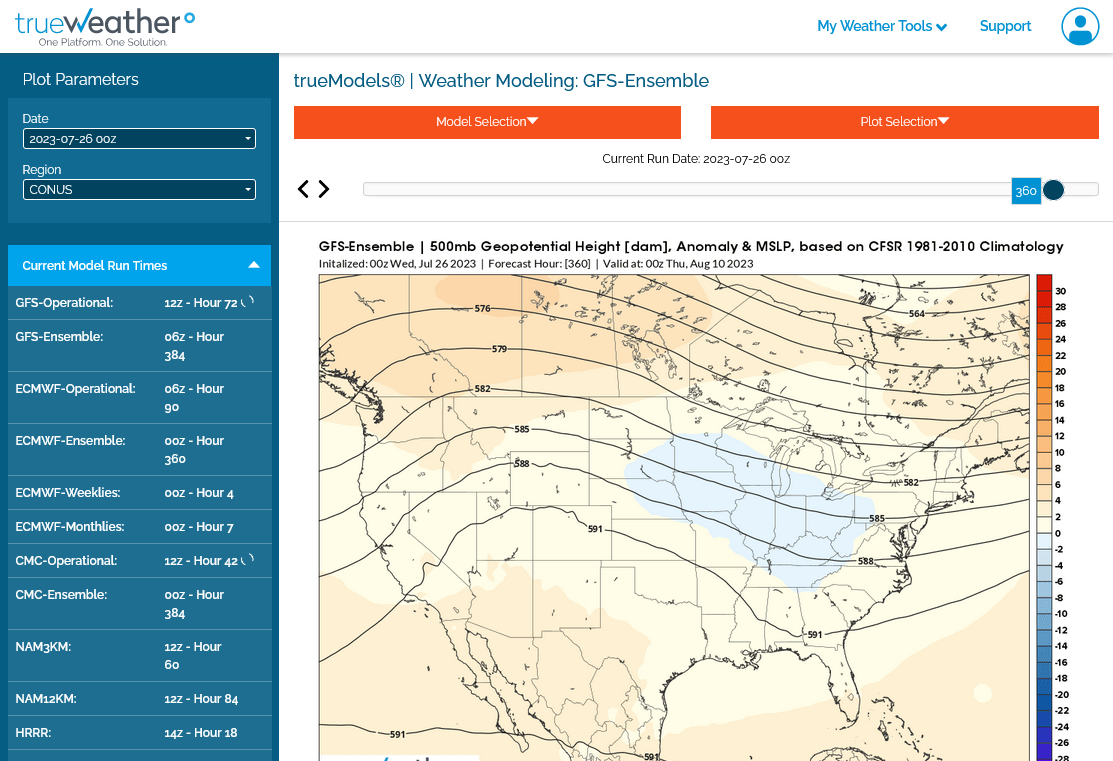
3. GEFS upper levels......cooling but not the coolest.....August 10 map
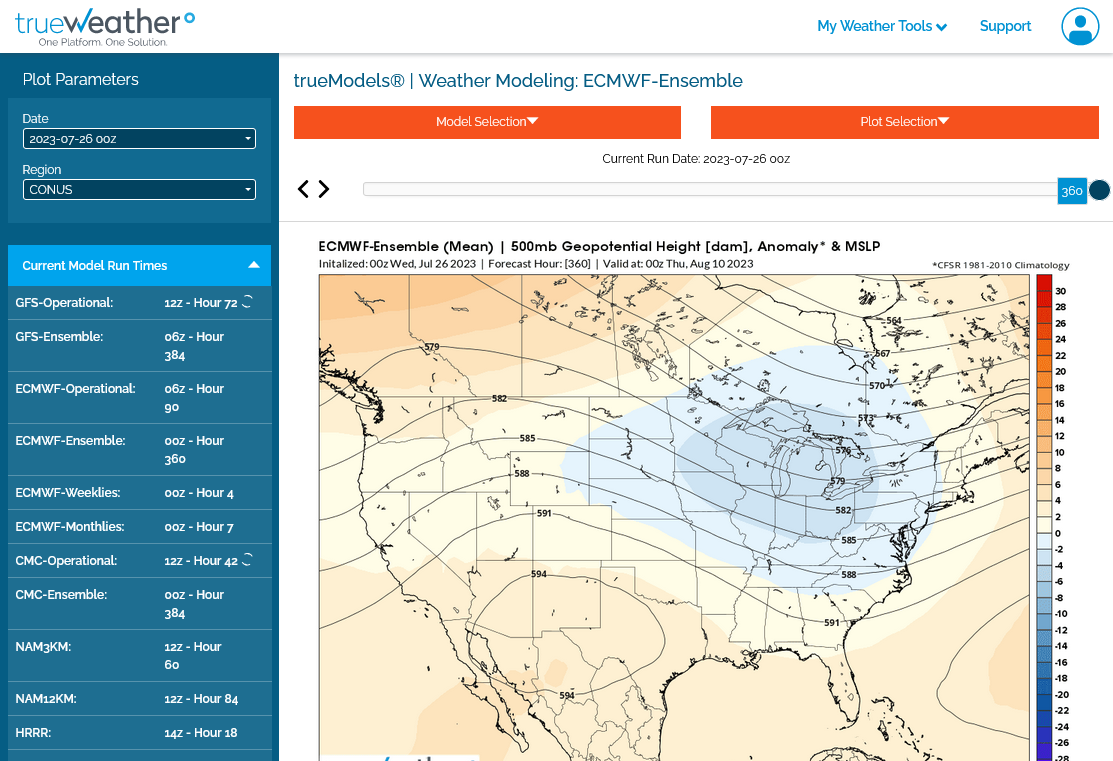
4. EE upper levels.......sharply cooler
The just updated 12z Canadian model is dominated by some very bearish members!
I'm continuing even cooler AND adding rains AND believing the wetter EE model has the right idea.
FOR LATE WEEK 2 !
https://weather.gc.ca/ensemble/charts_e.html?Hour=384&Day=0&RunTime=12&Type=gz
384h GZ 500 forecast valid on Aug 11, 2023 12 UTC


