KEY EVENTS TO WATCH FOR:
Wednesday, July 26, 2023
7:00 AM ET. MBA Weekly Mortgage Applications Survey
Composite Idx (previous 210.7)
Composite Idx, W/W% (previous +1.1%)
Purchase Idx-SA (previous 163.2)
Purchase Idx-SA, W/W% (previous -1.3%)
Refinance Idx (previous 446.4)
Refinance Idx, W/W% (previous +7.3%)
10:00 AM ET. June New Residential Sales
New Home Sales (previous 763K)
New Home Sales, M/M% (previous +12.2%)
New Home Sales Months Supply (previous 6.7)
10:30 AM ET. EIA Weekly Petroleum Status Report
Crude Oil Stocks (Bbl) (previous 457.42M)
Crude Oil Stocks, Net Chg (Bbl) (previous -0.708M)
Gasoline Stocks (Bbl) (previous 218.386M)
Gasoline Stocks, Net Chg (Bbl) (previous -1.066M)
Distillate Stocks (Bbl) (previous 118.194M)
Distillate Stocks, Net Chg (Bbl) (previous +0.013M)
Refinery Usage (previous 94.3%)
Total Prod Supplied (Bbl/day) (previous 20.767M)
Total Prod Supplied, Net Chg (Bbl/day) (previous +2.066M)
2:00 PM ET. U.S. interest rate decision
Federal Funds Rate
Federal Funds Rate Change (Pts)
Fed Funds Rate-Range High (previous 5.25)
Fed Funds Rate-Range Low (previous 5.00)
FOMC Vote For Action (previous 11)
FOMC Vote Against Action (previous 0)
Discount Rate (previous 5.25)
Discount Rate Change (Pts) (previous +0.00)
Discount Rate-Range High
Discount Rate-Range Low
Thursday, July 27, 2023
8:30 AM ET. U.S. Weekly Export Sales
8:30 AM ET. Unemployment Insurance Weekly Claims Report - Initial Claims
Jobless Claims
Jobless Claims, Net Chg
Continuing Claims
Continuing Claims, Net Chg
8:30 AM ET. June Advance Report on Durable Goods
Durable Goods-SA, M/M% (previous +1.7%)
Dur Goods, Ex-Defense, M/M% (previous +3%)
Dur Goods, Ex-Transport, M/M% (previous +0.6%)
Orders: Cap Gds, Non-Def, Ex-Air, M/M% (previous +0.7%)
Shipmnts: Cap Gds, Non-Def, Ex-Air, M/M% (previous +0.2%)
8:30 AM ET. 2nd Quarter Advance estimate GDP
Annual Rate, Q/Q% (previous +2.0%)
Chain-Weighted Price Idx, Q/Q% (previous +4.1%)
PCE Price Idx, Q/Q% (previous +4.1%)
Purchase Price Idx, Q/Q%
Real Final Sales 1st Est, Q/Q%
Core PCE Price Idx, Q/Q%
Personal Consumption, Q/Q% (previous +4.2%)
8:30 AM ET. June Advance Economic Indicators Report
10:00 AM ET. June Pending Home Sales Index
Pending Home Sales (previous 76.5)
Pending Home Sales Idx, M/M% (previous -2.7%)
Pending Home Sales Idx , Y/Y% (previous -22.2%)
10:30 AM ET. EIA Weekly Natural Gas Storage Report
Working Gas In Storage (Cbf)
Working Gas In Storage, Net Chg (Cbf)
11:00 AM ET. July Federal Reserve Bank of Kansas City Survey of Tenth District Manufacturing
Mfg Activity Idx (previous -10)
6-Mo Exp Prod Idx (previous 15)
Mfg Composite Idx (previous -12)
6-Mo Exp Composite Idx (previous -2)
4:30 PM ET. Federal Discount Window Borrowings
4:30 PM ET. Foreign Central Bank Holdings
Friday, July 28, 2023
8:30 AM ET. June Personal Income and Outlays
Personal Income, M/M% (previous +0.4%)
Consumer Spending, M/M% (previous +0.1%)
PCE Price Idx, M/M% (previous +0.1%)
PCE Price Idx, Y/Y% (previous +3.8%)
PCE Core Price Idx, M/M% (previous +0.3%)
PCE Core Price Idx, Y/Y% (previous +4.6%)
8:30 AM ET. 2nd Quarter Employment Cost Index
ECI, Q/Q% (previous +1.2%)
ECI, Y/Y% (previous +4.8%)
10:00 AM ET. July University of Michigan Survey of Consumers - final
End-Mo Sentiment Idx (previous 64.4)
End-Mo Expectations Idx (previous 61.5)
12-Month Inflation Forecast (previous 3.3%)
5-Year Inflation Forecast (previous 3.0%)
End-Mo Current Idx (previous 69.0)
3:00 PM ET. June Agricultural Prices
Farm Prices, M/M% (previous -2.8%)
The STOCK INDEXES? http://quotes.ino.com/ex?changes/?c=indexes
The Dow closed higher on Tuesday as it extends the rally off July's low. The mid-range close sets the stage for a steady to higher opening when Wednesday's day session begins trading. Stochastics and the RSI are overbought but remain neutral to bullish signaling that sideways to higher prices are possible near-term. If the Dow extends the rally off July's low, the February-2022 high crossing at 35,824.28 is the next upside target. Closes below the 20-day moving average crossing at 33,760.24 would signal that a short-term top has been posted. First resistance is the April - 2022 high crossing at 35,492.22. Second resistance is the February-2022 high crossing at 35,824.28. First support is the 10-day moving average crossing at 34,214.80. Second support is the 20-day moving average crossing at 33,760.22.
The September NASDAQ 100 closed higher on Tuesday. The high-range close sets the stage for a steady to higher opening when Wednesday's night session begins trading. Stochastics and the RSI are turning neutral to bullish signaling sideways to higher prices are possible. If September extends this year's rally, the December-2021 high on the weekly continuation chart crossing at 16,659.50 is the next upside target. Closes below the 20-day moving average crossing at 15,464.88 would confirm that a short-term top has been posted while opening the door for additional weakness. First resistance is last-Wednesday's high crossing at 16,062.75. Second resistance is the December-2021 high on the weekly continuation chart crossing at 16,659.50. First support is the 20-day moving average crossing at 15,464.88. Second support is the 50-day moving average crossing at 14,911.90.
The September S&P 500 closed higher on Tuesday. The high-range close sets the stage for a steady to higher opening when Wednesday's night session begins trading. Stochastics and the RSI are overbought but remain neutral to bullish signaling that sideways to higher prices are possible near-term. If September extends the rally off March's low, the 87% retracement level of the 2022 decline on the weekly chart crossing at 4639.07 is the next upside target. Closes below the 20-day moving average crossing at 4509.00 would confirm that a short-term top has been posted. First resistance is last-Wednesday's high crossing at 4609.25. Second resistance is the 87% retracement level of the 2022 decline on the weekly chart crossing at 4639.07. First support is the 10-day moving average crossing at 4564.77. Second support is the 20-day moving average crossing at 4509.00.
INTEREST RATES? http://quotes.ino.com/ex?changes/?c=interest ""
September T-bonds closed down 9/32's at 125-28.
September T-bonds closed lower on Tuesday. The low-range close sets the stage for a steady to lower opening when Wednesday's day session begins trading. Stochastics and the RSI are neutral to bearish signaling that sideways to lower prices are possible near-term. Today's close below last-Thursday's low crossing at 125-29 signals that a short-term top has been posted.If September renews the rally off July's low, the 50% retracement level of the April-July decline crossing at 128-21 is the next upside target. First resistance is the 50% retracement level of the April-July decline crossing at 128-21. Second resistance is the June high crossing at 129-16. First support is today's low crossing at 125-10. Second support is July's low crossing at 122-30.
September T-notes closed down 80-pts. at 111.255.
September T-notes closed lower on Tuesday as it extended last-week's decline. The low-range close sets the stage for a steady to lower opening when Wednesday's day session begins trading. Stochastics and the RSI are neutral to bearish signaling that sideways to lower prices are possible near-term. If September extends the aforementioned decline, July's low is the next downside target. If September renews the rally off the July 6th low, the 50-day moving average crossing at 113.064 would signal that a short-term low has been posted. First resistance is the 50-day moving average crossing at 113.064. Second resistance is the 50% retracement level of the May-July decline crossing at 113.313. First support is today's low crossing at 111.175. Second support is July's low crossing at 110.050.
ENERGY MARKETS? http://quotes.ino.com/ex?changes/?c=energy ""
September crude oil closed higher on Tuesday as it extended the rally off June's low. The high-range close sets the stage for a steady to higher opening when Wednesday's day session begins. Stochastics and the RSI are overbought but remain neutral to bullish signaling that sideways to higher prices are possible near-term. If September extends the rally off June's low, April's high crossing at $81.44 is the next upside target. Closes below the 20-day moving average crossing at $73.86 would signal that a short-term top has been posted. First resistance the 87% retracement level of the April-May decline crossing at $79.23. Second resistance is April's high crossing at $81.44. First support is the 20-day moving average crossing at $73.86. Second support is the 50-day moving average crossing at $72.06.
September heating oil closed higher on Tuesday as it extended the rally off May's low. The high-range close sets the stage for a steady to higher opening when Wednesday's day trading session begins. Stochastics and the RSI are overbought but remain neutral to bullish signaling that sideways to higher prices are possible near-term. If September extends the rally off May's low, the 62% retracement level of the 2022-2023 decline crossing at 2.8561 is the next upside target. Closes below the 20-day moving average crossing at 2.6505 would signal that a short-term top has been posted. First resistance is the 62% retracement level of the 2022-2023 decline crossing at 2.8561. Second resistance is the 75% retracement level of the 2022-2023 decline crossing at 3.0002. First support is the 10-day moving average crossing at 2.6605. Second support the 20-day moving average crossing at 2.5543.
September unleaded gas posted an inside day with a lower close on Tuesday as it consolidated some of the rally off May's low. The low-range close sets the stage for a steady to lower opening when Wednesday's day session begins trading. Stochastics and the RSI are overbought but remain neutral to bullish signaling that sideways to higher prices are possible near-term. If September extends the rally off the June 23rd low, the October-2022 high on the weekly continuation chart crossing at 3.0221 is the next upside target. Closes below the 20-day moving average crossing at 2.5617 would confirm that a short-term top has been posted. First resistance is Monday's high crossing at 2.8867. Second resistance is the October-2022 high on the weekly continuation chart crossing at 3.0221. First support is the 10-day moving average crossing at 2.6752. Second support is the 20-day moving average crossing at 2.5617.
September Henry natural gas closed higher on Tuesday as it consolidates above the 20-day moving average crossing at 2.647 signaling that a short-term low has been posted. The mid-range close sets the stage for a steady to higher opening when Wednesday's day session begins trading. Stochastics and the RSI are neutral to bullish signaling that sideways to higher prices are possible near-term.If September extends last-week's rally, June's high crossing at 2.911 is the next upside target. First resistance is the June high crossing at 2.911. Second resistance is the 25% retracement level of the 2022-2023 decline crossing at 3.193. First support is last-Monday's low crossing at 2.477. Second support is the June 1st low crossing at 2.249.
CURRENCIES? http://quotes.ino.com/ex?changes/?c=currencies ""
The September Dollar closed higher for the sixth-day in a row on Tuesday as it extends the rally off last-Tuesday's low. The mid-range close sets the stage for a steady to higher opening when Wednesday's session begins trading. Stochastics and the RSI are neutral to bullish signaling that sideways to higher prices are possible near-term. Closes above the 20-day moving average crossing at 101.317 would confirm that a short-term low has been posted. Closes below the 10-day moving average crossing at 100.198 would signal that a short-term top has been posted. First resistance is today's high crossing at 101.395. Second resistance is the 50-day moving average crossing at 102.257. First support is July's low crossing at 99.220. Second support is weekly support on the continuation chart crossing at 97.730.
The September Euro closed lower on Tuesday as it extended the decline off last-Tuesday's high. The low-range close sets the stage for a steady to lower opening when Wednesday's day session begins trading. Stochastics and the RSI are neutral to bearish signaling that sideways to lower prices are possible near-term. Today's close below the 20-day moving average crossing at $1.10827 signals that a short-term top has been posted. If September resumes the rally off July's low, the March 30th high crossing at 1.15190 is the next upside target. First resistance is July's high crossing at $1.13105. Second resistance is the March 30th high crossing at 1.15190. First support is today's low crossing at 1.10510 Second support is the 50-day moving average crossing at $1.09553.
The September British Pound closed higher on Tuesday as it consolidates some of the decline off the July 14th high. The high-range close sets the stage for a steady to higher opening when Wednesday's day session begins trading. Stochastics and the RSI are neutral to bearish signaling sideways to lower prices are possible near-term. If September extends the aforementioned decline, the 50-day moving average crossing at 1.2677 is the next downside target. Closes above the 10-day moving average crossing at 1.2975 would signal that a short-term low has been posted. First resistance is the 10-day moving average crossing at 1.2975. Second resistance is the July 14th high crossing at 1.3146. First support is Monday's low crossing at 1.2801. Second support is the 50-day moving average crossing at 1.2677.
The September Swiss Franc closed higher on Tuesday as it consolidated some of the decline off July's high. The high-range close sets the stage for a steady to higher opening when Wednesday's day session begins trading. Stochastics and the RSI are neutral to bearish signaling that sideways to lower prices are possible near-term. If September extends the decline off last-week's high. the 20-day moving average crossing at 1.14752 is the next downside target. If September renews the rally off May's low, the January 2019 high crossing at 1.18680 is the next upside target. First resistance is the July 18th high crossing at 1.17650. Second resistance is the January 2019 high crossing at 1.18680. First support is today's low crossing at 1.15605. Second support is the 20-day moving average crossing at 1.13226.
The September Canadian Dollar closed slightly lower on Tuesday. The high-range close sets the stage for a steady to higher opening when Wednesday's day session begins trading. Stochastics and the RSI are turning neutral signaling that sideways trading is possible near-term. Closes below last-Tuesday's low crossing at 75.57 would signal that a short-term top has been posted while opening the door for additional weakness near-term. If September renews the rally off the January 7th low, the September 12th 2022 high crossing at 77.11 is the next upside target. First resistance is the 38% retracement level of the 2021-2022 decline crossing at 76.28. Second resistance is the September 12th high crossing at 77.11. First support is last-Tuesday's low crossing at 75.57. Second support is the 50-day moving average crossing at 75.16.
The September Japanese Yen closed slightly higher on Tuesday as it consolidated some of the decline off July's high. The high-range close sets the stage for a steady to slightly higher opening when Wednesday’s day session begins trading. Stochastics and the RSI are neutral to bearish signaling that sideways to higher prices are possible near-term. If September resumes the rally off June's low, the 38% retracement level of the January-June decline crossing at 0.074017 is the next upside target. If September extends the decline off July's high, June's low crossing at 0.069755 is the next downside target. First resistance is July's high crossing at 0.073585. Second resistance is the 38% retracement level of the January-June decline crossing at 0.074017 is the next upside target. First support is last-Friday's low crossing at 0.071065. Second support is June's low crossing at 0.069755.
PRECIOUS METALS? http://quotes.ino.com/ex?changes/?c=metals ""
August gold closed higher on Monday as it consolidates some of the rally off June's low. The high-range close sets the stage for a steady to higher opening when Wednesday's day session begins trading. Stochastics and the RSI are neutral to bearish signaling that sideways to lower prices are possible near-term. Closes below the 20-day moving average crossing at $1947.00 would signal that a short-term top has been posted. If August renews the rally off June's low, June's high crossing at $2000.70 is the next upside target. First resistance is June's high crossing at $2000.70. Second resistance is May's high crossing at $2102.20. First support is the 20-day moving average crossing at $1947.00. Second support is June's low crossing at $1911.40.
September silver closed higher on Tuesday and the high-range close sets the stage for a steady to higher opening when Wednesday's day session begins trading. Stochastics and the RSI are neutral to bearish signaling that sideways to lower prices are possible near-term. Closes below the 50-day moving average crossing at 23.919 would signal that a short-term top has been posted. If July renews the rally off June's low, the 75% retracement level of the April-June decline crossing at 25.561 is the next upside target. First resistance is last-Thursday's high crossing at 25.475. Second resistance is the 75% retracement level of the April-June decline crossing at 25.561. First support is the 20-day moving average crossing at 24.036. Second support is the 50-day moving average crossing at 23.919.
September copper closed sharply higher on Tuesday. The high-range close sets the stage for a steady to higher opening when Wednesday's day session begins trading. Stochastics and the RSI are turning neutral to bullish signaling that sideways to higher prices are possible near-term. If September renews the rally, July's high crossing at 3.9540 is the next upside target. Closes below the 50-day moving average crossing at 3.7850 would signal that a short-term top has been posted. First resistance is July's high crossing at 3.9540. Second resistance is June's high crossing at 3.9640. First support is the 50-day moving average crossing at 3.7850. Second support is the June 29th low crossing at 3.6830.
GRAINS? http://quotes.ino.com/ex?changes/?c=grains "
December Corn closed down $0.03-cents at $5.65 1/4.
December corn posted an inside day with a lower close on Tuesday. The high-range close sets the stage for a steady to slightly lower opening when Wednesday's night session begins trading. Stochastics and the RSI are neutral to bullish signaling that sideways to higher prices are possible near-term. If December extends the rally off July's low, the 75% retracement level of the June-July decline crossing at $5.92 3/4 is the next upside target. Closes below last-Friday's low crossing at $5.31 1/4 would confirm that a short-term top has been posted. First resistance is the 62% retracement level of the June-July decline crossing at $5.73. Second resistance is the 75% retracement level of the June-July decline crossing at $5.92 3/4. First support is last-Friday's low crossing at $5.31 1/4. Second support is the 20-day moving average crossing at $5.20 3/4.
September wheat closed up $0.02 3/4-cents at $7.60 1/4.
September wheat closed higher on Tuesday as it extended the rally off July's low. The high-range close sets the stage for a steady to higher opening when Wednesday's day session begins trading. Stochastics and the RSI are overbought but remain neutral to bullish signaling that sideways to lower prices are possible near-term. If September extends the rally off July's low, the 38% retracement level of the 2022-2023 decline crossing at $7.95 1/4 is the next upside target. Closes below the 50-day moving average crossing at $6.63 1/2 would signal that a short-term top has been posted. First resistance is today's high crossing at $7.77 1/4. Second resistance is 38% retracement level of the 2022-2023 decline crossing at $7.95 1/4. First support is the 10-day moving average crossing at $6.92 3/4. Second support is the 20-day moving average crossing at $6.77 1/4.
September Kansas City Wheat closed down $0.05 3/4-cents at $9.12 3/4.
September Kansas City wheat closed lower on Tuesday as it consolidated some of Monday's rally. The mid-range close sets the stage for a steady to higher opening when Wednesday's day session begins trading. Stochastics and the RSI are overbought but remain neutral to bullish signaling that sideways to higher prices are possible near-term. If September extends the rally off July's low, the 50% retracement level of the 2022-2023 decline crossing at $9.46 3/4 is the next upside target. Closes below the 50-day moving average crossing at $8.29 is the next downside target. First resistance is today's high crossing at $9.29 3/4. Second resistance is the 50% retracement level of the 2022-2023 decline crossing at $9.46 3/4. First support is the 10-day moving average crossing at $8.51 1/4. Second support is the 20-day moving average crossing at $8.34 1/2.
September Minneapolis wheat closed down $0.04-cents crossing at $9.32.
September Minneapolis wheat closed lower on Tuesday. The mid-range close sets the stage for a steady to lower opening when Wednesday's day session begins trading. Stochastics and the RSI are becoming overbought but remain neutral to bullish signaling that sideways to higher prices are possible near-term. If September extends the rally off July's low, the 50% retracement level of the 2022-2023 decline crossing at $9.60 3/4 is the next upside target. Closes below the 20-day moving average crossing at $8.65 would signal that a short-term top has been posted. First resistance is the 50% retracement level of the 2022-2023 decline crossing at $9.60 3/4. Second resistance is the 62% retracement level of the 2022-2023 decline crossing at $10.05 1/2 is the next upside target. First support is the 20-day moving average crossing at $8.65. Second support is the 50-day moving average crossing at $8.43 3/4.
SOYBEAN COMPLEX? http://quotes.ino.com/ex?changes/?c=grains "
November soybeans closed down $0.04 1/2-cents at $14.20.
November soybeans posted an inside day with a lower close on Tuesday as it consolidated some of the rally off May's low. The mid-range close sets the stage for a steady to lower opening when Wednesday's day session begins trading. Stochastics and the RSI are overbought, diverging but remain neutral to bullish signaling that sideways to higher prices are possible near-term. If November extends the rally off May's low, the April-2022 high crossing at $14.48 1/4 is the next upside target. Closes below the 20-day moving average crossing at $13.57 would signal that a short-term top has been posted. First resistance is Monday's high crossing at $14.35. Second resistance is the April-2022 high crossing at $14.48 1/4. First support is the 10-day moving average crossing at $13.90. Second support is the 20-day moving average crossing at $12.57.
December soybean meal closed up $4.50 at $416.10.
December soybean meal closed higher on Tuesday. The high-range close sets the stage for a steady to higher opening when Wednesday's day session begins trading. Stochastics and the RSI are turning neutral to bullish signaling that sideways to higher prices are possible near-term. If December extends this month's rally, the 87% retracement level of the March-May decline crossing at $428.00 is the next upside target. Closes below the 20-day moving average crossing at $398.80 would signal that a short-term top has been posted. First resistance is the 75% retracement level of the March-May decline crossing at $418.80. Second resistance is the 87% retracement level of the March-May decline crossing at $428.00. First support is the 20-day moving average crossing at $398.80. Second support is the July 7th low crossing at $384.70.
December soybean oil closed down 48-pts. at 64.26.
December soybean oil posted an inside day with a lower close on Tuesday as it consolidated some of the rally off May's low.The mid-range close sets the stage for a steady opening when Wednesday's day session begins trading. Stochastics and the RSI are overbought but remain neutral to bullish signaling that sideways to higher prices are possible near-term. If December extends the rally off May's low, the 87% retracement level of the 2022-2023 decline crossing at 68.81 is the next upside target. Closes below the 20-day moving average crossing at 60.18 would signal that a short-term top has been posted. First resistance is Monday's high crossing at 65.58. Second resistance is the 87% retracement level of the 2022-2023 decline crossing at 68.81. First support is the 20-day moving average crossing at 60.18. Second support is the June 29th low crossing at 54.67.
LIVESTOCKhttp://quotes.ino.com/exchanges/?c=livestock
August hogs closed up $1.70 at $101.80.
August hogs closed higher on Tuesday as it extends the rally off May's low. The high-range close sets the stage for a steady to higher opening when Wednesday's day session begins trading. Stochastics and the RSI are overbought but remain neutral to bullish signaling that sideways to higher prices are possible near-term. If August extends the rally off May's low, the 87% retracement level of the 2022-2023 decline crossing at $104.40 is the next upside target. Closes below the 20-day moving average crossing at $96.16 would signal that a short-term top has been posted. First resistance is today's high crossing at $101.98. Second resistance is the 87% retracement level of the 2022-2023 decline crossing at $104.40. First support is the 20-day moving average crossing at $96.16. Second support is the 50-day moving average crossing at $89.34.
August cattle closed down $ .63 at $178.13.
August cattle closed lower on Tuesday as it extends the decline off last-Thursday's high. The low-range close sets the stage for a steady to lower opening on Wednesday. Stochastics and the RSI are neutral to bearish signaling that sideways to lower prices are possible near-term. Closes below the 20-day moving average crossing at $177.57 would signal that a short-term top has been posted. If August renews this year's rally into uncharted territory, upside targets will be hard to project. First resistance is last-Thursday's high crossing at $183.98. Second resistance is unknown. First support is the 20-day moving average crossing at $177.57. Second support is the 50-day moving average crossing at $172.19.
August Feeder cattle closed down $0.03 at $243.23.
August Feeder cattle closed slightly lower on Tuesday as it extends the trading range of the past three-weeks. The low-range close sets the stage for a steady to lower opening when Wednesday's day session begins trading. Stochastics and the RSI are neutral to bearish signaling that sideways to lower prices are possible near-term. Closes below the July 6th low crossing at $240.80 would mark a downside breakout of the aforementioned trading range. If August renews the rally off June's low into uncharted territory, upside targets will be hard to project. First resistance is July's high crossing at $251.30. Second resistance is unknown. First support is the July 6th low crossing at $240.80. Second support is the 50-day moving average crossing at $239.43.
FOOD & FIBERhttp://quotes.ino.com/ex changes/?c=food
September coffee closed lower on Tuesday. The low-range close sets the stage for a steady to lower opening on Wednesday. Stochastics and the RSI are neutral to bullish signaling sideways to higher prices are possible near-term. Closes above the reaction high crossing at $16.39 would signal that a short-term low has been posted. If September resumes the decline off June's high, the 87% retracement level of the January-April rally crossing at $15.20 is the next downside target. First resistance is Monday's high crossing at $16.55. Second resistance is the June 27th high crossing at $16.79. First support is last-Monday's low crossing at $15.51. Second support is the 87% retracement level of the January-April rally crossing at $15.20.
September cocoa closed sharply higher on Tuesday. The mid-range close sets the stage for a steady to higher opening on Wednesday. Stochastics and the RSI are overbought but remain neutral to bullish signaling that sideways to higher prices are possible near-term. If September extends the rally off March's low, monthly resistance crossing at 37.75 is the next upside target. Closes below the July 13th low crossing at 32.60 would confirm that a short-term top has been posted.
October sugar closed lower on Tuesday but remains above the 50-day moving average crossing at 24.56. The low-range close sets the stage for a steady to lower opening on Wednesday. Stochastics and the RSI are overbought but remain neutral to bullish signaling that sideways to higher prices are possible near-term. If October extends the rally off June's low, June's high crossing at 26.19 is the next upside target. Closes below the 20-day moving average crossing at 23.72 would signal that a short-term top has been posted.
December cotton closed sharply higher on Tuesday as it extends the rally off June's low. The high-range close sets the stage for a steady to higher opening on Wednesday. Stochastics and the RSI are overbought but remain neutral to bullish signaling sideways to higher prices are possible near-term. If December extends the rally off June's low, the 62% retracement level of the May-July decline crossing at 87.49 is the next upside target. Closes below the 20-day moving average crossing at 81.58 would signal that a short-term top has been posted.
thanks, tallpine!
Passing on the weather update that I just made to your closing comments
https://www.marketforum.com/forum/topic/97578/#97584
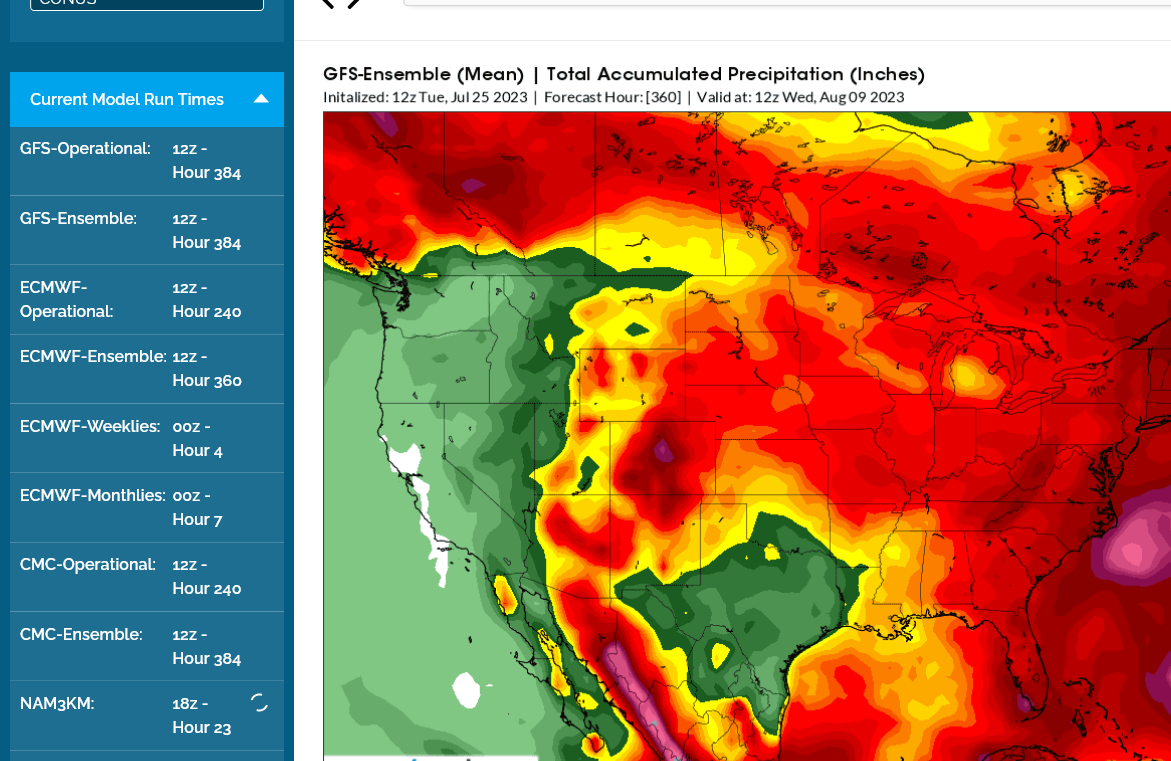
The 12z runs continued the same trends.
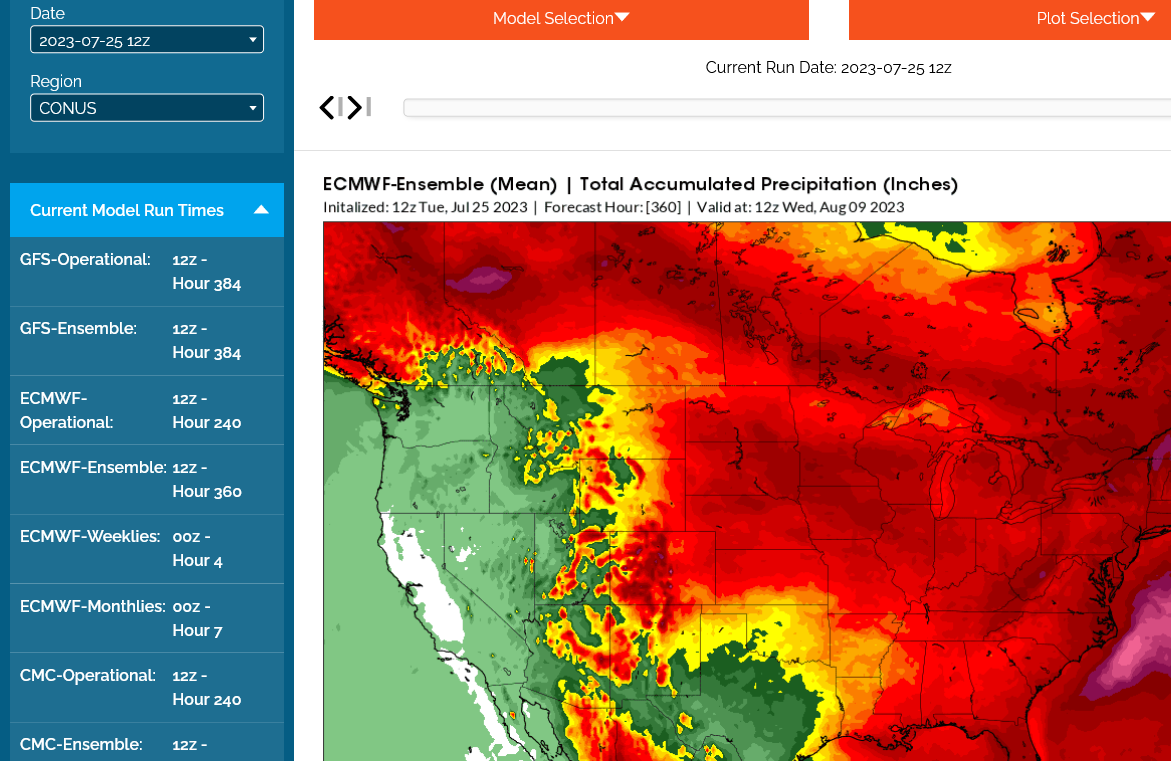
The EE is usually a better performing model, so we have to respect that.
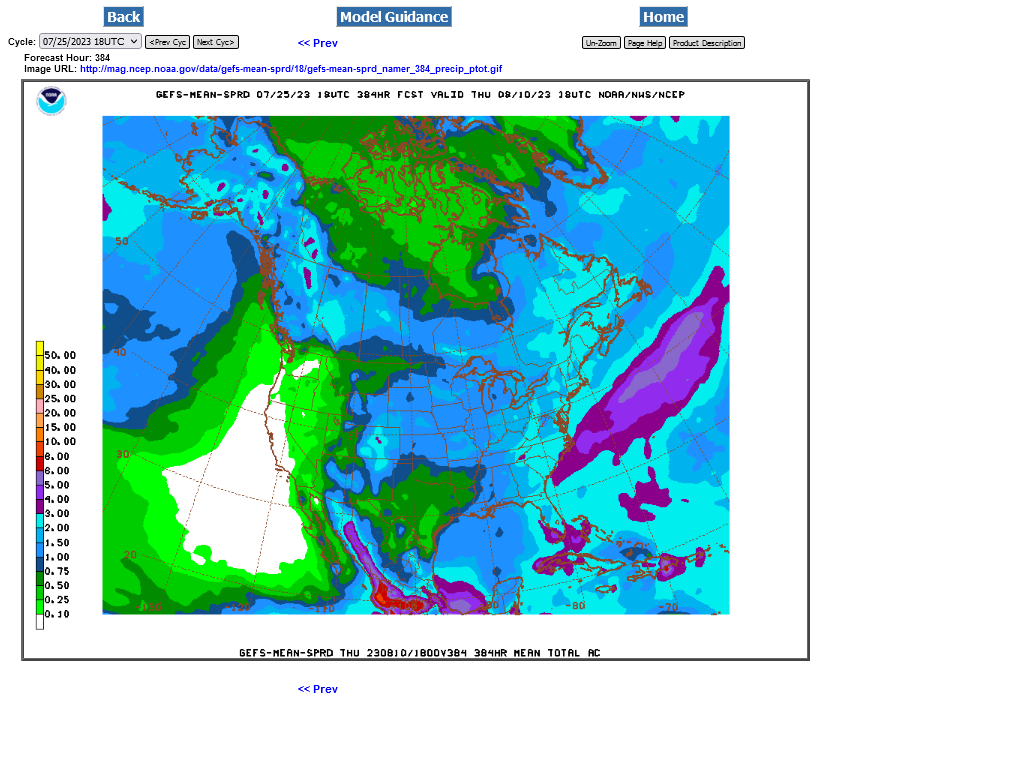
1. Drier GEFS that came out before the market closed.
2. Wetter EE that came out an hour after the close
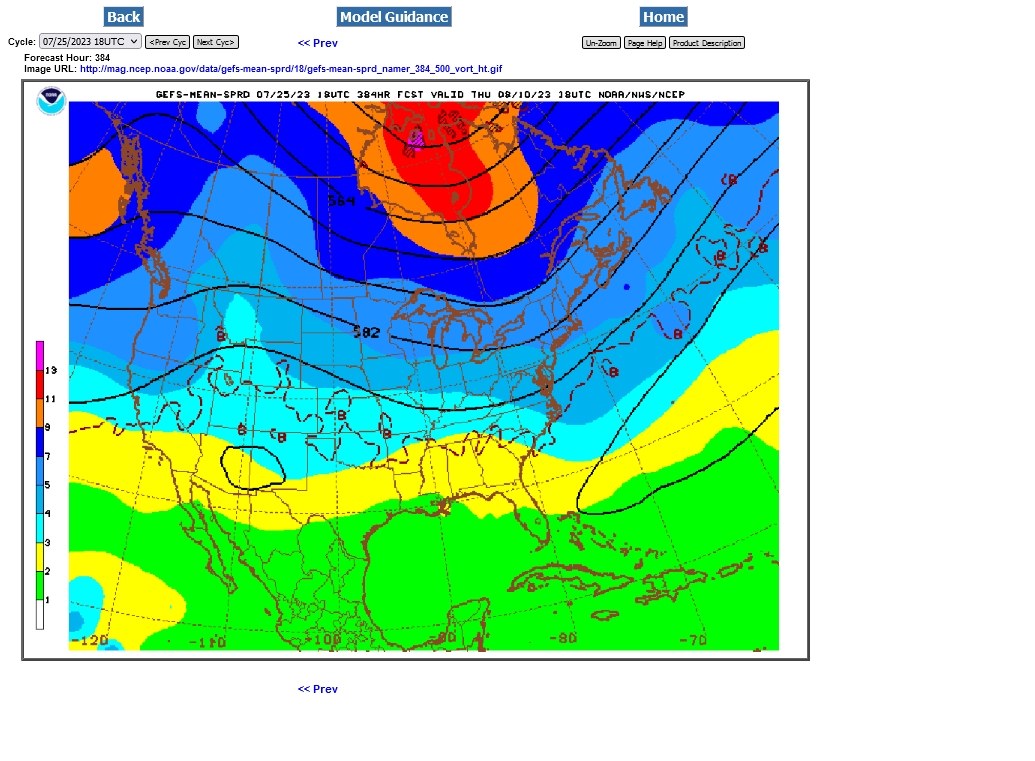
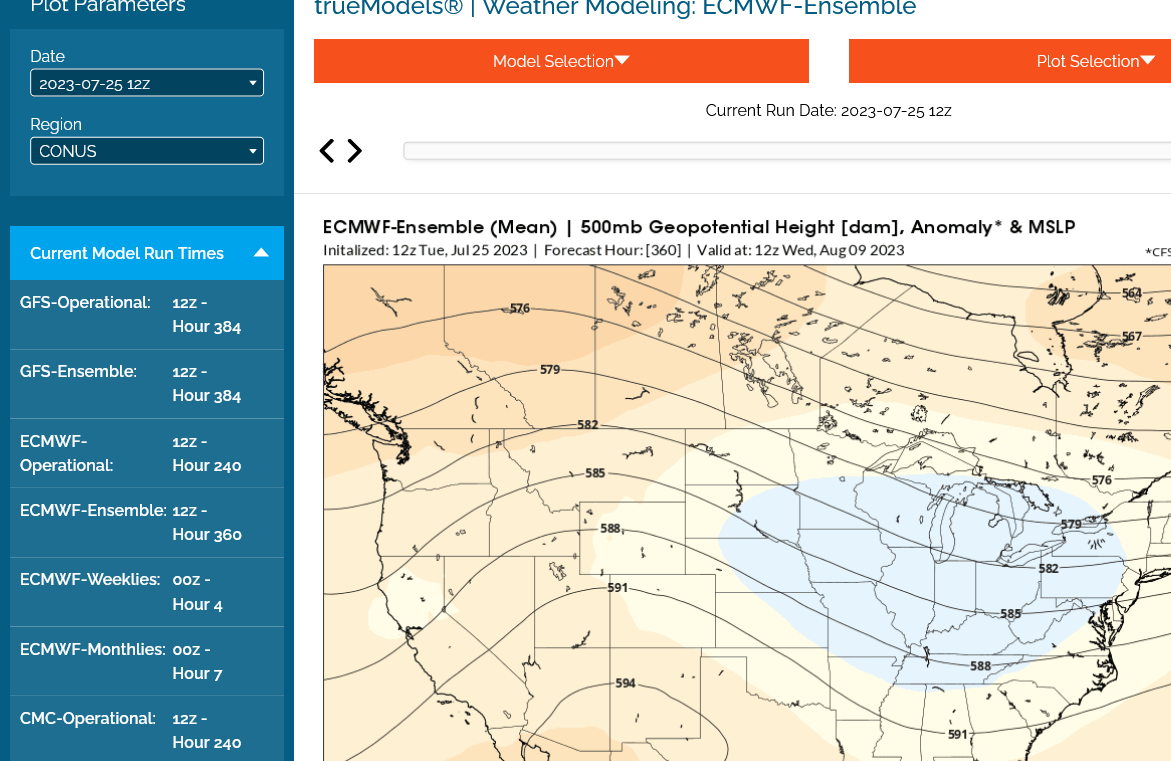
3. Upper levels in 2 weeks...both models agree it will be cooler in early August for the Midwest.
Northwest flow, as I've been saying is tricky. Historically, I remember alot of times when it disappoints with regards to rain amounts in the forecast. This makes me skeptical of the large area of 2 inch rain amounts on the EE in the darker reds.
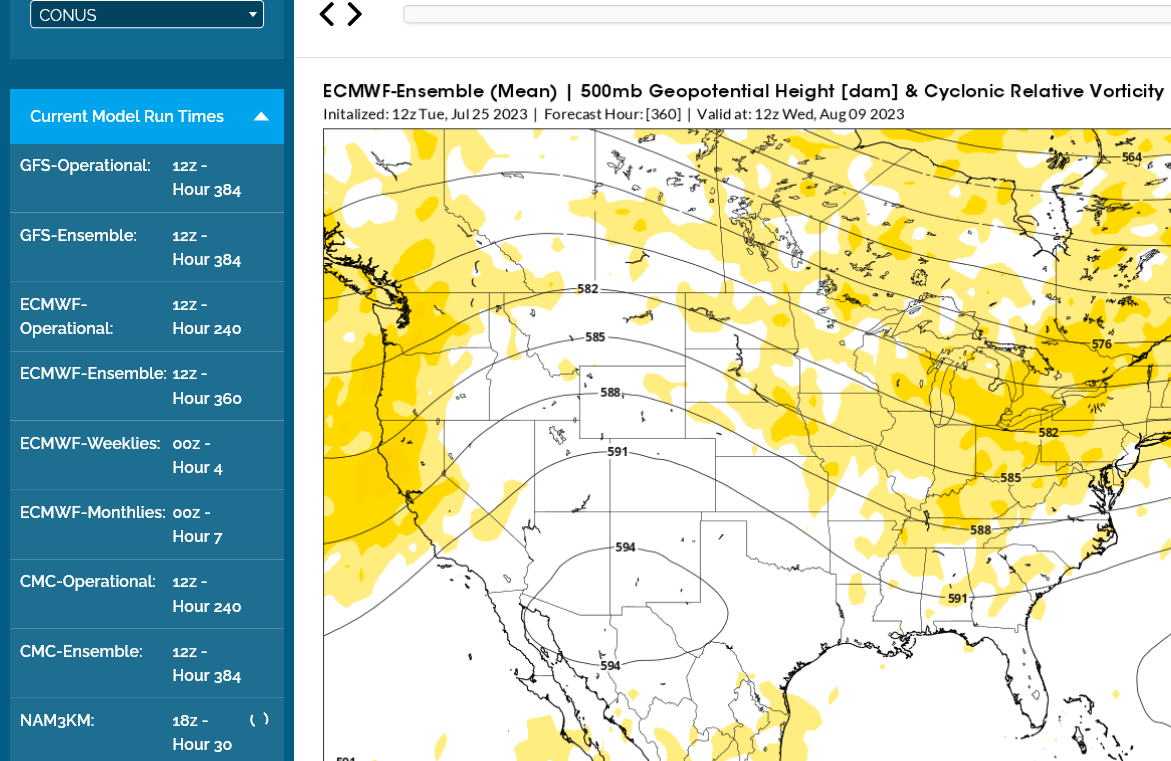
However, if it becomes active with several perturbations, then the flow can become pretty productive. This last map from the EE has alot of cyclonic vorticity in it which favors being active.........and thus so much rain from that model. I hope its right.
4. EE upper levels with vorticity
18z GEFS was a bit more bearish.
1. Upper levels. The trough in the Great Lakes is a bit deeper. Is the Bermuda High trying to build into the Southeast?
2. A tiny bit more rain Upper Midwest but still much drier than the EE and below average rains except the far ECB. A band of 1.5 inches in MN/WI that wasn't there before.
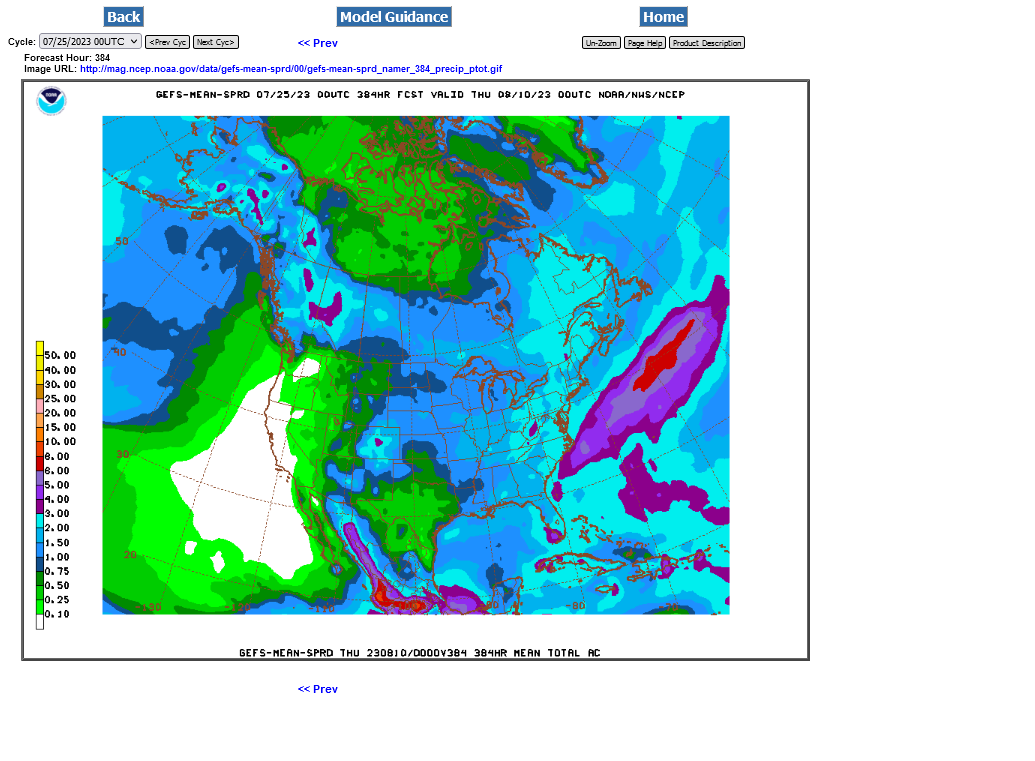
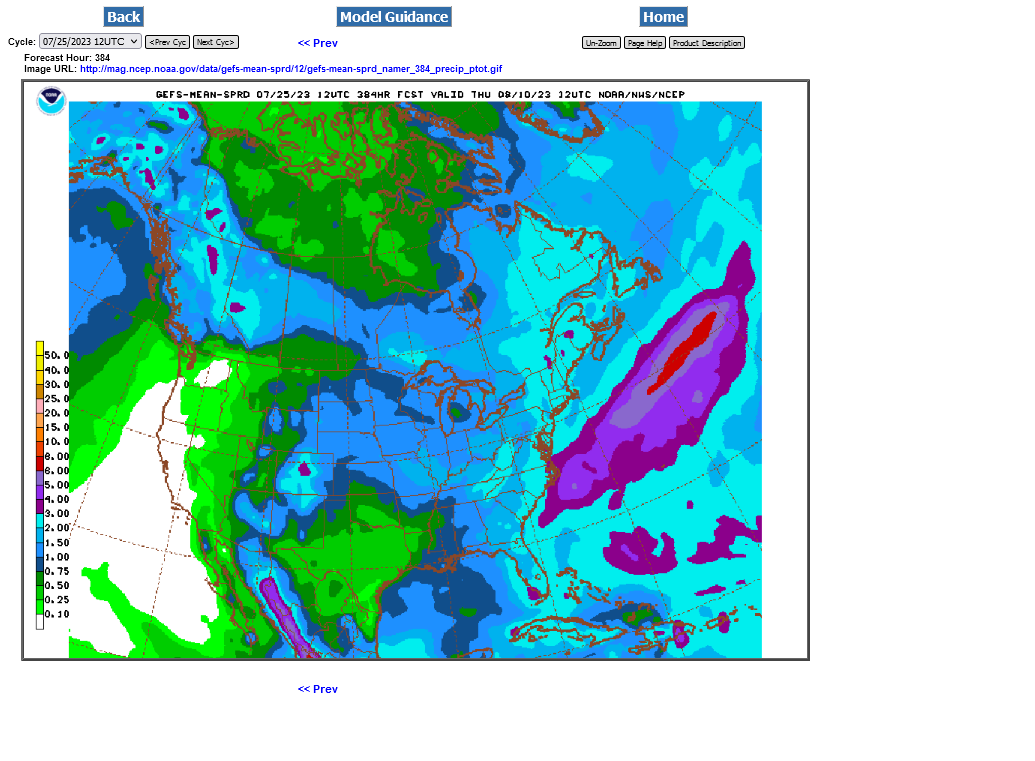
3. 12z run to compare
4. Last nights 0z run from 18 hours ago for another comparison. I think it's MN/WI that look like they have the only increase in rains from 18 hours ago to the last one and not alot. However, that part of the Midwest is hurting bad for rain right now, so let's hope it keeps getting wetter and the EE is right with it's 2 inches.