KEY EVENTS TO WATCH FOR:
Friday, July 21, 2023
10:00 AM ET. June State Employment and Unemployment
Monday, July 24, 2023
8:30 AM ET. June Chicago Fed National Activity Index (CFNAI)
NAI (previous -0.15)
NAI, 3-mo Moving Avg (previous -0.14)
9:45 AM ET. July US Flash Manufacturing PMI
PMI, Mfg (previous 46.3)
9:45 AM ET. July US Flash Services PMI
PMI, Services (previous 54.1)
Tuesday, July 25, 2023
8:55 AM ET. Johnson Redbook Retail Sales Index
Ret Sales Mo-to-Date, Y/Y% (previous -0.3%)
Latest Wk, Y/Y% (previous -0.2%)
9:00 AM ET. May U.S. Monthly House Price Index
9:00 AM ET. May S&P CoreLogic Case-Shiller Indices
10-City Idx, M/M% (previous +1.7%)
10-City Idx, Y/Y% (previous -1.2%)
20-City Idx, M/M% (previous +1.7%)
20-City Idx, Y/Y% (previous -1.7%)
National Idx, M/M% (previous +1.3%)
National Idx, Y/Y% (previous -0.2%)
10:00 AM ET. July Consumer Confidence Index
Cons Conf Idx (previous 109.7)
Expectation Idx (previous 79.3)
Present Situation Idx (previous 155.3)
10:00 AM ET. July Richmond Fed Business Activity Survey
Mfg Idx (previous -7)
Shipments Idx (previous -5)
1:00 PM ET. June Money Stock Measures
4:30 PM ET. API Weekly Statistical Bulletin
Crude Stocks, Net Chg (Bbls) (previous -0.8M)
Gasoline Stocks, Net Chg (Bbls) (previous -2.8M)
Distillate Stocks, Net Chg (Bbls) (previous -0.1M)
N/A U.S. Federal Open Market Committee meeting
Wednesday, July 26, 2023
7:00 AM ET. MBA Weekly Mortgage Applications Survey
Composite Idx (previous 210.7)
Composite Idx, W/W% (previous +1.1%)
Purchase Idx-SA (previous 163.2)
Purchase Idx-SA, W/W% (previous -1.3%)
Refinance Idx (previous 446.4)
Refinance Idx, W/W% (previous +7.3%)
10:00 AM ET. June New Residential Sales
New Home Sales (previous 763K)
New Home Sales, M/M% (previous +12.2%)
New Home Sales Months Supply (previous 6.7)
10:30 AM ET. EIA Weekly Petroleum Status Report
Crude Oil Stocks (Bbl) (previous 457.42M)
Crude Oil Stocks, Net Chg (Bbl) (previous -0.708M)
Gasoline Stocks (Bbl) (previous 218.386M)
Gasoline Stocks, Net Chg (Bbl) (previous -1.066M)
Distillate Stocks (Bbl) (previous 118.194M)
Distillate Stocks, Net Chg (Bbl) (previous +0.013M)
Refinery Usage (previous 94.3%)
Total Prod Supplied (Bbl/day) (previous 20.767M)
Total Prod Supplied, Net Chg (Bbl/day) (previous +2.066M)
2:00 PM ET. U.S. interest rate decision
Federal Funds Rate
Federal Funds Rate Change (Pts)
Fed Funds Rate-Range High (previous 5.25)
Fed Funds Rate-Range Low (previous 5.00)
FOMC Vote For Action (previous 11)
FOMC Vote Against Action (previous 0)
Discount Rate (previous 5.25)
Discount Rate Change (Pts) (previous +0.00)
Discount Rate-Range High
Discount Rate-Range Low
Thursday, July 27, 2023
8:30 AM ET. U.S. Weekly Export Sales
8:30 AM ET. Unemployment Insurance Weekly Claims Report - Initial Claims
Jobless Claims
Jobless Claims, Net Chg
Continuing Claims
Continuing Claims, Net Chg
8:30 AM ET. June Advance Report on Durable Goods
Durable Goods-SA, M/M% (previous +1.7%)
Dur Goods, Ex-Defense, M/M% (previous +3%)
Dur Goods, Ex-Transport, M/M% (previous +0.6%)
Orders: Cap Gds, Non-Def, Ex-Air, M/M% (previous +0.7%)
Shipmnts: Cap Gds, Non-Def, Ex-Air, M/M% (previous +0.2%)
8:30 AM ET. 2nd Quarter Advance estimate GDP
Annual Rate, Q/Q% (previous +2.0%)
Chain-Weighted Price Idx, Q/Q% (previous +4.1%)
PCE Price Idx, Q/Q% (previous +4.1%)
Purchase Price Idx, Q/Q%
Real Final Sales 1st Est, Q/Q%
Core PCE Price Idx, Q/Q%
Personal Consumption, Q/Q% (previous +4.2%)
8:30 AM ET. June Advance Economic Indicators Report
10:00 AM ET. June Pending Home Sales Index
Pending Home Sales (previous 76.5)
Pending Home Sales Idx, M/M% (previous -2.7%)
Pending Home Sales Idx , Y/Y% (previous -22.2%)
10:30 AM ET. EIA Weekly Natural Gas Storage Report
Working Gas In Storage (Cbf)
Working Gas In Storage, Net Chg (Cbf)
11:00 AM ET. July Federal Reserve Bank of Kansas City Survey of Tenth District Manufacturing
Mfg Activity Idx (previous -10)
6-Mo Exp Prod Idx (previous 15)
Mfg Composite Idx (previous -12)
6-Mo Exp Composite Idx (previous -2)
4:30 PM ET. Federal Discount Window Borrowings
4:30 PM ET. Foreign Central Bank Holdings
Friday, July 28, 2023
8:30 AM ET. June Personal Income and Outlays
Personal Income, M/M% (previous +0.4%)
Consumer Spending, M/M% (previous +0.1%)
PCE Price Idx, M/M% (previous +0.1%)
PCE Price Idx, Y/Y% (previous +3.8%)
PCE Core Price Idx, M/M% (previous +0.3%)
PCE Core Price Idx, Y/Y% (previous +4.6%)
8:30 AM ET. 2nd Quarter Employment Cost Index
ECI, Q/Q% (previous +1.2%)
ECI, Y/Y% (previous +4.8%)
10:00 AM ET. July University of Michigan Survey of Consumers - final
End-Mo Sentiment Idx (previous 64.4)
End-Mo Expectations Idx (previous 61.5)
12-Month Inflation Forecast (previous 3.3%)
5-Year Inflation Forecast (previous 3.0%)
End-Mo Current Idx (previous 69.0)
3:00 PM ET. June Agricultural Prices
Farm Prices, M/M% (previous -2.8%)
The STOCK INDEXES? http://quotes.ino.com/ex?changes/?c=indexes
The STOCK INDEXES: The September NASDAQ 100 was higher overnight as it consolidated some of Thursday's sharp decline. Overnight trading sets the stage a higher opening when the day session begins trading. Stochastics and the RSI have turned neutral to bearish signaling that sideways to lower prices are possible near-term. Closes below the 20-day moving average crossing at 15,403.29 would confirm that a short-term top has been posted. If September extends this year's rally, the December-2021 high on the weekly continuation chart crossing at 16,659.50 is the next upside target. First resistance is Wednesday's high crossing at 16,062.75. Second resistance is the December-2021 high on the weekly continuation chart crossing at 16,659.50. First support is the 10-day moving average crossing at 15,632.92. Second support is the 20-day moving average crossing at 15,403.29.
The September S&P 500 was was higher overnight as it consolidated some of Thursday's decline. Overnight trading sets the stage for a higher opening when the day session begins trading. Stochastics and the RSI are overbought but remain neutral to bullish signaling that sideways to higher prices are possible near-term. If June extends the rally off March's low, the 87% retracement level of the 2022 decline crossing at 4639.07 is the next upside target. Closes below the 20-day moving average crossing at 4488.19 would confirm that a short-term top has been posted. First resistance is Wednesday's high crossing at 4609.25. Second resistance is the 87% retracement level of the 2022 decline crossing at 4639.07. First support is the 10-day moving average crossing at 4538.80. Second support is the 20-day moving average crossing at 4488.19.
INTEREST RATES http://quotes.ino.com/ex changes/?c=interest"
INTEREST RATES: September T-bonds was slightly higher overnight as it consolidates some of Thursday's sharp decline. Overnight trading sets the stage for a slightly higher opening when the day session begins trading. Stochastics and the RSI remain neutral to bullish signaling that sideways to higher prices are possible near-term. If September extends the aforementioned rally, the 50% retracement level of the April-July decline crossing at 128-21 is the next upside target. Closes below the 10-day moving average crossing at 126-24 would signal that a short-term top has been posted. First resistance is the 50% retracement level of the April-July decline crossing at 128-21. Second resistance is June's high crossing at 129-16. First support is the 10-day moving average crossing at 126-24. Second support is July's low crossing at 122-30.
September T-notes were steady to slightly higher overnight as it consolidates some of Thursday's decline. Overnight trading sets the stage for a slightly higher opening when the day session begins trading. Stochastics and the RSI are turning neutral to bearish signaling that sideways to lower prices are possible near-term. If September extends this month's rally, the 50-day moving average crossing at 113.128 is the next upside target. Closes below Thursday's low crossing at 112.000 would confirm that a short-term top has been posted. First resistance is the 50-day moving average crossing at 113.128. Second resistance is June's high crossing at 115.000. First support is Thursday's low crossing at 112.000. Second support is the July 6th low crossing at 110.050.
ENERGY MARKETS? http://quotes.ino.com/ex?changes/?c=energy ""
ENERGIES:Septembercrude oil was slightly higher overnight while extending that trading range of the past two-weeks. Overnight trading sets the stage for a slightly higher opening when the day session begins trading. Stochastics and the RSI are overbought but remain neutral to bullish signaling that sideways to higher prices are possible near-term. If September renews the rally off the June 28th low, the 87% retracement level of the April-May decline crossing at $79.23 is the next upside target. Closes below the 20-day moving average crossing at $72.86 would signal that a short-term top has been posted. First resistance is the 75% retracement level of the April-May decline crossing at $77.14. Second resistance is the 87% retracement level of the April-May decline crossing at $79.23. First support is Monday's low crossing at 73.78. Second support is the 20-day moving average crossing at $72.86.
September heating oil was higher overnight and sets the stage for a higher opening when the day session begins trading. Stochastics and the RSI are overbought but remain neutral to bullish signaling that sideways to higher prices are possible near-term. If September extends the rally off May's low, the 50% retracement level of the 2022-2023 decline crossing at 2.7273 is the next upside target. Closes below the 20-day moving average crossing at 2.4982 would signal that a short-term top has been posted. First resistance is Wednesday's high crossing at 2.6681. Second resistance is the 50% retracement level of the 2022-2023 decline crossing at 2.7273. First support is Monday's low crossing at 2.5454. Second support is the 20-day moving average crossing at 2.5136.
September unleaded gas was higher overnight as it extends the rally off May's low. Overnight trading sets the stage for a higher opening when the day session begins trading. Stochastics and the RSI are overbought but remain neutral to bullish signaling that sideways to higher prices are possible near-term. If September extends the rally off May's low, the June-2022 high crossing at $2.8215 is the next upside target. Closes below the 20-day moving average crossing at 2.5150 would signal that a short-term top has been posted. First resistance is the overnight high crossing at $2.7232. Second resistance is the June-2022 high crossing at $2.8215. First support is the 10-day moving average crossing at $2.6110. Second support is the 20-day moving average crossing at $2.5150.
September natural gas was slightly higher overnight and sets the stage for a slightly higher opening when the day session begins trading. Stochastics and the RSI are neutral to bullish signaling that sideways to higher prices are possible near-term. If September extends this week's rally, the June 26th high crossing at 2.911 is the next upside target. If September renews the decline off June's high, June's low crossing at 2.249 is the next downside target. First resistance is the June 26th high crossing at 2.911. Second resistance is the 25% retracement level of the 2022-2023 decline crossing at 3.193. First support is Monday's low crossing at 2.477. Second support is the June 1st low crossing at 2.249.
CURRENCIEShttp://quotes.ino.com/ex changes/?c=currencies"
CURRENCIES:The September Dollar was steady to higher overnight as it extends the rally off Tuesday's high. Overnight trading sets the stage for a higher opening when the day session begins trading later this morning. Stochastics and the RSI are neutral to bullish signaling that sideways to higher prices are possible near-term. Closes above the 20-day moving average crossing at $101.429 would signal that a short-term low has been posted. If September renews the decline off the July 6th high, the March 30th low on the weekly continuation chart crossing at $97.730 is the next downside target. First resistance is the 20-day moving average crossing at $100.429. Second resistance is the 50-day moving average crossing at $102.293. First support is Tuesday's low crossing at $99.220. Second support is the March 30th -2022 low on the weekly continuation chart crossing at $97.730.
The September Euro was slightly lower overnight and sets the stage for a steady to slightly lower opening when the day session begins trading. Stochastics and the RSI are neutral to bearish signaling that sideways to lower prices are possible near-term. Closes below the 20-day moving average crossing at 1.10689 would signal that a short-term top has been posted while opening the door for additional weakness near-term. If September renews the rally off May's low, the March 30th -2022 crossing at $1.15190 is the next upside target. First resistance is Tuesday's high crossing at $1.13105. Second resistance is the March 30th -2022 crossing at $1.15190. First support is the 10-day moving average crossing at 1.11868. Second support is the 20-day moving average crossing at 1.10689.
The September British Pound was steady to slightly lower overnight as it extends the decline off last-Friday high. Overnight trading and sets the stage for a slightly lower opening when the day session begins trading. Stochastics and the RSI are neutral to bearish signaling that sideways to lower prices near-term. Closes below the 20-day moving average crossing at 1.2848 would signal that a short-term top has been posted. If September resumes the rally off May's low, the 75% retracement level of the 2022-2023 decline crossing at 1.3253 is the next upside target. First resistance is last-Friday's high crossing at 1.3146. Second resistance is the 75% retracement level of the 2022-2023 decline crossing at 1.3253. First support is the 20-day moving average crossing at 1.2848. Second support is the 50-day moving average crossing at 1.2666.
The September Swiss Franc was steady to slightly higher overnight and sets the stage for a slightly higher opening when the day session begins trading. Stochastics and the RSI are turning neutral to bearish signaling that sideways to lower prices are possible near-term. Closes below the 20-day moving average crossing at 1.14400 would signal that a short-term top has been posted. If September resumes the rally off May's low, the January 2019 high crossing at 1.18680 is the next upside target. First resistance is Tuesday's high crossing at 1.17650. Second resistance is the January 2019 high crossing at 1.18680. First support is the 10-day moving average crossing at 1.16226. Second support is the 20-day moving average crossing at 1.14400.
The September Canadian Dollar was steady to slightly higher overnight as it extends the trading range of the past two-week's. Overnight trading sets the stage for a slightly higher opening when the day session begins trading. Stochastics and the RSI are neutral signaling that sideways to higher prices are possible near-term. If September renews the rally off July's low, the September-12th -2022 high crossing at $77.11 is the next upside target. Closes below the 20-day moving average crossing at $75.75 would signal that a short-term top has been posted. First resistance is the 38% retracement level of the 2022-2023 decline crossing at $76.28. Second resistance is the September-12th -2022 high crossing at $77.11. First support is the 20-day moving average crossing at $75.75. Second support is the 50-day moving average crossing at $75.11.
The September Japanese Yen was sharply lower overnight as it extends this week's decline. Overnight trading sets the stage for a sharply lower opening when the day session begins trading. Stochastics and the RSI are neutral to bearish signaling that sideways to lower prices are possible near-term. Closes below the 20-day moving average crossing at 0.071310 would confirm that a short-term top has been posted. If September renews the rally off May's low, the 38% retracement level of the January-July decline crossing at 0.074017 is the next upside target. First resistance is last-Friday's high crossing at 0.073585. Second resistance is the 38% retracement level of the January-June decline crossing at 0.074017. First support is the 20-day moving average crossing at 0.071310. Second support is June's low crossing at 0.069755.
PRECIOUS METALS http://quotes.ino.com/ex changes/?c=metals"
Precious Metals: Augustgold was lower overnight as it consolidates some of the rally off June's low. Overnight trading sets the stage for a steady to lower opening when the day session begins trading later this morning. Stochastics and the RSI are overbought and are turning neutral to bearish signaling that sideways to lower prices are possible near-term. Closes below the 20-day moving average crossing at $1943.70 would signal that a short-term top has been posted. If August renews the rally off June's low, June's high crossing at $2000.70 is the next upside target. First resistance is June's high crossing at $2000.70. Second resistance is the May 15th high crossing at $2046.50. First support is the 20-day moving average crossing at $1943.70. Second support is June's low crossing at $1900.60.
September silver was steady to slightly lower overnight as it consolidates some of this week's rally. Overnight trading sets the stage for a slightly lower opening when the day session begins trading later this morning. Stochastics and the RSI are overbought but remain neutral to bullish signaling that sideways to higher prices are possible near-term. If July extends the rally off June's low, the 75% retracement level of the May-June decline crossing at $25.561 is the next upside target. Closes below the 20-day moving average crossing at $23.848 would signal that a short-term top has been posted. First resistance is Thursday's high crossing at $25.475. Second resistance is the 75% retracement level of the May-June decline crossing at 25.561. First support is the 10-day moving average crossing at $24.665. Second support is the 50-day moving average crossing at $23.943.
September copper was slightly lower overnight. Overnight trading sets the stage for a slightly lower opening when the day session begins trading. Stochastics and the RSI are neutral to bearish signaling that sideways to lower prices are possible near-term. Closes below the 50-day moving average crossing at 3.7811 would signal that a short-term top has been posted. If September renews the rally off the June 29th low, June's high crossing at 3.9640 is the next upside target. First resistance June's high crossing at 3.9640. Second resistance is May's high crossing at 4.0100. First support is the 50-day moving average crossing at 3.7811. Second support is the June 29th low crossing at 3.6830.
GRAINS http://quotes.ino.com/ex changes/?c=grains
Grains: December corn was lower in late-overnight trading as it consolidates some of the rally off last-Thursday's low. Overnight trading sets the stage for a lower opening when the day sessions begins trading. Stochastics and the RSI are neutral to bullish signaling that sideways to higher prices are possible near-term. If December extends the rally off last-Thursday's low, the 62% retracement level of the June-July decline crossing at $5.73 is the next upside target. Closes below the 10-day moving average crossing at $5.17 1/4 would signal that a short-term top has been posted. First resistance is the 50% retracement level of the June-July decline crossing at $5.55 1/2. Second resistance is the 62% retracement level of the June-July decline crossing at $5.73 1/2. First support is the 20-day moving average crossing at $5.22 3/4. Second support is the 10-day moving average crossing at $5.17 1/4.
September wheat was sharply lower overnight as it consolidates some of the rally off July's low. Overnight trading sets the stage for a sharply lower opening when the day session begins trading. Stochastics and the RSI are neutral to bullish signaling that sideways to higher prices are possible near-term. If September extends the rally off July's low, June's high crossing at $7.70 1/4 is the next upside target. Closes below the 50-day moving average crossing at $6.59 1/4 would signal that a short-term top has been posted. First resistance is June's high crossing at $7.70 1/4. Second resistance is the 38% retracement level of the 2022-2023 decline crossing at $7.95 1/4. First support is the 20-day moving average crossing at $6.76. Second support is the 50-day moving average crossing at $6.59 1/4.
September Kansas City wheat was sharply lower overnight as it consolidates some of the rally off July's low. Overnight trading sets the stage for a sharply lower opening when the day session begins trading later this morning. Stochastics and the RSI are neutral to bullish signaling that sideways to higher prices are possible near-term. If September extends the overnight rally, the May 17th high crossing at $9.02 is the next upside target. Closes below the 50-day moving average crossing at $8.25 1/2 would signal that a short-term top has been posted. First resistance is Thursday's high crossing at $8.91. Second resistance is the May 17th high crossing at $9.02. First support is the 20-day moving average crossing at $8.28 3/4. Second support is the 50-day moving average crossing at $8.25 1/2.
September Minneapolis wheat was lower overnight as it consolidates some of the rally off May's low. Overnight trading sets the stage for a lower opening when the day session begins trading. Stochastics and the RSI are overbought but remain neutral to bullish signaling that sideways to higher prices are possible near-term. If September extends the rally off July's low, the 50% retracement level of the 2022-2023 decline crossing at $9.60 3/4 is the next upside target. Closes below the 20-day moving average crossing at $8.59 would confirm that a short-term top has been posted. First resistance is the 38% retracement level of the 2022-2023 decline crossing at $9.16 1/4. Second resistance is the 50% retracement level of the 2022-2023 decline crossing at $9.60 3/4. First support is the 20-day moving average crossing at $8.59. Second support is the 50-day moving average crossing at $8.40 1/4.
SOYBEAN COMPLEX? http://quotes.ino.com/ex?changes/?c=grains "
November soybeans were sharply lower overnight as they consolidate some of the rally off May's low. Overnight trading sets the stage for a sharply lower opening when the day session begins trading later this morning. Stochastics and the RSI are overbought but are turning neutral to bearish signaling that sideways to lower prices are possible near-term. Closes below the 20-day moving average crossing at $13.45 3/4 would signal that a short-term top has been posted. If November extends the rally off May's low, the May-2022 high crossing at $14.35 is the next upside target. First resistance is the 87% retracement level of the 2022-2023 decline crossing at $14.07 1/2. Second resistance is the May-2022 high crossing at $14.35. First support is the 20-day moving average crossing at $13.45 3/4. Second support is the July 7th low crossing at $13.15 1/2.
December soybean meal was sharply lower overnight as it extends the decline off Wednesday's high. Overnight weakness sets the stage for a sharply lower opening when the day session begins trading. Stochastics and the RSI have turned neutral to bearish signaling that sideways to lower prices are possible near-term. Closes below the 20-day moving average crossing at $397.00 would confirm that a short-term top has been posted. If December resumes the rally off the June 29th low, the 87% retracement level of the March-May decline crossing at $428.00 is the next upside target. First resistance is the 75% retracement level of the March-May decline crossing at $418.80. Second resistance is the 87% retracement level of the March-May decline crossing at $428.00. First support is the 20-day moving average crossing at $397.00. Second support is the 50-day moving average crossing at $388.10.
December soybean oil is was lower overnight as it consolidates some of this week's gains. Overnight weakness sets the stage for a lower opening when the day session begins trading. Stochastics and the RSI are overbought, diverging but remain neutral to bullish signaling that sideways to higher prices are possible near-term. If December renews the rally off May's low, the 75% retracement level of the 2022-2023 decline crossing at 65.45 is the next upside target. Closes below the 20-day moving average crossing at 59.25 would signal that a short-term top has been posted. First resistance is the 62% retracement level of the 2022-2023 decline crossing at 61.75. Second resistance is the 75% retracement level of the 2022-2023 decline crossing at 65.45. First support is the 20-day moving average crossing at 59.25. Second support is the June 29th low crossing at 54.67.
LIVESTOCKhttp://quotes.ino.com/exchanges/?c=livestock
August hogs closed up $2.70 at $100.63.
August hogs gapped up and closed higher on Thursday as it renewed the rally off May's low. The high-range close sets the stage for a steady to higher opening when Friday's day session begins trading. Stochastics and the RSI have turned neutral to bullish signaling that sideways to higher prices are possible near-term. If August extends the rally off May's low, the 87% retracement level of the 2022-2023 decline crossing at $104.40 is the next upside target. Closes below the 20-day moving average crossing at $94.51 would signal that a short-term top has been posted. First resistance is today's high crossing at $101.85. Second resistance is the 87% retracement level of the 2022-2023 decline crossing at $104.40. First support is the 20-day moving average crossing at $94.51. Second support is the 50-day moving average crossing at $88.50.
August cattle closed down $1.00 at $180.33.
August cattle posted a key reversal down as it closed lower on Thursday as it consolidates some of this year's rally. Additional weakness on Friday would increase the odds that a short-term top has been posted. The low-range close sets the stage for a steady to lower opening on Friday. Stochastics and the RSI are overbought but remain neutral to bullish signaling that sideways to higher prices are possible near-term. If August extends this year's rally into uncharted territory, upside targets will be hard to project. Closes below the 20-day moving average crossing at $176.35 would signal that a short-term top has been posted. First resistance is today's high crossing at $183.98. Second resistance is unknown. First support is the 20-day moving average crossing at $176.35. Second support is the 50-day moving average crossing at $171.12.
August Feeder cattle closed down $1.70 at $245.10.
August Feeder cattle posted a key reversal down and closed lower on Thursday as it extends the trading range of the past three-weeks. The low-range close sets the stage for a steady to lower opening when Friday's day session begins trading. Stochastics and the RSI have turned neutral to bearish signaling that sideways to lower prices are possible near-term. Closes below the 20-day moving average crossing at $243.41 would signal that a short-term top has been posted. If August renews the rally off June's low into uncharted territory, upside targets will be hard to project. First resistance is last-Wednesday's high crossing at $251.30. Second resistance is unknown. First support is the 20-day moving average crossing at $243.41. Second support is the 50-day moving average crossing at $238.33.
FOOD & FIBERhttp://quotes.ino.com/ex changes/?c=food
September coffee closed higher on Thursday. The high-range close sets the stage for a steady to higher opening on Friday. Stochastics and the RSI are oversold but remain neutral to bearish signaling sideways to lower prices are possible near-term. If September extends the decline off June's high, the 87% retracement level of the January-April rally crossing at $15.20 is the next downside target. Closes above Monday's high crossing at $16.17 would signal that a short-term low has been posted. First resistance is Monday's high crossing at $16.17. Second resistance is the June 27th high crossing at $16.79. First support is Monday's low crossing at $15.51. Second support is the 87% retracement level of the January-April rally crossing at $15.20.
September cocoa closed lower on Thursday. The low-range close sets the stage for a steady to lower opening on Friday. Stochastics and the RSI are overbought but remain neutral to bullish signaling that sideways to higher prices are possible near-term. If September extends the rally off March's low, monthly resistance crossing at 37.75 is the next upside target. Closes below last-Thursday's low crossing at 32.60 would confirm that a short-term top has been posted.
October sugar closed higher on Thursday as it extends the rally off June's low. The high-range close sets the stage for a steady to higher opening on Friday. Stochastics and the RSI are overbought but remain neutral to bullish signaling that sideways to higher prices are possible near-term. Closes above the 50-day moving average crossing at 24.62 would open the door for additional gains and a possible test of June's high crossing at 26.19. Closes below the 20-day moving average crossing at 23.64 would signal that a short-term top has been posted.
December cotton closed higher on Thursday as it extends the rally off June's low. The mid-range close sets the stage for a steady to higher opening on Friday. Stochastics and the RSI are overbought but remain neutral to bullish signaling sideways to higher prices are possible near-term. If December extends the rally off June's low, March's high crossing at 85.75 is the next upside target. Closes below the 20-day moving average crossing at 80.58 would signal that a short-term top has been posted.
Thanks again tallpine.
The bullish case continues to slowly erode for the grains.
not bearish weather but it seems like manny model runs look a tiny bit less threatening than previous ones.
some are still pretty dry.
the big item missing that always fuels bull weather markets in the growing season is the heat ridge shifting in.
most models continue the northwest flow.
this is tricky because it can often be fairly dry With cold fronts periodically cutting off the heat Not having the best ingredients.
I’m actually still modestly bullish for the WCB that will see the most heat and least rain.
but the market comes in every day and compares the updated forecast to yesterdays forecast.
if it’s less bullish but still bullish and we’ve shot much higher based on really bullish weather forecasts, then we can go lower on a less bullish forecast.
This won't matter on sunday night but the amounts on the last GEFS 5 hours ago were below average in the WCB, then around average in the CCB, then above average in the ECB.
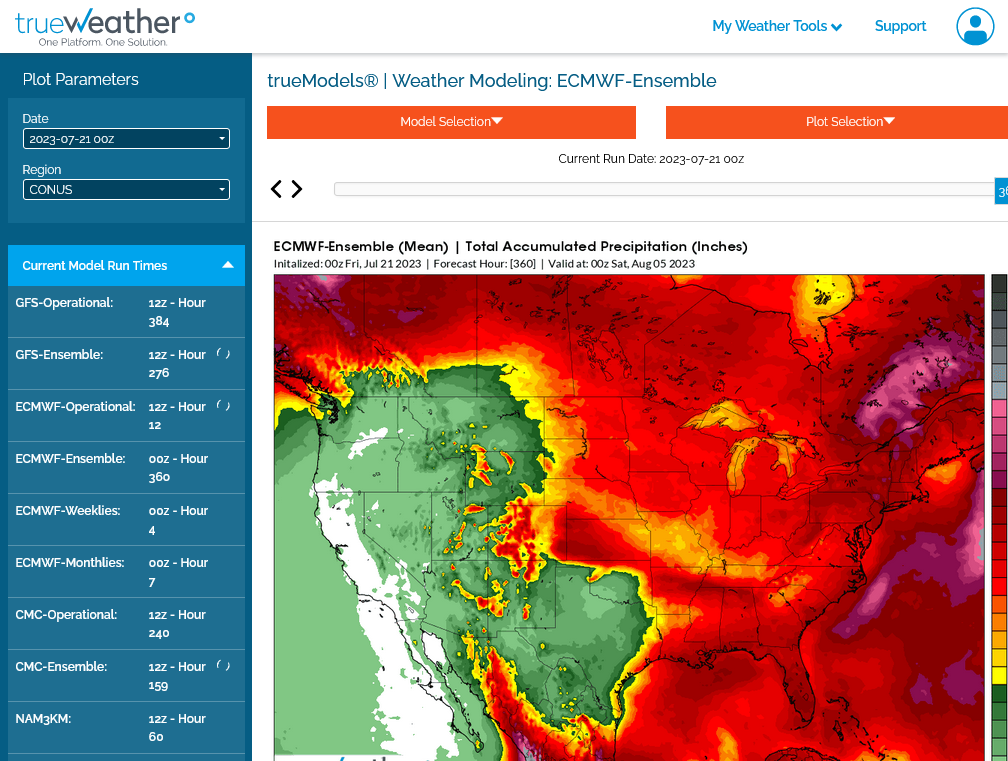
These maps/models have become increasingly LESS bullish. The EE is much drier which is the main reason I don't call the weather bearish right now.
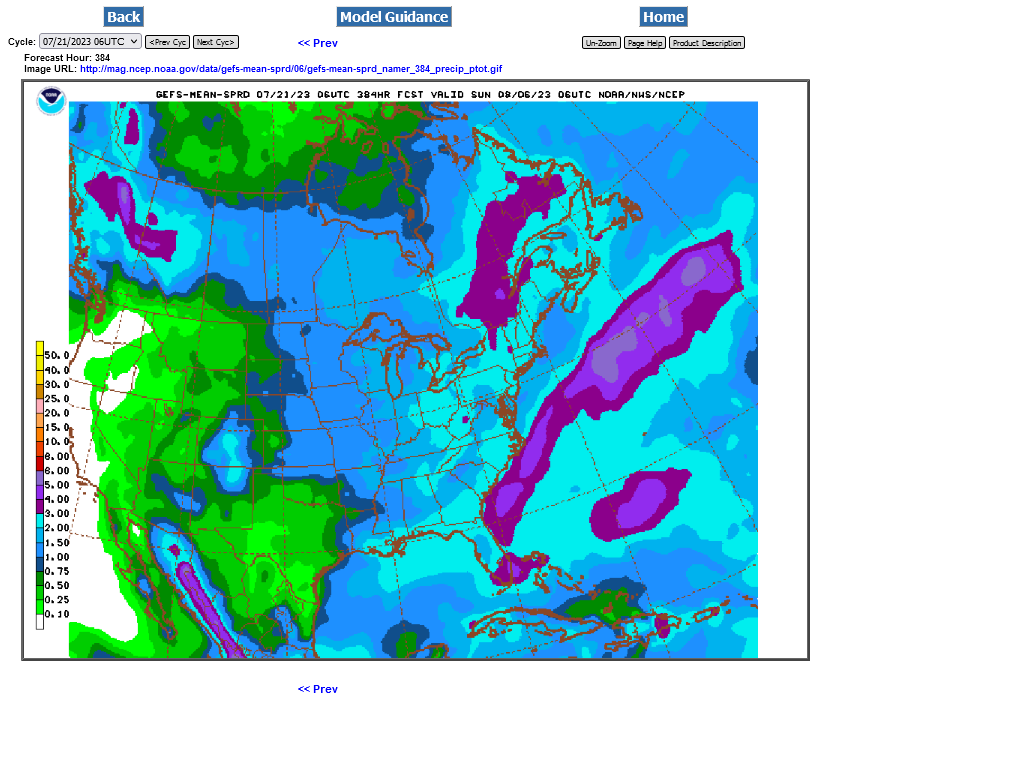
1. Total rains thru 384 hours
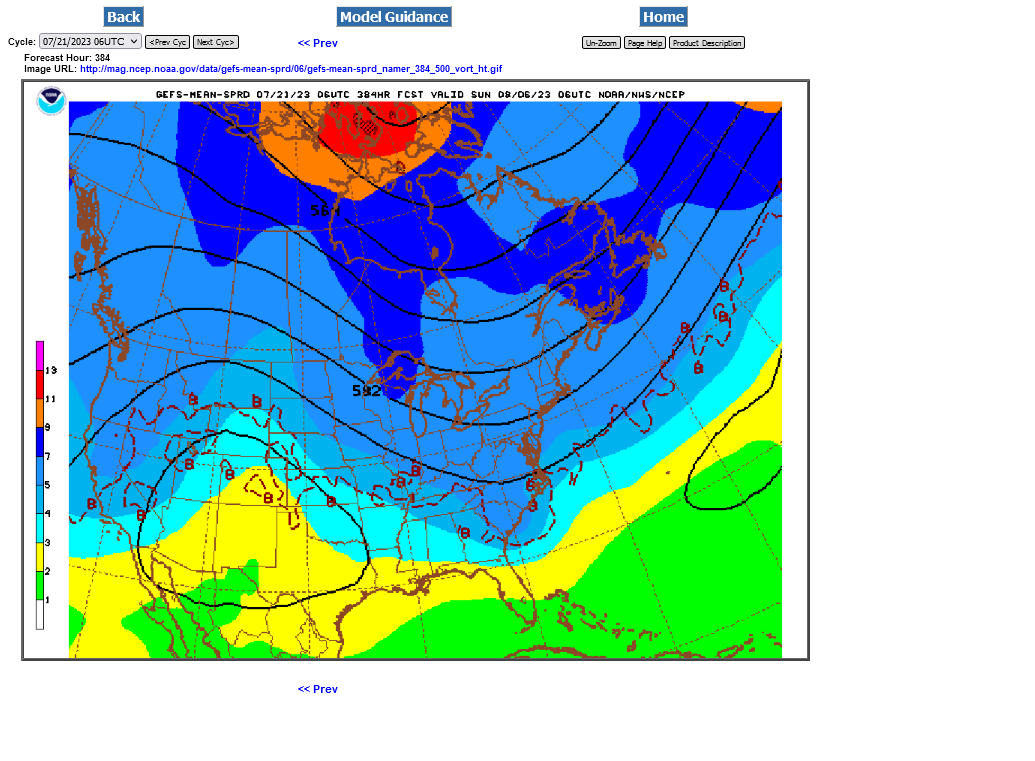
2. Upper levels in 384 hours. Pretty decent northwest flow. What matters is the location of the dome in the Southwest, that looks locked in place but more importantly, the center of the trough from the E.Great Lakes to the Mid Atlantic.
If the trough shifts west, the weather gets flat out bearish across the entire Midwest.
If the trough shifts east, the weather turns increasingly bullish from west to east.
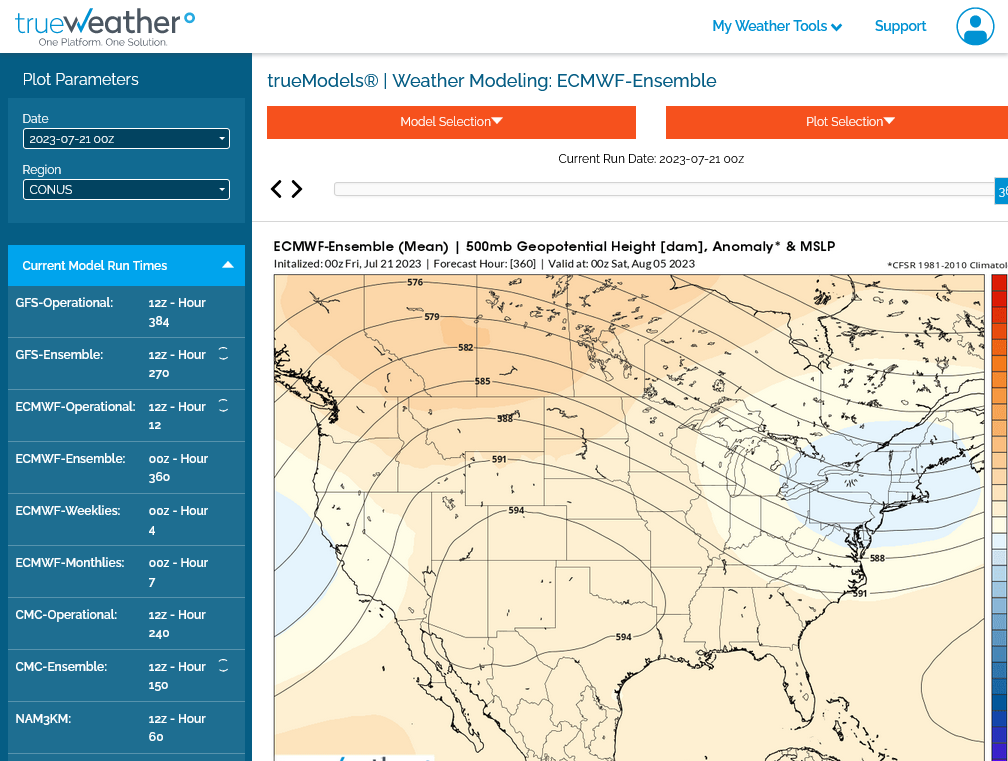
However, the European Ensemble model is clearly BULLISH.
3. Look how much more bullish the upper levels are for the European model.
4. Much less rain
The Canadian model is out an hour before the rest. This is the just out 12z run.
A slight majority are bearish, with a few VERY bearish. However, a significant minority are BULLISH.
There was an uptick in rain amounts on this run. If I had to have a position over the weekend, I would lean short and the market is embracing that mentality today.
Please don't take that as a suggestion. in 2 days the weather might look more bullish again and I'm not smart enough to know what the models will say on Sunday but can have fun sharing what is known with certainty on Friday...which is weather model forecast data and interpretations.
384h GZ 500 forecast valid on Aug 06, 2023 12 UTC


