KEY EVENTS TO WATCH FOR:
Friday, June 30, 2023
8:30 AM ET. May Personal Income and Outlays
Personal Income, M/M% (previous +0.4%)
Consumer Spending, M/M% (previous +0.8%)
PCE Price Idx, M/M% (previous +0.4%)
PCE Price Idx, Y/Y% (previous +4.4%)
PCE Core Price Idx, M/M% (previous +0.4%)
PCE Core Price Idx, Y/Y% (previous +4.7%)
9:45 AM ET. June Chicago Business Barometer - ISM-Chicago Business Survey -
Chicago PMI
PMI-Adj (previous 40.4)
10:00 AM ET. 1st Quarter GDP by State
10:00 AM ET. 1st Quarter State Quarterly Personal Income
10:00 AM ET. June University of Michigan Survey of Consumers - final
End-Mo Sentiment Idx (previous 59.2)
End-Mo Expectations Idx (previous 55.4)
12-Month Inflation Forecast (previous 4.2%)
5-Year Inflation Forecast (previous 3.1%)
End-Mo Current Idx (previous 64.9)
3:00 PM ET. May Agricultural Prices
Farm Prices, M/M% (previous +1.9%)
The STOCK INDEXES? http://quotes.ino.com/ex?changes/?c=indexes
The STOCK INDEXES: The September NASDAQ 100 was higher overnight and set the stage for a higher opening when the day session begins trading. Stochastics and the RSI are turning neutral to bullish signaling that sideways to higher prices are possible near-term. If September renews this year's rally, the 87% retracement level of the 2021-2022-decline on the weekly continuation chart crossing at 15,957.86 is the next upside target. Closes below Monday's low crossing at 14,853.50 would signal that a short-term top has been posted while opening the door for additional weakness near-term. First resistance is the June 16th high crossing at 15,475.50. Second resistance is the 87% retracement level of the 2021-2022-decline on the weekly continuation chart crossing at 15,957.86. First support is Monday's low crossing at 14,853.50. Second support is the June 1st low crossing at 14,420.00.
The September S&P 500 was higher overnight as it extends the rally off Monday's low. Overnight trading sets the stage for a higher opening when the day session begins trading. Stochastics and the RSI are neutral to bullish signaling that sideways to higher prices are possible near-term. If June renews the rally off March's low, the 75% retracement level of the 2022 decline crossing at 4505.40 is the next upside target. Closes below Monday's low crossing at 4368.50 would signal that a short-term top has been posted. First resistance is June's high crossing at 4493.75. Second resistance is the 75% retracement level of the 2022 decline crossing at 4505.40. First support is Monday's low crossing at 4368.50. Second support is the June 8th low crossing at 4305.75.
INTEREST RATES http://quotes.ino.com/ex changes/?c=interest"
INTEREST RATES: September T-bonds was lower overnight as it extends Thursday's sharp decline. Overnight trading sets the stage for a lower opening when the day session begins trading. Stochastics and the RSI are bearish signaling that sideways to lower prices are possible near-term. If September renews the decline off April's high, the 87% retracement level of the March-April rally crossing at 124-19 is the next downside target. Closes above 50-day moving average crossing at 128-24 would open the door for additional gains near-term. First resistance is the 50-day moving average crossing at 128-24. Second resistance is the June 1st high crossing at 129-16. First support is the 75% retracement level of the March-April rally crossing at 125-30. Second support is the 87% retracement level of the March-April rally crossing at 124-19.
September T-notes were lower overnight as it extends Thursday's sharp decline. Overnight trading sets the stage for a lower opening when the day session begins trading. Stochastics and the RSI have turned neutral to bearish signaling that sideways to lower prices are possible near-term. If September renews the decline off May's high, March's low crossing at 110.275 is the next downside target. Closes above the June 20th high crossing at 113.170 would signal that a short-term low has been posted. First resistance is the June 20th high crossing at 113.170. Second resistance is the 50-day moving average crossing at 114.173. First support is the 87% retracement level of the March-May rally crossing at 111.243. Second support is March's low crossing at 110.275.
ENERGY MARKETS? http://quotes.ino.com/ex?changes/?c=energy ""
ENERGIES:Augustcrude oil was steady to slightly lower overnight and sets the stage for a slightly lower opening when the day session begins trading. Stochastics and the RSI are neutral to bullish signaling that sideways to higher prices are possible near-term. Closes above the 50-day moving average crossing at $71.66 would signal that a short-term low has been posted. Closes below the June 12th low crossing at $66.96 would open the door for a possible test of May's low crossing at $64.41. First resistance is the 50-day moving average crossing at $71.66. Second resistance is the June 5th high crossing at $75.50. First support is the June 12th low crossing at $66.96. Second support is the May low crossing at $64.41.
August heating oil was lower overnight and set sets the stage for a lower opening when the day session begins trading. Stochastics and the RSI are neutral signaling that sideways trading is likely near-term. If August renews the decline off June's high, the June 12th low crossing at 2.2876 is the next downside target. If August renews the rally off May's low, April's high crossing at 2.6616 is the next upside target. First resistance is the June 16th high crossing at 2.5081. Second resistance is April's high crossing at 2.6616. First support is the June 12th low crossing at 2.2876. Second support is the May 31st low crossing at 2.2301.
August unleaded gas was steady to slightly lower overnight and sets the stage for a slightly lower opening when the day session begins trading. Stochastics and the RSI are neutral to bullish signaling that sideways to higher prices are possible near-term. If August renews the rally off May's low, the 87% retracement level of the April-May decline crossing at $2.6394 is the next upside target. If August resumes the decline off June's high, the June 1st low crossing at $2.3394 is the next downside target. First resistance is the 75% retracement level of the April-May decline crossing at $2.5766. Second resistance is the 87% retracement level of the April-May decline crossing at $2.6394. First support is the June 12th low crossing at $2.3901. Second support is the June 1st low crossing at $2.3394.
August natural gas was steady to slightly lower overnight. Overnight trading sets the stage for a slightly lower opening when the day session begins trading. Stochastics and the RSI are neutral to bearish signaling that sideways to lower prices are possible near-term. Closes below the 50-day moving average crossing at 2.558 would signal that a short-term low has been posted. If August renews the rally off June's low, the 25% retracement level of the 2022-2023 decline crossing at 3.193 is the next upside target. First resistance is Monday's high crossing at 2.936. Second resistance is the 25% retracement level of the 2022-2023 decline crossing at 3.193. First support is the 50-day moving average crossing at 2.558. Second support is the June 1st low crossing at 2.244.
CURRENCIEShttp://quotes.ino.com/ex changes/?c=currencies"
CURRENCIES:The September Dollar was slightly higher overnight as it extends the rally off last-Thursday's low. Overnight trading sets the stage for a slightly higher opening when the day session begins trading later this morning. Stochastics and the RSI are neutral to bullish signaling that sideways to higher prices are possible near-term. If September extends the rally off the June 22nd low crossing at $101.485 the May 31st high crossing at $104.250 is the next upside target. Closes below the 50-day moving average crossing at $102.317 would signal that a short-term low has been posted. First resistance is the May 31st high crossing at $104.250. Second resistance is the 38% retracement level of the 2022-2023 decline crossing at $104.932.First support is last-Thursday's low crossing at $101.485. Second support is May's low crossing at $100.340.
The September Euro was lower overnight and sets the stage for a lower opening when the day session begins trading. Stochastics and the RSI are neutral to bearish signaling that sideways to lower prices are possible near-term. Closes below the 20-day moving average crossing at 1.08978 would signal that a short-term top has been posted while opening the door for additional weakness near-term. If September resumes the rally off May's low, May's high crossing at $1.11710 is the next upside target. First resistance is the June 22nd high crossing at $1.10615. Second resistance is May's high crossing at $1.11710. First support is the 20-day moving average crossing at 1.08978. Second support is May's low crossing at 1.07025.
The September British Pound was slightly higher overnight. Overnight trading and sets the stage for a slightly higher opening when the day session begins trading. Stochastics and the RSI are neutral to bearish signaling that sideways to lower prices near-term. If September extends the decline off the June 22nd high, the 50-day moving average crossing at 1.2562 is the next downside target. If September renews the rally off May's low, the 75% retracement level of the 2022-2023 decline crossing at 1.3253 is the next upside target. First resistance is the June 22nd high crossing at 1.2874. Second resistance is the 75% retracement level of the 2022-2023 decline crossing at 1.3253. First support is the 50-day moving average crossing at 1.2562. Second support is June's low crossing at 1.2390.
The September Swiss Franc was lower overnight as it extends the trading range of the past three-weeks. Overnight trading sets the stage for a lower opening when the day session begins trading. Stochastics and the RSI are neutral to bearish signaling that sideways to lower prices are possible near-term. Closes below the June 23rd low crossing at 1.11915 would mark a potential downside breakout of the aforementioned trading range while opening the door for additional weakness near-term. If September renews the rally off May's low, May's high crossing at 1.14920 is the next upside target. First resistance is the June 16th high crossing at 1.13410. Second resistance is May's high crossing at 1.14920. First support is the June 23rd low crossing at 1.11915. Second support is June's low crossing at 1.10920. Third support is May's low crossing at 1.10700.
The September Canadian Dollar was slightly lower in late-overnight trading and sets the stage for a lower opening when the day session begins trading. Stochastics and the RSI are bearish signaling that sideways to lower prices are possible near-term. Closes below the 20-day moving average crossing at $75.44 would signal that a short-term top has been posted while opening the door for additional weakness near-term. If September renews the rally off the May 26th low, the September 12th, 2022 high crossing at $77.11 is the next upside target. First resistance is the 38% retracement level of the 2022-2023 decline crossing at $76.28. Second resistance is the September-12th, 2022 high crossing at $77.11. First support is the 20-day moving average crossing at $75.44. Second support is 50-day moving average crossing at $74.66.
The September Japanese Yen was slightly higher in overnight trading. Overnight trading sets the stage for a steady to slightly higher opening when the day session begins trading. Stochastics and the RSI are oversold but remain neutral to bearish signaling that sideways to lower prices are possible near-term. If September extends the decline off the March's high, the October 21st -2022 low crossing at 0.069270 is the next downside target. Closes above the 20-day moving average crossing at 0.071688 would signal that a short-term low has been posted. First resistance is the 10-day moving average crossing at 0.070701. Second resistance is the 20-day moving average crossing at 0.071688. First support is the overnight low crossing at 0.069940. Second support is the October 21st, -2022 low crossing at 0.069270.
PRECIOUS METALS http://quotes.ino.com/ex changes/?c=metals"
Precious Metals: Augustgold was lower overnight as it extends the decline off May's high. Overnight trading sets the stage for a lower opening when the day session begins trading later this morning. Stochastics and the RSI are oversold but remain neutral to bearish signaling that sideways to lower prices are possible near-term. If August extends the decline off May's high, the 50% retracement level of the September-May rally crossing at $1892.30 is the next downside target. Closes above the 20-day moving average crossing at $1951.80 would signal that a short-term low has been posted. First resistance is the 20-day moving average crossing at $1951.80. Second resistance is the 50-day moving average crossing at $1990.90. First support is the 50% retracement level of the September-May rally crossing at $1892.30. Second support is the 62% retracement level of the September-May rally crossing at $1842.60.
September silver was lower overnight and sets the stage for a slightly lower opening when the day session begins trading later this morning. Stochastics and the RSI are turning neutral to bearish signaling that sideways to lower prices are possible near-term. If July resumes this month's decline, the 75% retracement level of the March-April rally crossing at $21.982 is the next downside target. Closes above the 20-day moving average crossing at $23.608 would signal that a short-term low has been posted. First resistance is the 20-day moving average crossing at $23.608. Second resistance is the 50-day moving average crossing at $24.357. First support is the 75% retracement level of the March-April rally crossing at 21.982. Second support is the 87% retracement level of the March-April rally crossing at 21.233.
September copper was slightly higher overnight as it consolidates some of the decline off the June 22nd high. Overnight trading and sets the stage for a slightly higher opening when the day session begins trading. Stochastics and the RSI are oversold but remain bearish signaling that sideways to lower prices are possible near-term. If September extends the decline off last-Thursday's high, the May 31st low crossing at 3.6380 is the next downside target. Closes above the 10-day moving average crossing at 3.8359 would signal that a short-term low has been posted. First resistance is the June 22nd high crossing at 3.9640. Second resistance is May's high crossing at 4.0100. First support is the May 31st low crossing at 3.6380. Second support is May's low crossing at 3.5650.
GRAINS http://quotes.ino.com/ex changes/?c=grains
Grains: December corn was higher overnight as it consolidates some of the decline off the June 21st high. Overnight trading sets the stage for a higher opening when the day sessions begins trading. Stochastics and the RSI are oversold but remain bearish signaling that sideways to lower prices are possible near-term. If December extends the decline off the June 21st high, the June 8th low crossing at $5.20 1/4 is the next downside target. Closes above the 10-day moving average crossing at $5.77 3/4 would signal that a short-term low has been posted. First resistance is the 20-day moving average crossing at $5.60 3/4. Second resistance is the 10-day moving average crossing at $5.77 3/4. First support is the June 8th low crossing at $5.20 1/4. Second support is the May 31st low crossing at $5.11 1/4.
September wheat was higher overnight as it consolidates some of the decline off Monday's high. Overnight trading sets the stage for a higher opening when the day session begins trading. Stochastics and the RSI remain neutral to bearish signaling that sideways to lower prices are possible near-term. If September extends this week's decline, the 50-day moving average crossing at $6.56 1/2 is the next downside target. Closes below the 50-day moving average crossing at $6.56 1/2 would confirm that a short-term top has been posted. If September renews the rally off May's low, the 38% retracement level of the 2022-2023 decline crossing at $7.95 1/4 is the next upside target. First resistance is Monday's high crossing at $7.70 1/4. Second resistance is the 38% retracement level of the 2022-2023 decline crossing at $7.95 1/4. First support is the 50-day moving average crossing at $6.56 1/2. Second support is the June 8th low crossing at $6.23 1/4.
September Kansas City wheat was higher overnight as it consolidates some of the decline off the June 22nd high. Overnight trading sets the stage for a higher opening when the day session begins trading later this morning. Stochastics and the RSI remain neutral to bearish signaling that sideways to lower prices are possible near-term. If September extends this week's decline, the June 14th low crossing at $7.76 3/4 is the next downside target. Closes above the 10-day moving average crossing at $8.40 would temper the near-term bearish outlook. First resistance is the June 22nd high crossing at $8.89 1/2. Second resistance is May's high crossing at $9.02. First support is the June 14th low crossing at $7.76 3/4. Second support is the May 31st low crossing at $7.61 3/4.
September Minneapolis wheat was higher overnight as it consolidates some of the decline off the June 22nd high. Overnight trading sets the stage for a higher opening when the day session begins trading. Stochastics and the RSI remain neutral to bearish signaling that sideways to lower prices are possible near-term. If September extends the decline off the June 22nd high, the June 14th low crossing at $8.01 1/4 is the next downside target. Closes above the 10-day moving average crossing at $8.54 1/4 would temper the near-term bearish outlook. First resistance is the 10-day moving average crossing at $8.54 1/4. Second resistance is the June 22nd high crossing at $8.94 1/2. First support is the June 14th low crossing at $8.01 1/4. Second support is the June 8th low crossing at $7.92 3/4.
SOYBEAN COMPLEX? http://quotes.ino.com/ex?changes/?c=grains "
November soybeans were higher overnight as it consolidates some of the decline off the June 21st high. Overnight trading sets the stage for a higher opening when the day session begins trading later this morning. Stochastics and the RSI are neutral to bearish signaling that sideways to lower prices are possible near-term. If November extends the decline off the June 21st high, the 50-day moving average crossing at $12.43 is the next downside target. Closes above the 10-day moving average crossing at $13.13 3/4 would temper the near-term bearish outlook. First resistance is the 10-day moving average crossing at $13.13 3/4. Second resistance is the 75% retracement level of the 2022-2023 decline crossing at $13.69 1/4. First support is the 20-day moving average crossing at $12.62. Second support is the 50-day moving average crossing at $12.43.
December soybean meal was higher overnight as it consolidated some of the decline off the June 21st high. Overnight trading sets the stage for a higher opening when the day session begins trading. Stochastics and the RSI are neutral to bearish signaling that sideways to lower prices are possible near-term. If December extends this week's decline, May's low crossing at $361.80 is the next downside target. Closes above the 10-day moving average crossing at $397.80 would signal that a short-term low has been posted. First resistance is the 10-day moving average crossing at $397.80. Second resistance is the June 21st high crossing at $432.60. First support is the June 14th low crossing at $372.80. Second support is May's low crossing at $361.80.
December soybean oil was higher overnight and sets the stage for a higher opening when the day session begins trading. Stochastics and the RSI are neutral to bearish signaling that sideways to lower prices are possible near-term. Closes below the 20-day moving average crossing at 53.55 would signal that a short-term top has been posted. If December renews the rally off May's low, the February 22nd high crossing at 60.52 is the next upside target. First resistance is the June 16th high crossing at 58.45. Second resistance is February 22nd high crossing at 60.52. First support is the 20-day moving average crossing at 53.55. Second support is the 50-day moving average crossing at 51.07.
Thanks tallpine!
USDA at 11 am, so a few fireworks with that report.
Re: Re: Crop conditions+more 6-26-23
By metmike - June 30, 2023, 7:08 a.m.
We got 3 huge rains on Thursday That totaled 3.6 inches. The forecast is still the same With a lot more on the way. I’ll have the forecast maps later today.
the usda report is coming up and that could be part of why grains bounced from the get go overnight but it might be from too much rain in the southern Cornbelt coming up For some,places.
i think quite a few spots in the southern cornbelt might get 8 inches in a pattern like this if it continues.
Corn will do great with that. "Beans don't like wet feet"
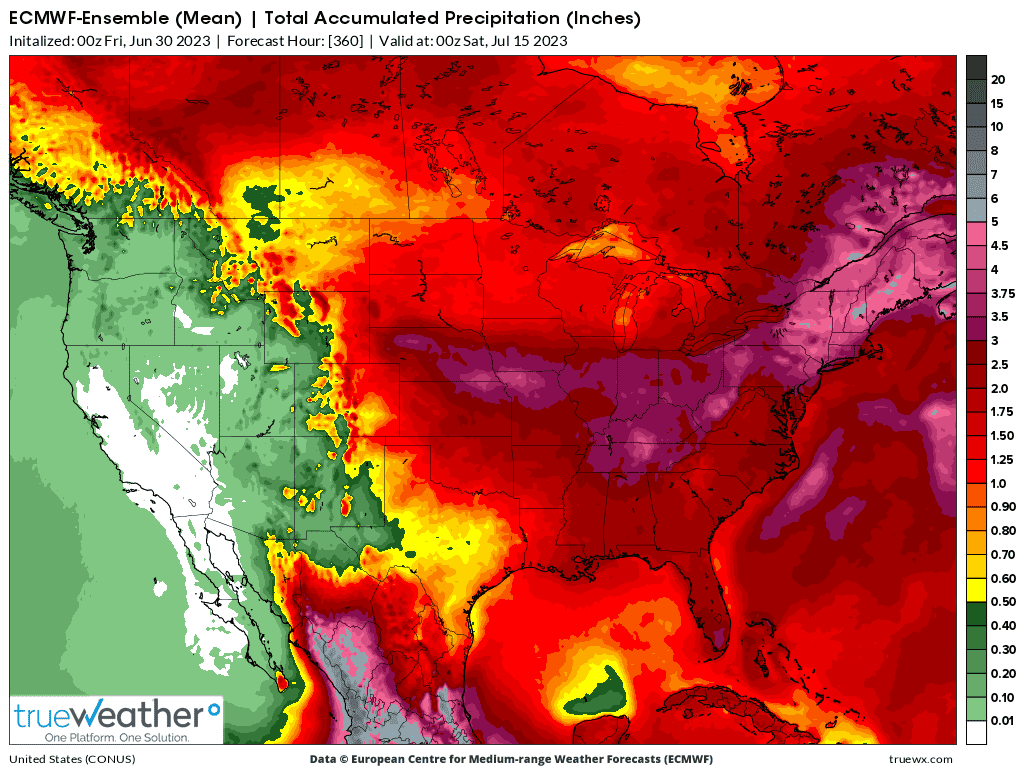
This was the 0z EE solution. Very heavy rains southern 60% of the cornbelt, close to 5 inches but a sharp cutoff with much rain in the Upper Midwest.
The GEFS has MORE rain this this.