KEY EVENTS TO WATCH FOR:
Wednesday, June 28, 2023
7:00 AM ET. MBA Weekly Mortgage Applications Survey
Composite Idx (previous 209.8)
Composite Idx, W/W% (previous +0.5%)
Purchase Idx-SA (previous 165.6)
Purchase Idx-SA, W/W% (previous +1.5%)
Refinance Idx (previous 425.1)
Refinance Idx, W/W% (previous -2.1%)
8:30 AM ET. Annual U.S. International Investment Position
8:30 AM ET. May Advance Economic Indicators Report
10:00 AM ET. May Metropolitan Area Employment and Unemployment
10:30 AM ET. EIA Weekly Petroleum Status Report
Crude Oil Stocks (Bbl) (previous 463.293M)
Crude Oil Stocks, Net Chg (Bbl) (previous -3.831M)
Gasoline Stocks (Bbl) (previous 221.402M)
Gasoline Stocks, Net Chg (Bbl) (previous +0.479M)
Distillate Stocks (Bbl) (previous 114.288M)
Distillate Stocks, Net Chg (Bbl) (previous +0.434M)
Refinery Usage (previous 93.1%)
Total Prod Supplied (Bbl/day) (previous 20.925M)
Total Prod Supplied, Net Chg (Bbl/day) (previous +0.517M)
Thursday, June 29, 2023
8:30 AM ET. 1st Quarter Revised Corporate Profits
8:30 AM ET. 1st Quarter 3rd estimate GDP
Annual Rate, Q/Q% (previous +1.3%)
Chain-Weighted Price Idx, Q/Q% (previous +4.2%)
Corporate Profits, Q/Q%
PCE Price Idx, Q/Q% (previous +4.2%)
Purchase Price Idx, Q/Q%
Real Final Sales, Q/Q%
Core PCE Price Idx, Ex
Food/Energy, Q/Q%
Personal Consumption, Q/Q% (previous +3.8%)
8:30 AM ET. Unemployment Insurance Weekly Claims Report - Initial Claims
Jobless Claims (previous 264K)
Jobless Claims, Net Chg (previous +0K)
Continuing Claims (previous 1759000)
Continuing Claims, Net Chg (previous -13K)
8:30 AM ET. U.S. Weekly Export Sales
10:00 AM ET. May Pending Home Sales Index
Pending Home Sales (previous 78.9)
Pending Home Sales Idx, M/M% (previous +0%)
Pending Home Sales Idx , Y/Y% (previous -20.3%)
10:30 AM ET. EIA Weekly Natural Gas Storage Report
Working Gas In Storage (Cbf) (previous 2729B)
Working Gas In Storage, Net Chg (Cbf) (previous +95B)
4:30 PM ET. Foreign Central Bank Holdings
4:30 PM ET. Federal Discount Window Borrowings
Friday, June 30, 2023
8:30 AM ET. May Personal Income and Outlays
Personal Income, M/M% (previous +0.4%)
Consumer Spending, M/M% (previous +0.8%)
PCE Price Idx, M/M% (previous +0.4%)
PCE Price Idx, Y/Y% (previous +4.4%)
PCE Core Price Idx, M/M% (previous +0.4%)
PCE Core Price Idx, Y/Y% (previous +4.7%)
9:45 AM ET. June Chicago Business Barometer - ISM-Chicago Business Survey -
Chicago PMI
PMI-Adj (previous 40.4)
10:00 AM ET. 1st Quarter GDP by State
10:00 AM ET. 1st Quarter State Quarterly Personal Income
10:00 AM ET. June University of Michigan Survey of Consumers - final
End-Mo Sentiment Idx (previous 59.2)
End-Mo Expectations Idx (previous 55.4)
12-Month Inflation Forecast (previous 4.2%)
5-Year Inflation Forecast (previous 3.1%)
End-Mo Current Idx (previous 64.9)
3:00 PM ET. May Agricultural Prices
Farm Prices, M/M% (previous +1.9%)
The STOCK INDEXES? http://quotes.ino.com/ex?changes/?c=indexes
The Dow closed higher on Tuesday as investors scour through fresh economic knows, which shows the economy remains resilient. The high-range close sets the stage for a steady to higher opening when Wednesday's day session begins trading. Stochastics and the RSI remain neutral to bearish signaling that sideways to lower prices are possible near-term. Closes below the 50-day moving average crossing at 33,614.25 would confirm that a short-term top has been posted. If the Dow renews the rally off May's low, the December-2022 high crossing at 34,712.28 is the next upside target. First resistance is June's high crossing at 34,588.68. Second resistance is the December-2022 high crossing at 34,712.28. First support is the 50-day moving average crossing at 33,614.25. Second support is the June 6th low crossing at 33,399.69.
The September NASDAQ 100 closed higher on Tuesday as it consolidates some of the decline off June's high. The high-range close sets the stage for a steady to higher opening when Wednesday's night session begins trading. Stochastics and the RSI are neutral to bearish signaling sideways to lower prices are possible. Closes below the 20-day moving average crossing at 14,917.66 would signal that a short-term top has been posted. If September resumes this year's rally, the 87% retracement level of the 2021-2022-decline on the weekly continuation chart crossing at 15,957.86 is the next upside target. First resistance is last-Friday's high crossing at 15,475.50. Second resistance is the 87% retracement level of the 2020-2022-decline on the weekly continuation chart crossing at 15,957.86. First support is the 20-day moving average crossing at 14,917.66. Second support is June's low crossing at 14,420.00.
The September S&P 500 closed higher on Tuesday as it consolidates some of the decline off June's high. The high-range close sets the stage for a steady to higher opening when Wednesday's night session begins trading. Stochastics and the RSI are neutral to bearish signaling that sideways to lower prices are possible near-term. Closes below the 20-day moving average crossing at 4367.55 would signal that a short-term top has been posted. If September renews the rally off March's low, the 75% retracement level of the 2022 decline on the weekly chart crossing at 4505.40 is the next upside target. First resistance is June's high crossing at 4493.75. Second resistance is the 75% retracement level of the 2022 decline on the weekly chart crossing at 4505.40. First support is the 20-day moving average crossing at 4367.55. Second support is the June 8th low crossing at 4305.75.
INTEREST RATES? http://quotes.ino.com/ex?changes/?c=interest ""
September T-bonds closed down 20/32's at 127-15.
September T-bonds closed lower on Tuesday as it extends June's trading range. The low-range close sets the stage for a steady to lower opening when Wednesday's day session begins trading. Stochastics and the RSI are neutral to bullish signaling that sideways to higher prices are possible near-term. Closes above the 50-day moving average crossing at 128-30 would confirm that a short-term low has been posted while opening the door for additional gains near-term. If September renews the decline off April's high, the 87% retracement level of the March-April rally crossing at 124-19 is the next downside target. First resistance is the 50-day moving average crossing at 128-30. Second resistance is the May 11th high crossing at 132-13. First support is the 75% retracement level of the March-April rally crossing at 125-30. Second support is the 87% retracement level of the March- April rally crossing at 124-19.
September T-notes closed up 130-pts. at 112.265.
September T-notes closed lower on Tuesday. The low-range close sets the stage for a steady to lower opening when Wednesday's day session begins trading. Stochastics and the RSI are neutral to bullish signaling that sideways to higher prices are possible near-term. Closes above the June 13th high crossing at 114.000 would signal that a short-term low has been posted. If September renews the decline off May's high, the 87% retracement level of March's rally crossing at 111.243 is the next downside target. First resistance is the June 13th high crossing at 114.000. Second resistance is June's high crossing at 115.000. First support is the 75% retracement level of March's rally crossing at 112.190. Second support is the 87% retracement level of March's rally crossing at 111.243.
ENERGY MARKETS? http://quotes.ino.com/ex?changes/?c=energy ""
August crude oil closed lower on Tuesday as it extends this week's decline. The low-range close sets the stage for a steady to lower opening when Wednesday's day session begins. Stochastics and the RSI are neutral to bearish signaling that sideways to lower prices are possible near-term. Closes below the June 12th low crossing at $66.96 would open the door for a possible test of May's low crossing at $63.90. Closes above the 50-day moving average crossing at $72.24 would signal that a short-term low has been posted while opening the door for additional short-term gains. First resistance is the 50-day moving average crossing at $72.24. Second resistance is June's high crossing at $75.70. First support is the June 12thlow crossing at $66.96. Second support is May's low crossing at $64.41.
August heating oil posted an outside day down as it closed lower on Tuesday. The low-range close sets the stage for a steady to lower opening when Wednesday's day trading session begins. Stochastics and the RSI are neutral to bearish signaling that sideways to lower prices are possible near-term. Closes below the June 12th low crossing at 2.2878 would confirm that a short-term top has been posted. If August renews the rally off May's low, the 38% retracement level of the 2022-2023 decline crossing at 2.6107 is the next upside target. First resistance is the April 24th high crossing at 2.5349. Second resistance is the 38% retracement level of the 2022-2023 decline crossing at 2.6107. First support is the June 12th low crossing at $2.2876. Second support is the May 31st low crossing at $2.2301.
August unleaded gas posted an outside day down as it closed lower on Tuesday. The low-range close sets the stage for a steady to lower opening when Wednesday's day session begins trading. Stochastics and the RSI are neutral to bearish signaling that sideways to lower prices are possible near-term. Closes below the June 12th low crossing at 2.3901 would open the door for a possible test of June's low crossing at 2.3394. Closes above the 10-day moving average crossing at 2.4880 would signal that a short-term low has been posted. First resistance June's high crossing at 2.5905. Second resistance is the 87% retracement level of the April-May decline crossing at 2.6394. First support is the June 12th low crossing at 2.3901. Second support is June's low crossing at 2.3394.
August Henry natural gas closed lower on Tuesday as it consolidated some of the rally off June's low. The low-range close sets the stage for a steady to lower opening when Wednesday's day session begins trading. Stochastics and the RSI are overbought but remain neutral to bullish signaling that sideways to higher prices are possible near-term. If August extends this month's rally, the 25% retracement level of the 2022-2023 decline crossing at 3.193 is the next upside target. Closes below the 20-day moving average crossing at 2.514 is the next downside target.First resistance is Monday's high crossing at 2.828. Second resistance is the 25% retracement level of the 2022-2023 decline crossing at 3.193. First support is the 20-day moving average crossing at 2.514. Second support is the June 1st low crossing at 2.244.
CURRENCIES? http://quotes.ino.com/ex?changes/?c=currencies ""
The September Dollar closed lower on Tuesday. The low-range close sets the stage for a steady to lower opening when Wednesday's session begins trading. Stochastics and the RSI are neutral to bullish signaling that sideways to higher prices are possible near-term. Closes above the 20-day moving average crossing at 102.715 would signal that a short-term low has been posted. If September renews the decline off May's high, May's low crossing at 100.340 is the next downside target. First resistance is the 20-day moving average crossing at 102.715. Second resistance is May's high crossing at 104.205. First support is last-Thursday's low crossing at 101.485. Second support is May's low crossing at 100.340.
The September Euro closed higher on Tuesday. The high-range close sets the stage for a steady to higher opening when Wednesday's day session begins trading. Stochastics and the RSI are turning neutral to bullish signaling that sideways to higher prices is possible near-term. If September extends the rally off May's low, May's high crossing at 1.11710. Closes below the 20-day moving average crossing at $1.08769 would signal that a short-term top has been posted. First resistance is last-Thursday's high crossing at $1.10615. Second resistance is May's high crossing at 1.11710. First support is the 20-day moving average crossing at 1.08769. Second support is May's low crossing at $1.07025.
The September British Pound was slightly higher close on Tuesday. The high-range close sets the stage for a steady to higher opening when Wednesday's day session begins trading. Stochastics and the RSI are turning neutral signaling sideways trading is possible near-term. If September renews the rally off May's low, the 75% retracement level of the 2022-2023 decline crossing at 1.3253 is the next upside target. Closes below the 50-day moving average crossing at 1.2550 is the next downside target. First resistance is last-Thursday's highcrossing at 1.2874. Second resistance is the 75% retracement level of the 2022-2023 decline crossing at 1.3253. First support is the 20-day moving average crossing at 1.2620. Second support is the 50-day moving average crossing at 1.2550.
The September Swiss Franc closed slightly higher on Tuesday. The high-range close sets the stage for a steady to slightly higher opening when Wednesday's day session begins trading. Stochastics and the RSI are turning neutral to bullish signaling that sideways to higher prices are possible near-term. If September renews the rally off May's low, May's high crossing at 1.14920 is the next upside target. Closes below the 20-day moving average crossing at 1.12082 would signal that a short-term top has been posted. First resistance is the June 16th high crossing at 1.13410. Second resistance is May's high crossing at 1.14920. First support is the 20-day moving average crossing at 1.12082. Second support is May's low crossing at 1.10700. Third support is the 38% retracement level of 2022-2023 rally crossing at 1.010197.
The September Canadian Dollar posted an outside day down as it closed lower on Tuesday as it consolidated some of the rally off May's low. The low-range close sets the stage for a steady to lower opening when Wednesday's day session begins trading. Stochastics and the RSI are overbought but remain neutral to bullish signaling that sideways to higher prices are possible near-term. If September extends the rally off May's low, the September 12th high crossing at 77.11 is the next upside target. Closes below the 20-day moving average crossing at 75.21 would signal that a short-term top has been posted. First resistance is the 38% retracement level of the 2021-2022 decline crossing at 76.28. Second resistance is the September 12th high crossing at 77.11. First support is the 10-day moving average crossing at 75.83. Second support is the 20-day moving average crossing at 75.20.
The September Japanese Yen closed lower on Tuesday as it extends this year's decline. The low-range close sets the stage for a steady to lower opening when Wednesday’s day session begins trading. Stochastics and the RSI are oversold but remain neutral to bearish signaling that sideways to lower prices are possible near-term. If September extends the decline off March's high, the October-2022 low crossing at 0.069270 is the next downside target. Closes above the 20-day moving average crossing at 0.072141 would signal that a short-term low has been posted. First resistance is the 20-day moving average crossing at 0.072141. Second resistance is the June 1st high crossing at 0.073430. First support is today's low crossing at 0.070255. Second support is the October-2022 low crossing at 0.069270.
PRECIOUS METALS? http://quotes.ino.com/ex?changes/?c=metals ""
August gold closed lower on Tuesday. The low-range close sets the stage for a steady to lower opening when Wednesday's day session begins trading. Stochastics and the RSI are oversold but remain neutral to bearish signaling that sideways to lower prices are possible near-term. If August extends the decline off May's high, the 50% retracement level of the 2022-2023 rally crossing at $1892.30. Closes above the 20-day moving average crossing at $1961.90 would signal that a short-term low has been posted. First resistance is the 20-day moving average crossing at $1961.90. Second resistance is the 50-day moving average crossing at $1997.60. First support is last-Friday's low crossing at $1919.50. Second support is the 50% retracement level of the 2022-2023 rally crossing at $1892.30.
July silver closed higher on Tuesday as it consolidated some of the decline off May's high. The mid-range close sets the stage for a steady to higher opening when Wednesday's day session begins trading. Stochastics and the RSI are oversold but are turning neutral to bullish signaling that sideways to lower prices are possible near-term. Closes above the 20-day moving average crossing at 23.542 would signal that a low has been posted. If July renews the decline off May's high, the 75% retracement level of the March-May rally crossing at 21.708 is the next downside target. First resistance is the 20-day moving average crossing at 23.542. Second resistance is the 50-day moving average crossing at 24,313. First support is last-Friday's low crossing at 22.140. Second support is the 75% retracement level of the March-May rally crossing at 21.708.
September copper closed lower on Tuesday. The low-range close sets the stage for a steady to lower opening when Wednesday's day session begins trading. Stochastics and the RSI are bearish signaling that sideways to lower prices are possible near-term. Today's close below the 20-day moving average crossing at 3.8068 would signal that a short-term top has been posted. If July renews the rally off May's low, May's high crossing at 4.0100 is the next upside target. First resistance is last-Thursday's high crossing at 3.9640. Second resistance is May's high crossing at 4.0100. First support is the 20-day moving average crossing at 3.8068. Second support is May's low crossing at 3.5650.
GRAINS? http://quotes.ino.com/ex?changes/?c=grains "
December Corn closed down $0.27 1/4-cents at $5.61.
December corn closed sharply lower on Tuesday as it extended the decline off last-Wednesday's high. The low-range close sets the stage for a steady to lower opening when Wednesday's night session begins trading. Stochastics and the RSI are bearish signaling that sideways to lower prices are possible near-term. Closes below the 20-day moving average crossing at $5.54 3/4 would open the door for additional weakness near-term. If December renews the rally off May's low, the 75% retracement level of the 2022-2023-decline crossing at $6.47 1/2 is the next upside target. First resistance is the December 26th high crossing at $6.31 1/4. Second resistance is the 75% retracement level of the 2022-2023 decline crossing at $6.47 1/2. First support is the 20-day moving average crossing at $5.54 3/4. Second support is the 50-day moving average crossing at $5.39 1/4.
September wheat closed down $0.38 1/4-cents at $6.99.
September wheat closed sharply lower on Tuesday. The low-range close sets the stage for a steady to lower opening when Wednesday's day session begins trading. Stochastics and the RSI are overbought and are turning neutral to bearish signaling that sideways to lower prices are possible near-term. If September extends today's decline, the 20-day moving average crossing at $6.67 3/4 is the next downside target. If September renews the rally off May's low, the 38% retracement level of the 2022-2023 crossing at $7.95 1/4 is the next upside target. First resistance is Monday's high crossing at $7.70 1/4. Second resistance is the 38% retracement level of the 2022-2023 crossing at $7.95 1/4. First support is today's low crossing at $6.95 1/2. Second support is the 20-day moving average crossing at $6.67 3/4.
September Kansas City Wheat closed up $0.28 3/4-cents at $8.39 1/2.
September Kansas City wheat closed sharply lower on Tuesday. The low-range close sets the stage for a steady to lower opening when Wednesday's day session begins trading. Stochastics and the RSI are turning neutral to bearish signaling that sideways to lower prices are possible near-term. Closes below the 20-day moving average crossing at $8.17 would signal that a short-term top has been posted. If September renews the rally off the May 31st low, May's high crossing at $9.02 is the next upside target. First resistance is last-Thursday's high crossing at $8.89 1/2. Second resistance is May's high crossing at $9.02. First support is the 50-day moving average crossing at $8.19 1/4. Second support is the 20-day moving average crossing at $8.17.
September Minneapolis wheat closed down $0.27 1/4-cents crossing at $8.45 1/4.
September Minneapolis wheat closed sharply lower on Tuesday. The low-range close sets the stage for a steady to lower opening when Wednesday's day session begins trading. Stochastics and the RSI are overbought and are turning neutral to bearish signaling that sideways to lower prices are possible near-term. Closes below the 20-day moving average crossing at $8.28 1/2 would signal that a short-term top has been posted. If September renews the rally off the May 31st low, April's high crossing at $9.10 1/2 is the next upside target. First resistance is last-Thursday's high crossing at $8.94 1/2. Second resistance is April's high crossing at $9.10 1/2. First support is the 50-day moving average crossing at $8.31 1/2. Second support is the 20-day moving average crossing at $8.28 1/2.
SOYBEAN COMPLEX? http://quotes.ino.com/ex?changes/?c=grains "
November soybeans closed down $0.38 3/4-cents at $12.94 1/4.
November soybeans closed lower on Tuesday as it extends the decline off last-Wednesday's high. The low-range close sets the stage for a steady to lower opening when Wednesday's day session begins trading. Stochastics and the RSI are neutral to bearish signaling that sideways to lower prices are possible near-term. If November extends the decline off last-Wednesday high, the 20-day moving average crossing at $12.44 3/4 is the next downside target. If November renews the rally off May's low, February's high crossing at $14.02 is the next upside target. First resistance is last-Wednesday's high crossing at $13.78. Second resistance is February's high crossing at $14.02. First support is the 20-day moving average crossing at $12.44 3/4. Second support is the June 8th low crossing at $11.67.
December soybean meal closed down $13.50 at $385.40.
December soybean meal closed lower on Tuesday as it extends the decline off last-Wednesday's high. The low-range close sets the stage for a steady to lower opening when Wednesday's day session begins trading. Stochastics and the RSI are neutral to bearish signaling that sideways to lower prices are possible near-term. If December extends the decline off last-Wednesday's high, the 20-day moving average crossing at $382.40 is the next downside target. If December renews this month's rally, April's high crossing at $456.00 is the next upside target. First resistance is last-Wednesday's high crossing at $438.90. Second resistance is April's high crossing at $456.00. First support is the 20-day moving average crossing at $382.40. Second support is the June 8th low crossing at $362.40.
December soybean oil closed up 94-pts. at 57.12.
December soybean oil closed higher for the fourth-day in a row on Tuesday.The high-range close sets the stage for a steady to higher opening when Wednesday's day session begins trading. Stochastics and the RSI are turning neutral to bullish signaling that sideways to higher prices are possible near-term. If December resumes the rally off May's low, March's high crossing at 59.49 is the next upside target. Closes below the 20-day moving average crossing at 52.22 would signal that a short-term top has been posted. First resistance is the June 16th high crossing at 58.45. Second resistance is March's high crossing at 59.49. First support is the 20-day moving average crossing at 52.22. Second support is May's low crossing at 44.47.
LIVESTOCKhttp://quotes.ino.com/exchanges/?c=livestock
August hogs closed up $1.00 at $91.05.
August hogs closed higher on Tuesday. The high-range close sets the stage for a steady to higher opening when Wednesday's day session begins trading. Stochastics and the RSI are neutral to bearish signaling that sideways to lower prices are possible near-term. Closes below the 20-day moving average crossing at $86.54 would signal that a short-term top has been posted. If August renews the rally off May's low, the 62% retracement level of the 2022-2023 decline crossing at $95.45 is the next upside target. First resistance is the 62% retracement level of the 2022-2023 decline crossing at $95.45. Second resistance is the 75% retracement level of the 2022-2023 decline crossing at $100.14. First support is the 50-day moving average crossing at $86.96. Second support is the 20-day moving average crossing at $85.54.
August cattle closed up $2.00 at $172.60.
August cattle closed higher on Tuesday. The high-range close sets the stage for a steady to higher opening on Wednesday. Stochastics and the RSI are turning neutral to bullish signaling that sideways to higher prices are possible near-term. Closes above the June 14th high crossing at $174.40 would confirm that a low has been posted. If August extends the decline off June's high, the 50-day moving average crossing at $166.23 is the next downside target. First resistance is the June 14th high crossing at $174.40. Second resistance is June's high crossing at $178.10. First support is last-Wednesday's low crossing at $168.10. Second support is the 50-day moving average crossing at $166.23.
August Feeder cattle closed up $5.00 at $238.68.
August Feeder cattle gapped up and closed limit up on Tuesday as it extends the rally off last-Wednesday's low. The limit up close sets the stage for a steady to higher opening when Wednesday's day session begins trading. Stochastics and the RSI are bullish signaling that sideways to higher prices are possible near-term. Today's close above the 20-day moving average crossing at $237.22 signals that a short-term low has been posted. If August renews the decline off June's high, May's low crossing at $221.15 is the next downside target. First resistance is the 20-day moving average crossing at $236.98. Second resistance is the June 14th high crossing at $241.90. First support is last-Wednesday's low crossing at $226.70. Second support is May's low crossing at $221.15.
FOOD & FIBERhttp://quotes.ino.com/ex changes/?c=food
September coffee closed higher on Tuesday as it consolidates some of the decline off June's high. The high-range close sets the stage for a steady to higher opening on Wednesday. Stochastics and the RSI are oversold but remain neutral to bearish signaling sideways to lower prices are possible near-term. If September extends the decline off June's high, the 75% retracement level of the January-April rally crossing at $15.88 is the next downside target. Closes above the 20-day moving average crossing at $17.73 would temper the near-term bearish outlook. First resistance is the 20-day moving average crossing at $17.73. Second resistance is the 50-day moving average crossing at $18.25. First support is Monday's low crossing at $16.27. Second support is the 75% retracement level of the January-April rally crossing at $15.88.
September cocoa posted an inside day with a slightly higher close on Tuesday. The mid-range close sets the stage for a steady to higher opening on Wednesday. Stochastics and the RSI are overbought but remain neutral to bullish signaling that sideways to higher prices are possible near-term. If September extends the rally off March's low, monthly resistance crossing at 34.29 is the next upside target. Closes below the 20-day moving average crossing at 31.47 would signal that a short-term top has been posted.
October sugar closed sharply lower for the fourth-day in a row on Tuesday. The low-range close sets the stage for a steady to lower opening on Wednesday. Stochastics and the RSI are oversold but remain bearish signaling that sideways to lower prices are possible near-term. If October extends the decline off June's high, the 38% retracement level of the October-April rally crossing at 22.55 is the next downside target. Closes above the 50-day moving average crossing at 25.06 would signal that a short-term low has been posted.
December cotton closed lower for the fifth-day in a row on Tuesday and below the bottom of the March-June trading range crossing at 77.56. The low-range close sets the stage for a steady to lower opening on Monday. Stochastics and the RSI are neutral to bearish signaling sideways to lower prices are possible near-term. If December extends this month's decline, the November 28th -2022 low crossing at 74.25 is the next downside target. Closes above the 20-day moving average crossing at 80.41 would signal that a low has been posted.
Thanks, tallpine.
Future rain makes grain on steroids today. I totally get how big the increase in rains are on the models and how much good they will do the crop in those places in July but have been surprised at how much risk premium was sucked out so fast with the worst crop ratings since 1988.
Buy the rumor sell the fact. The crop ratings yesterday were dialed in earlier this month when the market saw it coming weeks beforehand.
We trade FUTURES not Pastures (-:
Crop conditions+more 6-26-23
https://www.marketforum.com/forum/topic/96705/
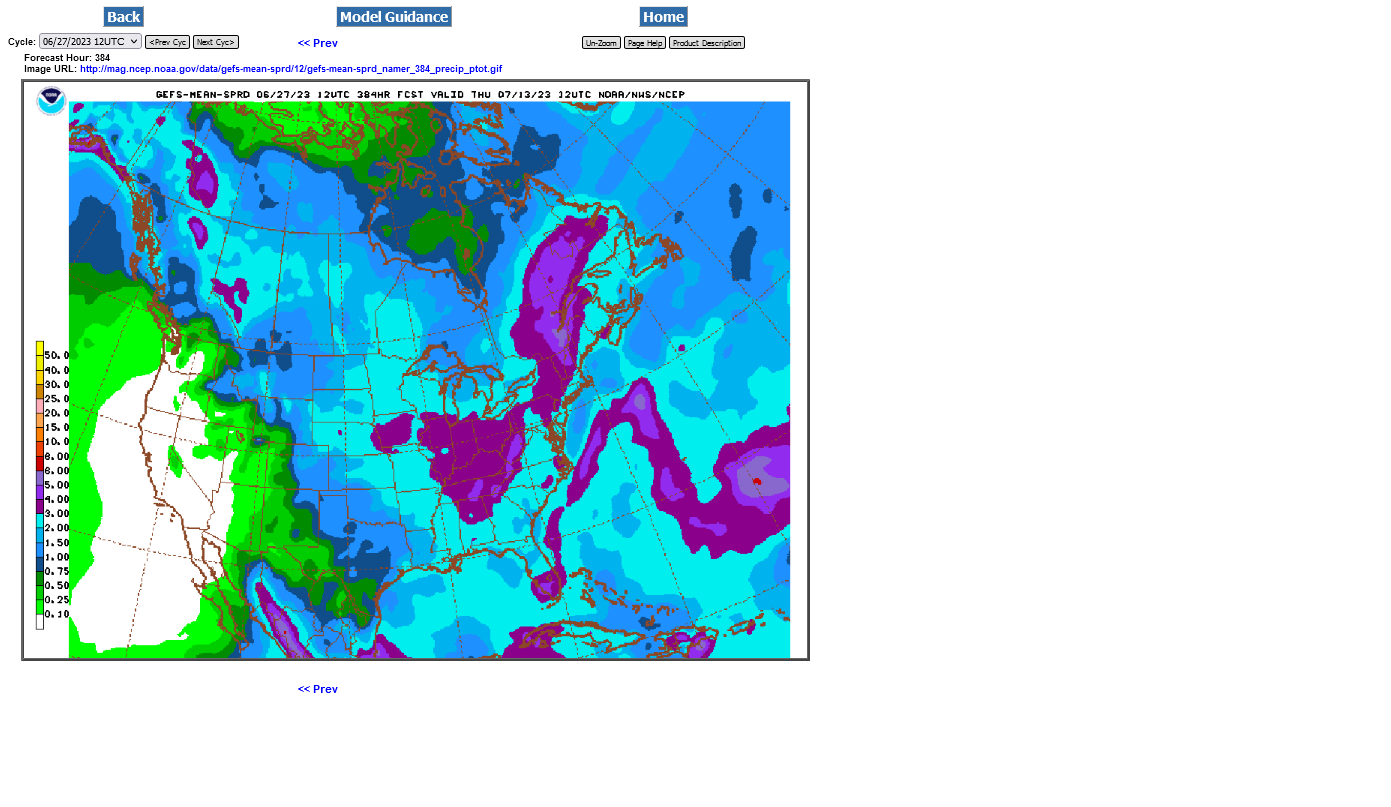
Last 12z GEFS.
The EE has much less rain than this in the Upper Midwest.