KEY EVENTS TO WATCH FOR:
Friday, June 23, 2023
8:30 AM ET. U.S. Weekly Export Sales
9:45 AM ET. June US Flash Manufacturing PMI
PMI, Mfg (expected 49.0; previous 48.5)
9:45 AM ET. June US Flash Services PMI
PMI, Services (expected 53.8; previous 55.1)
The STOCK INDEXES? http://quotes.ino.com/ex?changes/?c=indexes
The STOCK INDEXES: The September NASDAQ 100 was lower overnight and set the stage for a lower opening when the day session begins trading. Stochastics and the RSI are neutral to bearish signaling that sideways to lower prices are possible near-term. Closes below the 20-day moving average crossing at 14,853.30 would signal that a short-term top has been posted. If September renews this year's rally, the 87% retracement level of the 2021-2022-decline on the weekly continuation chart crossing at 15,957.86 is the next upside target. First resistance is last-Friday's high crossing at 15,475.50. Second resistance is the 87% retracement level of the 2021-2022-decline on the weekly continuation chart crossing at 15,957.86. First support is the 20-day moving average crossing at 14,853.30. Second support is the June 1st low crossing at 14,420.00.
The September S&P 500 was lower overnight as it extends the decline off last-Friday's high. Overnight trading sets the stage for a lower opening when the day session begins trading. Stochastics and the RSI are bearish signaling that sideways to lower prices are possible near-term. Closes below the 20-day moving average crossing at 4351.38 would signal that a short-term top has been posted. If June renews the rally off March's low, the 75% retracement level of the 2022 decline crossing at 4505.40 is the next upside target. First resistance is last-Friday's high crossing at 4493.75. Second resistance is the 75% retracement level of the 2022 decline crossing at 4505.40. First support is the 20-day moving average crossing at 4351.38. Second support is the June 8th low crossing at 4305.75.
INTEREST RATES http://quotes.ino.com/ex changes/?c=interest"
INTEREST RATES: September T-bonds was higher overnight as it extends the trading range of the past three-weeks. Overnight trading sets the stage for a higher opening when the day session begins trading. Stochastics and the RSI are neutral to bullish signaling that sideways to higher prices are possible near-term. Closes above 50-day moving average crossing at 129-03 would signal that a short-term low has been posted. If September renews the decline off April's high, the 87% retracement level of the March-April rally crossing at 124-19 is the next downside target. First resistance is the 50-day moving average crossing at 129-03. Second resistance is the June 1st high crossing at 129-16. First support is the 75% retracement level of the March-April rally crossing at 125-30. Second support is the 87% retracement level of the March-April rally crossing at 124-19.
September T-notes were higher overnight and sets the stage for a higher opening when the day session begins trading. Stochastics and the RSI are neutral signaling that sideways trading is possible near-term. If September extends the decline off May's high, the 87% retracement level of the March rally crossing at 111.243 is the next downside target. Closes above the 20-day moving average crossing at 113.153 would signal that a short-term low has been posted. First resistance is the 20-day moving average crossing at 113.153. Second resistance is the June 1st high crossing at 115.000. First support is the 75% retracement level of the March-May rally crossing at 112.190. Second support is the 87% retracement level of the 2022-2023 rally crossing at 111.243.
ENERGY MARKETS? http://quotes.ino.com/ex?changes/?c=energy ""
ENERGIES:Augustcrude oil was lower overnight as it extends Thursday's sharp decline. Overnight trading sets the stage for a lower opening when the day session begins trading. Stochastics and the RSI are neutral to bearish signaling that sideways to lower prices are possible near-term. Closes below the June 12th low crossing at $66.96 would open the door for a possible test of May's low crossing at $64.41. Closes above the 50-day moving average crossing at $72.74 would signal that a short-term low has been posted. First resistance is the 50-day moving average crossing at $72.74. Second resistance is the June 5th high crossing at $75.50. First support is the June 12th low crossing at $66.96. Second support is the May low crossing at $64.41.
August heating oil was lower overnight and set sets the stage for a lower opening when the day session begins trading. Stochastics and the RSI are turning neutral to bearish signaling that sideways to lower prices are possible near-term. Closes below the 20-day moving average crossing at 2.3731 would signal that a short-term top has been posted. If August renews the rally off May's low, April's high crossing at 2.6616 is the next upside target. First resistance is Tuesday's high crossing at 2.5069. Second resistance is April's high crossing at 2.6616. First support is the June 12th low crossing at 2.2876. Second support is the May 31st low crossing at 2.2301.
August unleaded gas was lower overnight and sets the stage for a lower opening when the day session begins trading. Stochastics and the RSI are bearish signaling that sideways to lower prices are possible near-term. Closes below the 50-day moving average crossing at 2.4591 would signal that a short-term top has been posted. If August renews the rally off May's low, the 87% retracement level of the April-May decline crossing at $2.6394 is the next upside target. First resistance is the 87% retracement level of the April-May decline crossing at $2.6394. Second resistance is April's high crossing at $2.7047. First support is the June 12th low crossing at $2.3901. Second support is the May 31st low crossing at 2.3394.
August natural gas was steady to slightly lower overnight. Overnight trading sets the stage for a slightly lower opening when the day session begins trading. Stochastics and the RSI are overbought but remain neutral to bullish signaling that sideways to higher prices are possible near-term. If August extends the rally off June's low, the May 19th high crossing at 2.885 is the next upside target. Closes below the 20-day moving average crossing at 2.474 would signal that a short-term low has been posted. First resistance is the May 19th high crossing at 2.885. Second resistance is the 25% retracement level of the 2022-2023 decline crossing at 3.193. First support is the June 1st low crossing at 2.244. Second support is the September-2020 low on the monthly continuation chart crossing at 1.795.
CURRENCIEShttp://quotes.ino.com/ex changes/?c=currencies"
CURRENCIES:The September Dollar was higher overnight and sets the stage for a higher opening when the day session begins trading later this morning. Stochastics and the RSI are oversold but are turning neutral to bullish signaling that sideways to higher prices are possible near-term. Closes above the 20-day moving average crossing at $102.866 would signal that a short-term low has been posted. If September renews the decline off May's high, May's low crossing at $100.340 is the next downside target. First resistance is the May 31st high crossing at $104.250. Second resistance is the 38% retracement level of the 2022-2023 decline crossing at $104.932.First support is Thursday's low crossing at $101.485. Second support is May's low crossing at $100.340.
The September Euro was sharply lower overnight and sets the stage for a lower opening when the day session begins trading. Stochastics and the RSI are overbought and are turning neutral to bearish signaling that sideways to lower prices are possible near-term. Closes below the 20-day moving average crossing at 1.08569 would signal that a short-term top has been posted while opening the door for additional weakness near-term. If September resumes the rally off May's low, May's high crossing at $1.11710 is the next upside target. First resistance is Thursday's high crossing at $1.10615. Second resistance is May's high crossing at $1.11710. First support is the 20-day moving average crossing at 1.08569. Second support is May's low crossing at 1.07025.
The September British Pound was slightly lower overnight. Overnight trading and sets the stage for a slightly lower opening when the day session begins trading. Stochastics and the RSI are turning neutral to bearish signaling that sideways to lower prices near-term. Closes below the 50-day moving average crossing at 1.2541 would signal that a short-term top has been posted. If September renews the rally off May's low, the 75% retracement level of the 2022-2023 decline crossing at 1.3253 is the next upside target. First resistance is Thursday's high crossing at 1.2874. Second resistance is the 75% retracement level of the 2022-2023 decline crossing at 1.3253. First support is the 10-day moving average crossing at 1.2710. Second support is the 50-day moving average crossing at 1.2541.
The September Swiss Franc was lower overnight and sets the stage for a lower opening when the day session begins trading. Stochastics and the RSI are neutral to bearish signaling that sideways to lower prices are possible near-term. Closes below the 20-day moving average crossing at 1.11974 would signal that a short-term top has been posted. If September renews the rally off May's low, May's high crossing at 1.14920 is the next upside target. First resistance is last-Friday's high crossing at 1.13410. Second resistance is May's high crossing at 1.14920. First support is June's low crossing at 1.10920. Second support is May's low crossing at 1.10700.
The September Canadian Dollar was lower overnight and sets the stage for a lower opening when the day session begins trading. Stochastics and the RSI are overbought but remain neutral to bullish signaling that sideways to higher prices are possible near-term. If September extends the rally off the May 26th low, the 38% retracement level of the 2022-2023 decline crossing at $76.28 is the next upside target. Closes below the 20-day moving average crossing at $74.96 would signal that a short-term top has been posted. First resistance is Thursday's high crossing at $76.22. Second resistance is the 38% retracement level of the 2022-2023 decline crossing at $76.28. First support is the 10-day moving average crossing at $75.60. Second support is 20-day moving average crossing at $74.96.
The September Japanese Yen was slightly lower in late-overnight trading as it extends this month's decline. Overnight trading sets the stage for a lower opening when the day session begins trading. Stochastics and the RSI are oversold but remain neutral to bearish signaling that sideways to lower prices are possible near-term. If September extends the decline off the March's high, the October 21st -2022 low crossing at 0.069270 is the next downside target. Closes above the 20-day moving average crossing at 0.072363 would signal that a short-term low has been posted. First resistance is the June 1st high crossing at 0.073430. Second resistance is the 50-day moving average crossing at 0.074140. First support is the 87% retracement level of the 2022-2023 rally crossing at 0.070777. Second support is the October 21st -2022 low crossing at 0.069270.
PRECIOUS METALS http://quotes.ino.com/ex changes/?c=metals"
Precious Metals: Augustgold was higher overnight as it consolidates some of Thursday's downside breakout of the May-June trading range. Overnight trading sets the stage for a higher opening when the day session begins trading later this morning. Stochastics and the RSI are oversold but remain neutral to bearish signaling that sideways to lower prices are possible near-term. If August extends the decline off May's high, the 50% retracement level of the September-May rally crossing at $1892.30 is the next downside target. Closes above the 20-day moving average crossing at $1965.20 would signal that a short-term low has been posted. First resistance is the 20-day moving average crossing at $1965.20. Second resistance is the 50-day moving average crossing at $2002.60. First support is the 50% retracement level of the September-May rally crossing at $1892.30. Second support is the 62% retracement level of the September-May rally crossing at $1842.60.
July silver was lower overnight and sets the stage for a lower opening when the day session begins trading later this morning. Stochastics and the RSI are oversold but remain neutral to bearish signaling that sideways to lower prices are possible near-term. If July extends this month's decline, the 75% retracement level of the March-April rally crossing at $21.708 is the next downside target. Closes above the 20-day moving average crossing at $23.568 would signal that a short-term low has likely been posted. First resistance is the 20-day moving average crossing at $23.568. Second resistance is the 50-day moving average crossing at $24.434. First support is the 75% retracement level of the March-April rally crossing at 21.708. Second support is the 87% retracement level of the March-April rally crossing at 20.946.
July copper was lower overnight and sets the stage for a lower opening when the day session begins trading. Stochastics and the RSI are overbought but are turning neutral to bearish signaling that sideways to lower prices are possible near-term. Closes below the 20-day moving average crossing at 3.7826 would signal that a short-term top has been posted. If July extends the rally off May's low, May's high crossing at 4.0050 is the next upside target. First resistance is Thursday's high crossing at 3.9670. Second resistance is May's high crossing at 4.0050. First support is the 20-day moving average crossing at 3.7826. Second support is May's low crossing at 3.5450.
GRAINS http://quotes.ino.com/ex changes/?c=grains
Grains: December corn was lower overnight as it consolidates some of its recent gains. Overnight trading sets the stage for a lower opening when the day sessions begins trading. Stochastics and the RSI are overbought but remain neutral to bullish signaling that sideways to higher prices are possible near-term. If December extends the rally off May's low, the 75% retracement level of the 2022-2023 decline crossing at $6.32 1/2 is the next upside target. Closes below the 20-day moving average crossing at $5.55 3/4 would signal that a short-term top has been posted.First resistance is Wednesday's high crossing at $6.29 3/4. Second resistance is the 75% retracement level of the 2022-2023 decline crossing at $6.32 1/2. First support is the 10-day moving average crossing at $5.80 1/2. Second support is the 20-day moving average crossing at $5.55 3/4.
September wheat was lower overnight as it consolidates some of this week's rally. Overnight trading sets the stage for a lower opening when the day session begins trading. Stochastics and the RSI are overbought but remain neutral to bullish signaling that sideways to higher prices are possible near-term. If September extends the rally off May's low, the 38% retracement level of the 2022-2023 decline crossing at $7.95 1/4 is the next upside target. Closes below the 20-day moving average crossing at $6.58 would signal that a short-term top has been posted. First resistance is Thursday's high crossing at $7.60 3/4. Second resistance is the 38% retracement level of the 2022-2023 decline crossing at $7.95 1/4. First support is the 10-day moving average crossing at $6.90 1/4. Second support is the 20-day moving average crossing at $6.58.
September Kansas City wheat was lower overnight as it consolidates some of this week's rally. Overnight weakness sets the stage for a lower opening when the day session begins trading later this morning. Stochastics and the RSI are overbought but remain neutral to bullish signaling that sideways to higher prices are possible near-term. If September extends this month's rally, May's high crossing at $9.02 is the next upside target. Closes below the 20-day moving average crossing at $8.13 1/4 would signal that a short-term top has been posted. First resistance is Thursday's high crossing at $8.89 1/2. Second resistance is May's high crossing at $9.02. First support is the 50-day moving average crossing at $8.19. Second support is the 20-day moving average crossing at $8.13 1/4.
September Minneapolis wheat was lower overnight as it consolidates some of this week's gains. Overnight trading sets the stage for a lower opening when the day session begins trading. Stochastics and the RSI are overbought but remain neutral to bullish signaling that sideways to higher prices are possible near-term. If September extends the rally off the May 31st low, April's high crossing at $9.10 1/2 is the next upside target. Closes below the 20-day moving average crossing at $8.24 1/4 would signal that a short-term top has been posted. First resistance is Thursday's high crossing at $8.94 1/2. Second resistance is April's high crossing at $9.10 1/2. First support is the 50-day moving average crossing at $8.31 3/4. Second support is the 20-day moving average crossing at $8.24 1/4.
SOYBEAN COMPLEX? http://quotes.ino.com/ex?changes/?c=grains "
November soybeans were lower overnight as it consolidates some of the rally off May's low. Overnight trading sets the stage for a lower opening when the day session begins trading later this morning. Stochastics and the RSI are overbought but remain neutral to bullish signaling that sideways to higher prices are possible near-term. If November extends the aforementioned rally, the 87% retracement level of the 2022-2023 decline crossing at $14.07 1/2 is the next upside target. Closes below the 50-day moving average crossing at $12.45 1/2 would temper the near-term friendly outlook. First resistance is the 75% retracement level of the 2022-2023 decline crossing at $13.69 1/4. Second resistance 87% retracement level of the 2022-2023 decline crossing at $14.07 1/2. First support is the 10-day moving average crossing at $12.90 1/4. Second support is the 50-day moving average crossing at $12.45 1/2.
December soybean meal was sharply lower overnight as it consolidates some of this month's rally. Overnight trading sets the stage for a sharply lower opening when the day session begins trading. Stochastics and the RSI are overbought and are turning neutral to bearish signaling that sideways to lower prices are possible near-term. Closes below the 50-day moving average crossing at $391.90 would signal that a short-term top has been posted. If December renews the rally off May's low, March's high crossing at $437.70 is the next upside target. First resistance is Wednesday's high crossing at $432.60. Second resistance is March's high crossing at $437.70. First support is the 50-day moving average crossing at $391.90. Second support is the 20-day moving average crossing at $381.00.
July soybean oil was higher overnight as it consolidates some of the decline off last-Friday's high. Overnight trading sets the stage for a higher opening when the day session begins trading. Stochastics and the RSI have turned neutral to bearish signaling that sideways to lower prices are possible near-term. Closes below the 50-day moving average crossing at 52.04 would signal that a short-term top has been posted. If July renews the rally off May's low, the February 22nd high crossing at 60.52 is the next upside target. First resistance is February 22nd high crossing at 60.52. Second resistance is the December 30th high crossing at 63.57. First support is the 50-day moving average crossing at 52.04. Second support is May's low crossing at 44.53.
Thanks, tallpine!
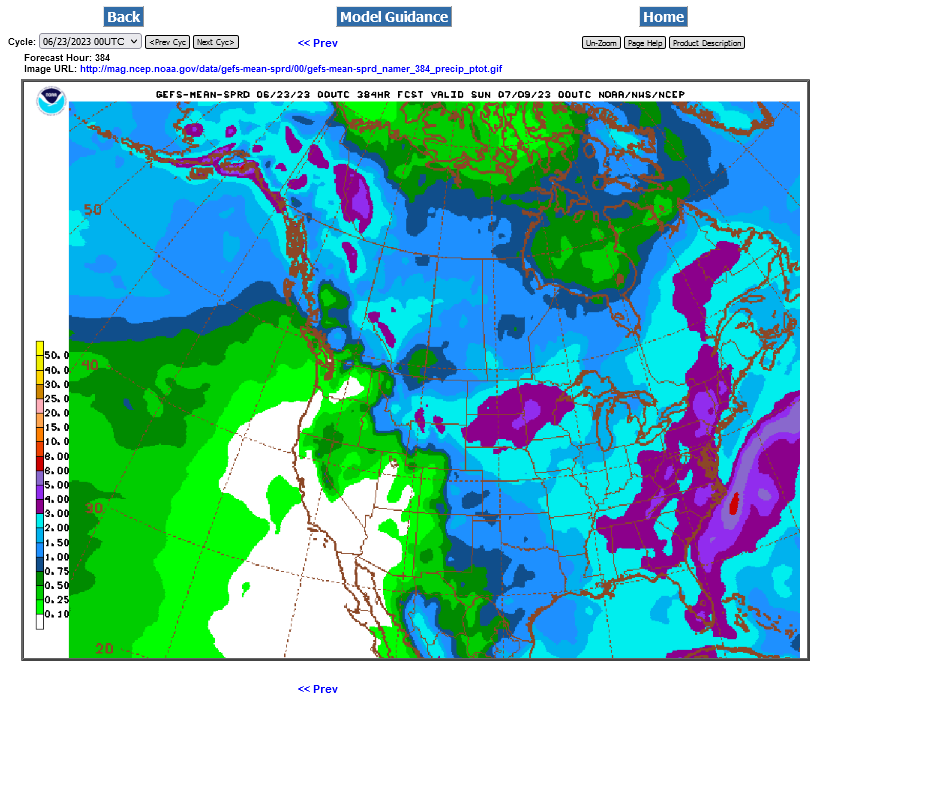
Rains increasing in the forecast, especially week 2 and getting a bit closer is clobbering the grains.
This was the last 0z GEFS: