KEY EVENTS TO WATCH FOR:
Thursday, June 22, 2023
8:30 AM ET. May Chicago Fed National Activity Index (CFNAI)
NAI (previous 0.07)
NAI, 3-mo Moving Avg (previous -0.22)
8:30 AM ET. 1st Quarter International Transactions
Current Account (USD) (expected -217.1B; previous -206.81B)
8:30 AM ET. Unemployment Insurance Weekly Claims Report - Initial Claims
Jobless Claims (expected 256K; previous 262K)
Jobless Claims, Net Chg (previous +0K)
Continuing Claims (previous 1775000)
Continuing Claims, Net Chg (previous +20K)
10:00 AM ET. May Leading Indicators
Leading Index, M/M% (expected -0.7%; previous -0.6%)
Leading Index
Coincident Index, M/M% (previous +0.3%)
Lagging Index, M/M% (previous -0.1%)
10:00 AM ET. May Existing Home Sales
Existing Sales (expected 4.25M; previous 4.28M)
Existing Sales, M/M% (expected -0.7%; previous -3.4%)
Unsold Homes Month's Supply (previous 2.9)
Median Price (USD) (previous 388800)
Median Home Price, Y/Y% (previous -1.7%)
10:30 AM ET. EIA Weekly Natural Gas Storage Report
Working Gas In Storage (Cbf) (previous 2634B)
Working Gas In Storage, Net Chg (Cbf) (previous +84B)
11:00 AM ET. EIA Weekly Petroleum Status Report
Crude Oil Stocks (Bbl) (previous 467.124M)
Crude Oil Stocks, Net Chg (Bbl) (previous +7.919M)
Gasoline Stocks (Bbl) (previous 220.923M)
Gasoline Stocks, Net Chg (Bbl) (previous +2.108M)
Distillate Stocks (Bbl) (previous 113.854M)
Distillate Stocks, Net Chg (Bbl) (previous +2.123M)
Refinery Usage (previous 93.7%)
Total Prod Supplied (Bbl/day) (previous 20.408M)
Total Prod Supplied, Net Chg (Bbl/day) (previous +1.187M)
11:00 AM ET. June Federal Reserve Bank of Kansas City Survey of Tenth District Manufacturing
Mfg Activity Idx (previous -2)
6-Mo Exp Prod Idx (previous 13)
Mfg Composite Idx (expected -2; previous -1)
6-Mo Exp Composite Idx (previous 2)
4:30 PM ET. Foreign Central Bank Holdings
4:30 PM ET. Federal Discount Window Borrowings
Friday, June 23, 2023
8:30 AM ET. U.S. Weekly Export Sales
9:45 AM ET. June US Flash Manufacturing PMI
PMI, Mfg (expected 49.0; previous 48.5)
9:45 AM ET. June US Flash Services PMI
PMI, Services (expected 53.8; previous 55.1)
The STOCK INDEXES? http://quotes.ino.com/ex?changes/?c=indexes
The STOCK INDEXES: The September NASDAQ 100 was lower overnight as it extends the decline off last-Friday's high. Overnight tradingset the stage for a lower opening when the day session begins trading. Stochastics and the RSI are bearish signaling that sideways to lower prices are possible near-term. Closes below the 20-day moving average crossing at 14,777.26 would signal that a short-term top has been posted. If September renews this year's rally, the 87% retracement level of the 2021-2022-decline on the weekly continuation chart crossing at 15,957.86 is the next upside target. First resistance is last-Friday's high crossing at 15,475.50. Second resistance is the 87% retracement level of the 2021-2022-decline on the weekly continuation chart crossing at 15,957.86. First support is the 20-day moving average crossing at 14,777.26. Second support is the June 1st low crossing at 14,420.00.
The September S&P 500 was lower overnight as it extends the decline off last-Friday's high. Overnight trading sets the stage for a lower opening when the day session begins trading. Stochastics and the RSI are bearish signaling that sideways to lower prices are possible near-term. Closes below the 20-day moving average crossing at 4338.36 would signal that a short-term top has been posted. If June extends the rally off March's low, the 75% retracement level of the 2022 decline crossing at 4505.40 is the next upside target. First resistance is last-Friday's high crossing at 4493.75. Second resistance is the 75% retracement level of the 2022 decline crossing at 4505.40. First support is the 20-day moving average crossing at 4338.35. Second support is the June 8th low crossing at 4305.75.
INTEREST RATES http://quotes.ino.com/ex changes/?c=interest"
INTEREST RATES: September T-bonds was lower overnight as it extends the trading range of the past three-weeks. Overnight trading sets the stage for a lower opening when the day session begins trading. Stochastics and the RSI are neutral to bullish signaling that sideways to higher prices are possible near-term. Closes above 50-day moving average crossing at 129-06 would signal that a short-term low has been posted. If September renews the decline off April's high, the 87% retracement level of the March-April rally crossing at 124-19 is the next downside target. First resistance is the 50-day moving average crossing at 129-06. Second resistance is the June 1st high crossing at 129-16. First support is the 75% retracement level of the March-April rally crossing at 125-30. Second support is the 87% retracement level of the March-April rally crossing at 124-19.
September T-notes were lower overnight and sets the stage for a lower opening when the day session begins trading. Stochastics and the RSI are neutral signaling that sideways trading is possible near-term. If September extends the decline off May's high, the 87% retracement level of the March rally crossing at 111.243 is the next downside target. Closes above the 20-day moving average crossing at 113.175 would signal that a short-term low has been posted. First resistance is the 20-day moving average crossing at 113.175. Second resistance is the June 1st high crossing at 115.000. First support is the 75% retracement level of the March-May rally crossing at 112.190. Second support is the 87% retracement level of the 2022-2023 rally crossing at 111.243.
ENERGY MARKETS? http://quotes.ino.com/ex?changes/?c=energy ""
ENERGIES:Julycrude oil was lower overnight as it consolidates some of the rally off the June 12th low. Overnight trading sets the stage for a lower opening when the day session begins trading. Stochastics and the RSI are neutral to bullish signaling that sideways to higher prices are possible near-term. If July extends the rally off the June 12th low, the 50-day moving average crossing at $73.51 is the next upside target. Closes below the June 12th low crossing at $66.80 would open the door for a possible test of May's low crossing at $63.90. First resistance is the 50-day moving average crossing at $73.51. Second resistance is the June 5th high crossing at $75.06. First support is the June 12th low crossing at $66.80. Second support is the May low crossing at $63.90.
July heating oil was lower overnight and set sets the stage for a lower opening when the day session begins trading. Stochastics and the RSI are overbought but remain neutral to bullish signaling that sideways to higher prices are possible near-term. If July extends the rally off May's low, April's high crossing at 2.6760 is the next upside target. Closes below the 20-day moving average crossing at 2.3924 would signal that a short-term top has been posted. First resistance is the overnight high crossing at 2.5760. Second resistance is April's high crossing at 2.6760. First support is the June 12th low crossing at 2.2970. Second support is the May 31st low crossing at 2.2839.
July unleaded gas was lower overnight and sets the stage for a lower opening when the day session begins trading. Stochastics and the RSI are turning neutral to bearish signaling that sideways to lower prices are possible near-term. Closes below the 50-day moving average crossing at 2.5270 would signal that a short-term top has been posted. If July renews the rally off May's low, the 87% retracement level of the April-May decline crossing at $2.6958 is the next upside target. First resistance is the 87% retracement level of the April-May decline crossing at $2.6958. Second resistance is April's high crossing at $2.7675. First support is the 20-day moving average crossing at $2.5640. Second support is the 50-day moving average crossing at 2.5270.
July natural gas was steady to slightly higher overnight. Overnight trading sets the stage for a slightly higher opening when the day session begins trading. Stochastics and the RSI are overbought but remain neutral to bullish signaling that sideways to higher prices are possible near-term. If July extends the rally off June's low, the May 19th high crossing at 2.816 is the next upside target. Closes below the 20-day moving average crossing at 2.382 would signal that a short-term low has been posted. First resistance is the May 19th high crossing at 2.816. Second resistance is the 25% retracement level of the 2022-2023 decline crossing at 3.118. First support is the June 1st low crossing at 2.136. Second support is the September-2020 low on the monthly continuation chart crossing at 1.795.
CURRENCIEShttp://quotes.ino.com/ex changes/?c=currencies"
CURRENCIES:The September Dollar was slightly lower overnight and sets the stage for a lower opening when the day session begins trading later this morning. Stochastics and the RSI are oversold but remain neutral to bearish signaling that sideways to lower prices are possible near-term. If September renews the decline off May's high, May's low crossing at $100.340 is the next downside target. Closes above the 20-day moving average crossing at $102.900 would signal that a short-term low has been posted. First resistance is the May 31st high crossing at $104.250. Second resistance is the 38% retracement level of the 2022-2023 decline crossing at $104.932.First support is last-Friday's low crossing at $101.585. Second support is May's low crossing at $100.340.
The September Euro was steady to slightly higher overnight as it extends the rally off May's low. Overnight trading sets the stage for a slightly higher opening when the day session begins trading. Stochastics and the RSI are overbought but remain neutral to bullish signaling that sideways to higher prices are possible near-term. If September extends the rally off May's low, May's high crossing at $1.11710 is the next upside target. Closes below the 20-day moving average crossing at 1.08543 would signal that a short-term top has been posted while opening the door for additional weakness near-term. First resistance is the overnight high crossing at $1.10565. Second resistance is May's high crossing at $1.11710. First support is the 20-day moving average crossing at 1.08543. Second support is May's low crossing at 1.07025.
The September British Pound was slightly higher overnight. Overnight trading and sets the stage for a steady to higher opening when the day session begins trading. Stochastics and the RSI are overbought but remain neutral to bullish signaling that sideways to higher prices near-term. If September renews the rally off May's low, the 75% retracement level of the 2022-2023 decline crossing at 1.3253 is the next upside target. Closes below the 50-day moving average crossing at 1.2538 would signal that a short-term top has been posted. First resistance is last-Friday's high crossing at 1.2863. Second resistance is the 75% retracement level of the 2022-2023 decline crossing at 1.3253. First support is the 10-day moving average crossing at 1.2699. Second support is the 50-day moving average crossing at 1.2538.
The September Swiss Franc was steady to slightly lower overnight and sets the stage for a slightly lower opening when the day session begins trading. Stochastics and the RSI are neutral to bullish signaling that sideways to higher prices are possible near-term. If September renews the rally off May's low, May's high crossing at 1.14920 is the next upside target. Closes below the 20-day moving average crossing at 1.11976 would signal that a short-term top has been posted. First resistance is last-Friday's high crossing at 1.13410. Second resistance is May's high crossing at 1.14920. First support is June's low crossing at 1.10920. Second support is May's low crossing at 1.10700.
The September Canadian Dollar was steady to slightly higher overnight and sets the stage for a slightly higher opening when the day session begins trading. Stochastics and the RSI are overbought but remain neutral to bullish signaling that sideways to higher prices are possible near-term. If September extends the rally off the May 26th low, the 38% retracement level of the 2022-2023 decline crossing at $76.28 is the next upside target. Closes below the 20-day moving average crossing at $74.85 would signal that a short-term top has been posted. First resistance is the overnight high crossing at $76.22. Second resistance is the 38% retracement level of the 2022-2023 decline crossing at $76.28. First support is the 10-day moving average crossing at $75.51. Second support is 20-day moving average crossing at $74.85.
The September Japanese Yen was slightly lower in late-overnight trading as it extends this month's decline. Overnight trading sets the stage for a lower opening when the day session begins trading. Stochastics and the RSI are oversold but remain neutral to bearish signaling that sideways to lower prices are possible near-term. If September extends the decline off the March's high, the 87% retracement level of the 2022-2023 rally crossing at 0.070777 is the next downside target. Closes above the 20-day moving average crossing at 0.072508 would signal that a short-term low has been posted. First resistance is the June 1st high crossing at 0.073430. Second resistance is the 50-day moving average crossing at 0.074272. First support is the 87% retracement level of the 2022-2023 rally crossing at 0.070777. Second support is the October 21st low crossing at 0.069270.
PRECIOUS METALS http://quotes.ino.com/ex changes/?c=metals"
Precious Metals: Augustgold was lower overnight and appears to be breaking out to the downside of the May-June trading range. Overnight trading sets the stage for a lower opening when the day session begins trading later this morning. Stochastics and the RSI are neutral to bearish signaling that sideways to lower prices are possible near-term. If August extends the decline off May's high, the 50% retracement level of the September-May rally crossing at $1892.30 is the next downside target. Closes above the 50-day moving average crossing at $2005.20 would signal that a short-term low has been posted. First resistance is the 50-day moving average crossing at $2005.20. Second resistance is the May 4th high crossing at $2102.20. First support is the 38% retracement level of the September-May rally crossing at $1941.90. Second support is the 50% retracement level of the September-May rally crossing at $1892.30.
July silver was lower overnight and sets the stage for a lower opening when the day session begins trading later this morning. Stochastics and the RSI are oversold but remain neutral to bearish signaling that sideways to lower prices are possible near-term. If July extends this month's decline, the 75% retracement level of the March-April rally crossing at $21.708 is the next downside target. Closes above the 10-day moving average crossing at $23.750 would signal that a short-term low has likely been posted. First resistance is the 50-day moving average crossing at $24.504. Second resistance is May's high crossing at $26.435. First support is the 62% retracement level of the March-April rally crossing at 22.546. Second support is the 75% retracement level of the March-April rally crossing at 21.708.
July copper was slightly higher overnight and sets the stage for a higher opening when the day session begins trading. Stochastics and the RSI are overbought but remain neutral to bullish signaling that sideways to higher prices are possible near-term. If July extends the rally off May's low, May's high crossing at 4.0050 is the next upside target. Closes below the 20-day moving average crossing at 3.7712 would signal that a short-term top has been posted. First resistance is the May 8th high crossing at 3.9595. Second resistance is May's high crossing at 4.0050. First support is the 20-day moving average crossing at 3.7712. Second support is May's low crossing at 3.5450.
GRAINS http://quotes.ino.com/ex changes/?c=grains
Grains: December corn was lower overnight as it consolidates some of its recent gains. Overnight trading sets the stage for a lower opening when the day sessions begins trading. Stochastics and the RSI are overbought but remain neutral to bullish signaling that sideways to higher prices are possible near-term. If December extends the rally off May's low, the 75% retracement level of the 2022-2023 decline crossing at $6.32 1/2 is the next upside target. Closes below the 20-day moving average crossing at $5.51 1/4 would signal that a short-term top has been posted.First resistance is Wednesday's high crossing at $6.29 3/4. Second resistance is the 75% retracement level of the 2022-2023 decline crossing at $6.32 1/2. First support is the 10-day moving average crossing at $5.73. Second support is the 20-day moving average crossing at $5.51 1/4.
September wheat was lower overnight as it consolidates some of Wednesday's rally. Overnight trading sets the stage for a lower opening when the day session begins trading. Stochastics and the RSI are overbought but remain neutral to bullish signaling that sideways to higher prices are possible near-term. If September extends the rally off May's low, the 38% retracement level of the 2022-2023 decline crossing at $7.95 1/4 is the next upside target. Closes below the 20-day moving average crossing at $6.51 1/4 would signal that a short-term top has been posted. First resistance is Wednesday's high crossing at $7.48 3/4. Second resistance is the 38% retracement level of the 2022-2023 decline crossing at $7.95 1/4. First support is the 10-day moving average crossing at $6.78 3/4. Second support is the 50-day moving average crossing at $6.57.
September Kansas City wheat was lower overnight and sets the stage for a lower opening when the day session begins trading later this morning. Stochastics and the RSI are overbought but remain neutral to bullish signaling that sideways to higher prices are possible near-term. If September extends this month's rally, May's high crossing at $9.02 is the next upside target. Closes below the 20-day moving average crossing at $8.10 would signal that a short-term top has been posted.First resistance is Wednesday's high crossing at $8.75. Second resistance is May's high crossing at $9.02. First support is the 50-day moving average crossing at $8.18 1/2. Second support is the 20-day moving average crossing at $8.10 1/4.
September Minneapolis wheat was lower overnight as it consolidates some of Wednesday's gains. Overnight trading sets the stage for a lower opening when the day session begins trading. Stochastics and the RSI are overbought but remain neutral to bullish signaling that sideways to higher prices are possible near-term. If September extends the rally off the May 31st low, May's high crossing at $8.89 1/2 is the next upside target. Closes below the 20-day moving average crossing at $8.20 1/4 would signal that a short-term top has been posted. First resistance is Wednesday's high crossing at $8.82 3/4. Second resistance is May's high crossing at $8.89 1/2. First support is the 50-day moving average crossing at $8.31 1/4. Second support is the 20-day moving average crossing at $8.20 1/4.
SOYBEAN COMPLEX? http://quotes.ino.com/ex?changes/?c=grains "
November soybeans were lower overnight as it consolidates some of the rally off May's low. Overnight trading sets the stage for a lower opening when the day session begins trading later this morning. Stochastics and the RSI are overbought but remain neutral to bullish signaling that sideways to higher prices are possible near-term. If November extends the aforementioned rally, the 87% retracement level of the 2022-2023 decline crossing at $14.07 1/2 is the next upside target. Closes below the 50-day moving average crossing at $12.45 3/4 would temper the near-term friendly outlook. First resistance is the 75% retracement level of the 2022-2023 decline crossing at $13.69 1/4. Second resistance 87% retracement level of the 2022-2023 decline crossing at $14.07 1/2. First support is the 50-day moving average crossing at $12.45 3/4. Second support is the 20-day moving average crossing at $12.26 1/2.
December soybean meal was lower overnight as it consolidates some of Wednesday's sharp rally. Overnight trading sets the stage for a lower opening when the day session begins trading. Stochastics and the RSI are overbought but remain neutral to bullish signaling that sideways to higher prices are possible near-term. If December extends the rally off May's low, March's high crossing at $437.70 is the next upside target. Closes below the 50-day moving average crossing at $392.30 would signal that a short-term top has been posted. First resistance is Wednesday's high crossing at $432.60. Second resistance is March's high crossing at $437.70. First support is the 50-day moving average crossing at $392.30. Second support is the 20-day moving average crossing at $380.00.
July soybean oil gapped down and was lower overnight as it extends the decline off last-Friday's high. Overnight trading sets the stage for a sharply lower opening when the day session begins trading. Stochastics and the RSI have turned bearish signaling that sideways to lower prices are possible near-term. Closes below the 50-day moving average crossing at 51.96 would signal that a short-term top has been posted. If July renews the rally off May's low, the February 22nd high crossing at 60.52 is the next upside target. First resistance is February 22nd high crossing at 60.52. Second resistance is the December 30th high crossing at 63.57. First support is the 50-day moving average crossing at 51.96. Second support is May's low crossing at 44.53.
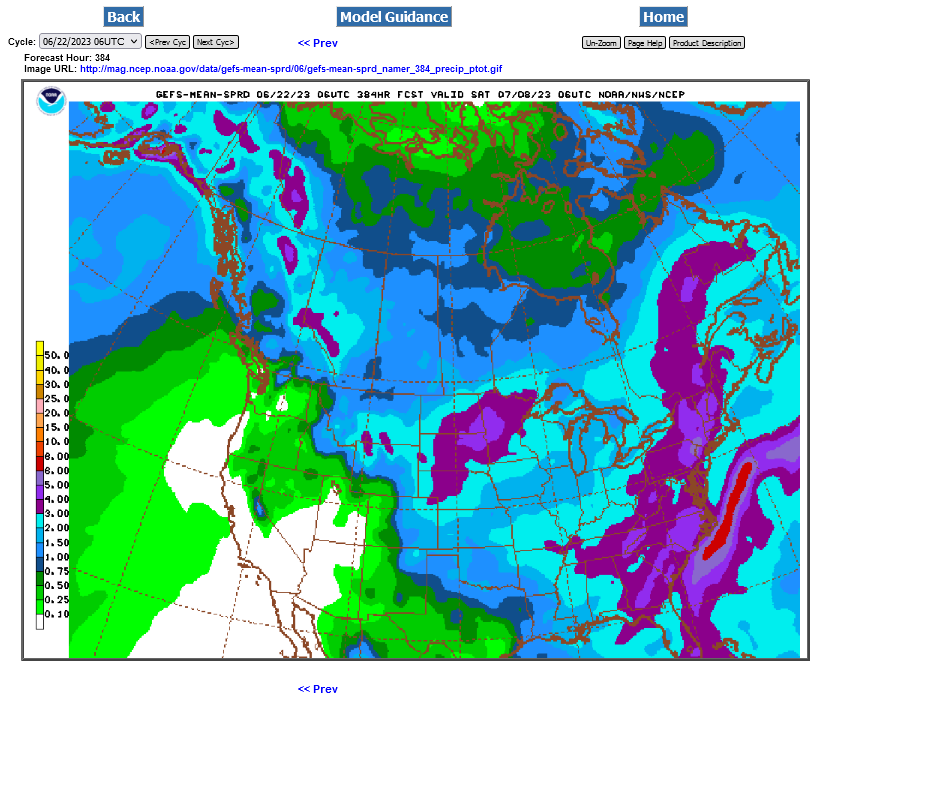
Rains increasing, as suspected with the NON dome of death pattern:
The last 6z GEFS below. This model has been too wet during the current flash drought. The EE is still trailing but also increased rains a bit the last 2 runs.