KEY EVENTS TO WATCH FOR:
Thursday, June 22, 2023
8:30 AM ET. May Chicago Fed National Activity Index (CFNAI)
NAI (previous 0.07)
NAI, 3-mo Moving Avg (previous -0.22)
8:30 AM ET. 1st Quarter International Transactions
Current Account (USD) (expected -217.1B; previous -206.81B)
8:30 AM ET. Unemployment Insurance Weekly Claims Report - Initial Claims
Jobless Claims (expected 256K; previous 262K)
Jobless Claims, Net Chg (previous +0K)
Continuing Claims (previous 1775000)
Continuing Claims, Net Chg (previous +20K)
10:00 AM ET. May Leading Indicators
Leading Index, M/M% (expected -0.7%; previous -0.6%)
Leading Index
Coincident Index, M/M% (previous +0.3%)
Lagging Index, M/M% (previous -0.1%)
10:00 AM ET. May Existing Home Sales
Existing Sales (expected 4.25M; previous 4.28M)
Existing Sales, M/M% (expected -0.7%; previous -3.4%)
Unsold Homes Month's Supply (previous 2.9)
Median Price (USD) (previous 388800)
Median Home Price, Y/Y% (previous -1.7%)
10:30 AM ET. EIA Weekly Natural Gas Storage Report
Working Gas In Storage (Cbf) (previous 2634B)
Working Gas In Storage, Net Chg (Cbf) (previous +84B)
11:00 AM ET. EIA Weekly Petroleum Status Report
Crude Oil Stocks (Bbl) (previous 467.124M)
Crude Oil Stocks, Net Chg (Bbl) (previous +7.919M)
Gasoline Stocks (Bbl) (previous 220.923M)
Gasoline Stocks, Net Chg (Bbl) (previous +2.108M)
Distillate Stocks (Bbl) (previous 113.854M)
Distillate Stocks, Net Chg (Bbl) (previous +2.123M)
Refinery Usage (previous 93.7%)
Total Prod Supplied (Bbl/day) (previous 20.408M)
Total Prod Supplied, Net Chg (Bbl/day) (previous +1.187M)
11:00 AM ET. June Federal Reserve Bank of Kansas City Survey of Tenth District Manufacturing
Mfg Activity Idx (previous -2)
6-Mo Exp Prod Idx (previous 13)
Mfg Composite Idx (expected -2; previous -1)
6-Mo Exp Composite Idx (previous 2)
4:30 PM ET. Foreign Central Bank Holdings
4:30 PM ET. Federal Discount Window Borrowings
Friday, June 23, 2023
8:30 AM ET. U.S. Weekly Export Sales
9:45 AM ET. June US Flash Manufacturing PMI
PMI, Mfg (expected 49.0; previous 48.5)
9:45 AM ET. June US Flash Services PMI
PMI, Services (expected 53.8; previous 55.1)
The STOCK INDEXES? http://quotes.ino.com/ex?changes/?c=indexes
The Dow closed lower on Wednesday as it extended Tuesday's loss. The low-range close sets the stage for a steady to lower opening when Thursday's day session begins trading. Stochastics and the RSI are turning neutral to bearish signaling that sideways to lower prices are possible near-term. Closes below the 20-day moving average crossing at 33,604.44 would signal that a short-term top has been posted. If the Dow extends the rally off May's low, the December-2022 high crossing at 34,712.28 is the next upside target. First resistance is last-Friday's high crossing at 34,588.68. Second resistance is the December-2022 high crossing at 34,712.28. First support is the 10-day moving average crossing at 34,046.38. Second support is the 20-day moving average crossing at 33,604.44.
The September NASDAQ 100 closed lower on Wednesday as it consolidates some of this month's rally. The low-range close sets the stage for a steady to lower opening when Thursday's night session begins trading. Stochastics and the RSI are turning neutral to bearish signaling sideways to lower prices are possible. Closes below the 20-day moving average crossing at 14,725.84 would signal that a short-term top has been posted. If September resumes this year's rally, the 87% retracement level of the 2021-2022-decline on the weekly continuation chart crossing at 15,957.86 is the next upside target. First resistance is last-Friday's high crossing at 15,475.50. Second resistance is the 87% retracement level of the 2020-2022-decline on the weekly continuation chart crossing at 15,957.86. First support is the 20-day moving average crossing at 14,725.84. Second support is the 50-day moving average crossing at 13,948.90.
The September S&P 500 closed lower on Wednesday due to profit taking ahead of Wednesday's Fed meeting. The mid-range close sets the stage for a steady to lower opening when Thursday's night session begins trading. Stochastics and the RSI are overbought but are turning neutral to bearish signaling that sideways to lower prices are possible near-term. Closes below the 20-day moving average crossing at 4329.25 would signal that a short-term top has been posted. If September extends the rally off March's low, the 75% retracement level of the 2022 decline on the weekly chart crossing at 4505.40 is the next upside target. First resistance is last-Friday's high crossing at 4493.75. Second resistance is the 75% retracement level of the 2022 decline on the weekly chart crossing at 4505.40. First support is the 10-day moving average crossing at 4401.57. Second support is the 20-day moving average crossing at 4329.26.
INTEREST RATES? http://quotes.ino.com/ex?changes/?c=interest ""
September T-bonds closed up 2/32's at 128-04.
September T-bonds posted an inside day on Wednesday as it extends June's trading range. The high-range close sets the stage for a steady to higher opening when Thursday's day session begins trading. Stochastics and the RSI are neutral to bullish signaling that sideways to higher prices are possible near-term. Closes above the 50-day moving average crossing at 129-09 would confirm that a short-term low has been posted while opening the door for additional gains near-term. If September renews the decline off April's high, the 87% retracement level of the March-April rally crossing at 124-19 is the next downside target. First resistance is the 50-day moving average crossing at 129-09. Second resistance is the May 11th high crossing at 132-13. First support is the 75% retracement level of the March-April rally crossing at 125-30. Second support is the 87% retracement level of the March- April rally crossing at 124-19.
September T-notes closed down 10-pts. at 113.090.
September T-notes closed slightly lower on Wednesday. The high-range close sets the stage for a steady to higher opening when Thursday's day session begins trading. Stochastics and the RSI are turning neutral to bullish signaling that sideways to higher prices are possible near-term. Closes above last-Tuesday's high crossing at 114.000 would signal that a short-term low has been posted. If September extends the decline off May's high, the 87% retracement level of March's rally crossing at 111.243 is the next downside target. First resistance is last-Tuesday's high crossing at 114.000. Second resistance is June's high crossing at 115.000. First support is the 75% retracement level of March's rally crossing at 112.190. Second support is the 87% retracement level of March's rally crossing at 111.243.
ENERGY MARKETS? http://quotes.ino.com/ex?changes/?c=energy ""
August crude oil closed higher on Wednesday as it extends the rally off June's low. The high-range close sets the stage for a steady to higher opening when Thursday's day session begins. Stochastics and the RSI are neutral to bullish signaling that sideways to higher prices are possible near-term. Closes above the 50-day moving average crossing at $73.24 would signal that a short-term low has been posted while opening the door for additional short-term gains. Closes below last-Monday's low crossing at $66.96 would open the door for a possible test of May's low crossing at $63.90. First resistance is the 50-day moving average crossing at $73.24. Second resistance is June's high crossing at $75.70. First support is last-Monday's low crossing at $66.96. Second support is May's low crossing at $64.41.
August heating oil closed higher on Wednesday. The high-range close sets the stage for a steady to higher opening when Thursday's day trading session begins. Stochastics and the RSI are neutral to bullish signaling that sideways to higher prices are possible near-term. If August extends last-week's rally, the 38% retracement level of the 2022-2023 decline crossing at 2.6107 is the next upside target. Closes below last-Monday's low crossing at 2.2876 would signal that a short-term top has been posted. First resistance is the April 24th high crossing at 2.5349. Second resistance is the 38% retracement level of the 2022-2023 decline crossing at 2.6107. First support is last-Monday's low crossing at $2.2876. Second support is the May 31st low crossing at $2.2301.
August unleaded gas closed higher on Wednesday. The high-range close sets the stage for a steady to higher opening when Thursday's day session begins trading. Stochastics and the RSI are overbought and are turning neutral to bearish signaling that sideways to lower prices are possible near-term. Closes below last-Thursday's low crossing at 2.4415 would signal that a short-term top has been posted. If August extends the rally off May's low, the 87% retracement level of the April-May decline crossing at 2.5766 is the next upside target. First resistance last-Friday's high crossing at 2.5905. Second resistance is the 87% retracement level of the April-May decline crossing at 2.6394. First support is last-Monday's low crossing at 2.3901. Second support is June's low crossing at 2.3394.
August Henry natural gas closed higher on Wednesday. The high-range close sets the stage for a steady to higher opening when Thursday's day session begins trading. Stochastics and the RSI are overbought and are turning neutral to bearish signaling that sideways to higher prices are possible near-term. If August extends last-week's rally, the May 19th high crossing at 2.885 is the next upside target. If August renews the decline off March's high, the September-2020 low on the monthly continuation chart crossing at 1.795 is the next downside target.First resistance is Tuesday's high crossing at 2.783. Second resistance is the May 19th high crossing at 2.885. First support is the June 1st low crossing at 2.244. Second support is the September-2020 low on the monthly continuation chart crossing at 1.795.
CURRENCIES? http://quotes.ino.com/ex?changes/?c=currencies ""
The September Dollar closed lower on Wednesday. The low-range close sets the stage for a steady to lower opening when Thursday's session begins trading. Stochastics and the RSI are oversold but remain neutral to bearish signaling that sideways to lower prices are possible near-term. If September extends the decline off May's high, May's low crossing at 100.340 is the next downside target. Closes above the 20-day moving average crossing at 103.010 would signal that a short-term low has been posted. First resistance is the 20-day moving average crossing at 103.010. Second resistance is May's high crossing at 104.205. First support is last-Friday's low crossing at 101.585. Second support is May's low crossing at 100.340.
The September Euro closed higher on Wednesday as it extends the rally off May's low. The high-range close sets the stage for a steady to higher opening when Thursday's day session begins trading. Stochastics and the RSI are overbought but remain neutral to bullish signaling that sideways to higher prices is possible near-term. If September extends the rally off May's low, May's high crossing at 1.11710. Closes below the 20-day moving average crossing at $1.08439 would signal that a short-term top has been posted. First resistance is today's high crossing at $1.10400. Second resistance is May's high crossing at 1.11710. First support is the 20-day moving average crossing at 1.08439. Second support is May's low crossing at $1.07025.
The September British Pound closed higher on Wednesday. The high-range close sets the stage for a steady to higher opening when Thursday's day session begins trading. Stochastics and the RSI are overbought but remain neutral to bullish signaling sideways to higher prices are possible near-term. If September extends the rally off May's low, the 75% retracement level of the 2022-2023 decline crossing at 1.3253 is the next upside target. Closes below the 50-day moving average crossing at 1.2531 is the next downside target. First resistance is last-Friday's high crossing at 1.2863. Second resistance is the 75% retracement level of the 2022-2023 decline crossing at 1.3253. First support is the 50-day moving average crossing at 1.2531. Second support is May's low crossing at 1.2333.
The September Swiss Franc closed higher on Wednesday and above the 50-day moving average crossing at 1.12902. The high-range close sets the stage for a steady to higher opening when Thursday's day session begins trading. Stochastics and the RSI are neutral signaling that sideways to higher prices are possible near-term. If September extends the rally off May's low, May's high crossing at 1.14920 is the next upside target. If September resumes the decline off May's high, the 38% retracement level of 2022-2023 rally crossing at 1.10197 is the next downside target. First resistance is last-Friday's high crossing at 1.13410. Second resistance is May's high crossing at 1.14920. First support is the 38% retracement level of 2022-2023 rally crossing at 1.10197. Second support is the 50% retracement level of 2022-2023 rally crossing at 1.08741.
The September Canadian Dollar closed higher on Wednesday as it extends the rally off May's low. The high-range close sets the stage for a steady to higher opening when Thursday's day session begins trading. Stochastics and the RSI are overbought but remain neutral to bullish signaling that sideways to higher prices are possible near-term. If September extends the rally off May's low, the 38% retracement level of the 2021-2022 decline crossing at 76.28 is the next upside target. Closes below the 20-day moving average crossing at 74.75 would signal that a short-term top has been posted. First resistance is today's high crossing at 76.11. Second resistance is the 38% retracement level of the 2021-2022 decline crossing at 76.28. First support is the 10-day moving average crossing at 75.39. Second support is the 20-day moving average crossing at 74.75.
The September Japanese Yen closed lower on Wednesday as it extends this year's decline. The mid-range close sets the stage for a steady to lower opening when Thursday’s day session begins trading. Stochastics and the RSI are neutral to bearish signaling that sideways to lower prices are possible near-term. If September extends the decline off March's high, the 87% retracement level of the October-January rally crossing at 0.070777 is the next downside target. Closes above the June 1st high crossing at 0.073430 would signal that a short-term low has been posted. First resistance is the 20-day moving average crossing at 0.072619. Second resistance is the June 1st high crossing at 0.073430. First support is today's low crossing at 0.071210. Second support is the 87% retracement level of the October-January rally crossing at 0.070777.
PRECIOUS METALS? http://quotes.ino.com/ex?changes/?c=metals ""
August gold closed slightly lower on Wednesday as it extends the trading range of the past six-weeks. The high-range close sets the stage for a steady to higher opening when Thursday's day session begins trading. Stochastics and the RSI are neutral to bearish signaling that sideways to lower prices are possible near-term. If August renews the decline off May's high, the 50% retracement level of the 2022-2023 rally crossing at $1892.30. Closes above the 20-day moving average crossing at $2007.20 would signal that a short-term low has been posted. First resistance is the June 1st high crossing at $2000.70. Second resistance is the 50-day moving average crossing at $2007.20. First support is the 38% retracement level of the 2022-2023 rally crossing at $1941.90. Second support is the 50% retracement level of the 2022-2023 rally crossing at $1892.30.
July silver closed sharply lower for the second day in a row on Wednesday. The low-range close sets the stage for a steady to lower opening when Thursday's day session begins trading. Stochastics and the RSI are neutral to bearish signaling that sideways to lower prices are possible near-term. If July renews the decline off May's high, the 75% retracement level of the March-May rally crossing at 21.708 is the next downside target. Closes above the 50-day moving average crossing at 24.558 would confirm that a low has been posted. First resistance is the 50-day moving average crossing at 24.558. Second resistance is the May 10th high crossing at 26,200. First support is the 62% retracement level of the March-May rally crossing at 22.546. Second support is the 75% retracement level of the March-May rally crossing at 21.708.
July copper closed higher on Wednesday. The high-range close sets the stage for a steady to higher opening when Thursday's day session begins trading. Stochastics and the RSI are overbought but remain neutral to bullish signaling that sideways to higher prices are possible near-term. If July extends the rally off May's low, the May 8th high crossing at 3.9595 is the next upside target. Closes below the 20-day moving average crossing at 3.7566 would signal that a short-term top has been posted. First resistance is the May 8th high crossing at 3.9595. Second resistance is May's high crossing at 4.0050. First support is the 20-day moving average crossing at 3.7566. Second support is May's low crossing at 3.5450.
GRAINS? http://quotes.ino.com/ex?changes/?c=grains "
September Corn closed up $0.30 1/2-cents at $6.23 1/2.
September corn closed higher on Wednesday as it extends the rally off May's low. The high-range close sets the stage for a steady to higher opening when Thursday's night session begins trading. Stochastics and the RSI are overbought but remain neutral to bullish signaling that sideways to higher prices are possible near-term. If September extends the rally off May's low, the 75% retracement level of the 2022-2023-decline crossing at $6.47 1/2 is the next upside target. Closes below the 20-day moving average crossing at $5.41 would signal that a short-term top has been posted. First resistance is the December 26th high crossing at $6.31 1/4. Second resistance is the 75% retracement level of the 2022-2023 decline crossing at $6.47 1/2. First support is the 10-day moving average crossing at $5.59 1/4. Second support is the 20-day moving average crossing at $5.41.
September wheat closed up $0.39 1/2-cents at $7.48 1/4.
September wheat closed sharply higher for the fourth-day in a row on Wednesday as it extends the rally off May's low. The high-range close sets the stage for a steady to higher opening when Thursday's day session begins trading. Stochastics and the RSI are overbought but remain neutral to bullish signaling signaling that sideways to higher prices are possible near-term. If September extends the rally off May's low, the 38% retracement level of the 2022-2023 crossing at $7.95 1/4 is the next upside target. Closes below the 20-day moving average crossing at $6.46 would signal that a short-term top has been posted. First resistance is today's high crossing at $7.48 3/4. Second resistance is the 38% retracement level of the 2022-2023 crossing at $7.95 1/4. First support is the 10-day moving average crossing at $6.67 1/4. Second support is the 20-day moving average crossing at $6.46.
September Kansas City Wheat closed up $0.37 1/2-cents at $8.72.
September Kansas City wheat closed sharply higher on Wednesday as it extends the rally off the May 31st low. The high-range close sets the stage for a steady to higher opening when Thursday's day session begins trading. Stochastics and the RSI are overbought but remain neutral to bullish signaling that sideways to higher prices are possible near-term. If September extends the aforementioned rally, May's high crossing at $9.02 is the next upside target. Closes below the 20-day moving average crossing at $8.08 1/2 would signal that a short-term top has been posted.First resistance is today's high crossing at $8.75. Second resistance is May's high crossing at $9.02. First support is the May 31st low crossing at $7.61 3/4. Second support is May's low crossing at $7.33.
September Minneapolis wheat closed up $0.29 3/4-cents crossing at $8.81 3/4.
September Minneapolis wheat closed sharply higher on Wednesday. The high-range close sets the stage for a steady to higher opening when Thursday's day session begins trading. Stochastics and the RSI are overbought but remain neutral to bullish signaling that sideways to higher prices are possible near-term. If September extends last-week's rally, May's high crossing at $8.89 1/2 is the next upside target. Closes below the 20-day moving average crossing at $8.17 1/2 would signal that a short-term top has been posted. First resistance is today's high crossing at $8.82 3/4. Second resistance is May's high crossing at $8.89 1/2. First support is the 50-day moving average crossing at $8.30 3/4. Second support is the 20-day moving average crossing at $8.17 1/2.
SOYBEAN COMPLEX? http://quotes.ino.com/ex?changes/?c=grains "
November soybeans closed up $0.34 1/4-cents at $13.77.
November soybeans close sharply higher on Wednesday as it extended the rally off May's low. The high-range close sets the stage for a steady to higher opening when Thursday's day session begins trading. Stochastics and the RSI are overbought but remain neutral to bullish signaling that sideways to higher prices are possible near-term. If November extends the rally off May's low, February's high crossing at $14.02 is the next upside target. Closes below the 10-day moving average crossing at $12.61 1/4 would signal that a short-term top has been posted.First resistance is today's high crossing at $13.78. Second resistance is February's high crossing at $14.02. First support is the 10-day moving average crossing at $12.61 1/4. Second support is the 20-day moving average crossing at $12.18 1/4.
August soybean meal closed up $27.20 at $412.80.
August soybean meal closed sharply higher on Wednesday as it extended the rally off May's low. The high-range close sets the stage for a steady to higher opening when Thursday's day session begins trading. Stochastics and the RSI are neutral to bullish signaling that sideways to higher prices are possible near-term. If August extends today's rally, April's high crossing at $456.00. Closes below the 20-day moving average crossing at $396.80 is the next downside target. First resistance is today's high crossing at $438.90. Second resistance is April's high crossing at $456.00. First support is the 50-day moving average crossing at $414.80. Second support is the 20-day moving average crossing at $396.80.
August soybean oil closed down 400-pts. at 54.73.
August soybean oil closed limit down on Wednesday as it consolidates some of the rally off May's low.The low-range close sets the stage for a steady to lower opening when Thursday's day session begins trading. Stochastics and the RSI are overbought but remain neutral to bullish signaling that sideways to higher prices are possible near-term. If August extends the aforementioned rally, March's high crossing at 61.83 is the next upside target. Closes below the 50-day moving average crossing at 51.68 would signal that a short-term top has been posted. First resistance is last-Friday's high crossing at 60.24. Second resistance is March's high crossing at 61.83. First support is the 10-day moving average crossing at 54.73. Second support is the 50-day moving average crossing at 51.68.
LIVESTOCKhttp://quotes.ino.com/exchanges/?c=livestock
August hogs closed down $0.38 at $92.83.
August hogs closed slightly on Wednesday. The mid-range close sets the stage for a steady to higher opening when Thursday's day session begins trading. Stochastics and the RSI are overbought but remain neutral to bullish signaling that sideways to higher prices are possible near-term. If August extends the rally off May's low, the 62% retracement level of the 2022-2023 decline crossing at $95.45 is the next upside target. Closes below the 20-day moving average crossing at $84.09 would signal that a short-term top has been posted. First resistance is the 62% retracement level of the 2022-2023 decline crossing at $95.45. Second resistance is the 75% retracement level of the 2022-2023 decline crossing at $100.14. First support is the 10-day moving average crossing at $88.10. Second support is the 20-day moving average crossing at $84.09.
August cattle closed down $0.08 at $169.62.
August cattle closed lower on Wednesday. The high-range close sets the stage for a steady to slightly lower opening on Thursday. Stochastics and the RSI are neutral to bearish signaling that sideways to lower prices are possible near-term. If August extends the decline off last-Wednesday's high, the 50-day moving average crossing at $165.59 is the next downside target. If August renews this year's rally unto uncharted territory, upside targets will be hard to project. First resistance is last-Wednesday's high crossing at $174.40. Second resistance is June's high crossing at $178.10. First support is today's low crossing at $168.10. Second support is the 50-day moving average crossing at $165.59.
August Feeder cattle closed down $4.68 at $232.15.
August Feeder cattle gapped below the 50-day moving average crossing at $231.69 thereby open the door for a possible test of May's low crossing at $221.15. The low-range close sets the stage for a steady to lower opening when Thursday's day session begins trading. Stochastics and the RSI are oversold but remain neutral to bearish signaling that sideways to higher prices are possible near-term. Closes above the 20-day moving average crossing at $237.19 would signal that a short-term low has been posted. First resistance is last-Wednesday's high crossing at $241.90. Second resistance is June's high crossing at $245.18. First support is today's low crossing at $226.70. Second support is May's low crossing at $221.15.
FOOD & FIBERhttp://quotes.ino.com/ex changes/?c=food
September coffee closed sharply lower on Wednesday as it extends the decline off June's high. The low-range close sets the stage for a steady to lower opening on Thursday. Stochastics and the RSI are neutral to bearish signaling sideways to lower prices are possible near-term. If September extends the decline off June's high, March's low crossing at $16.44 is the next downside target. Closes above last-Friday's high crossing at $18.42 would signal that a short-term low has been posted. First resistance is last-Friday's high crossing at $18.42. Second resistance is June's high crossing at $19.17. First support is today's low crossing at $17.06. Second support is March's low crossing at $16.44.
September cocoa closed higher on Wednesday. The high-range close sets the stage for a steady to higher opening on Thursday. Stochastics and the RSI are overbought but remain neutral to bullish signaling that sideways to higher prices are possible near-term. If September extends the rally off March's low, monthly resistance crossing at 34.29 is the next upside target. Closes below the 20-day moving average crossing at 31.07 would signal that a short-term top has been posted.
October sugar closed slightly lower on Wednesday, The low-range close sets the stage for a steady to lower opening on Thursday. Stochastics and the RSI are overbought but remain neutral to bullish signaling that sideways to higher prices are possible near-term. If October extends this month's rally, the May 11th high crossing at 26.39 is the next upside target. Closes below last-Tuesday's low crossing at 24.69 would signal that a short-term top has been posted while opening the door for a possible test of June's low crossing at 24.01.
December cotton posted an inside day with a lower close on Wednesday. The mid-range close sets the stage for a steady to lower opening on Thursday. Stochastics and the RSI are turning neutral to bullish signaling sideways to higher prices are possible near-term. Closes above the 50-day moving average crossing at 81.39 would signal that a low has been posted. If December extends last-week's decline, the May 25th low crossing at 78.45 is the next upside target.
Thanks tallpine!
As mentioned several times recently, this is NOT a dome of death type blocking pattern like most other long lasting droughts in the Summer.
It's an extremely odd pattern that has lasted much longer than expected and probably related to the very warm temps in the Atlantic Ocean.
Regardless, odds are pretty high that it will be breaking down in early July.
If that's the case, we may be at or close to the highs right now.
It's weather and I've been really wrong hundreds of times the last 40 years and will adjust that based on the latest information.
I'm not suggesting selling but that's the set up right now.
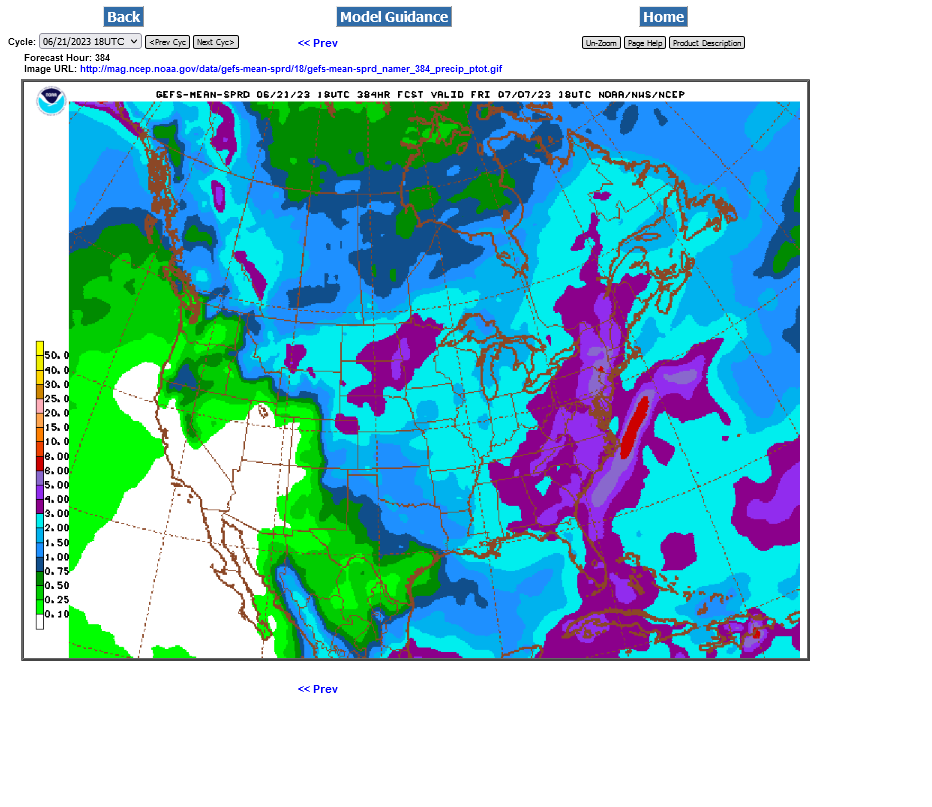
The models are turning wetter right now. If they verify, its over for the grains but earlier this month, the same thing looked likely.
If they turn drier again (possible) you DON'T want to be short.........we can go much MUCH higher.
This was the 2 week rain map from the last 18z GEFS.
C and S had a spike lower at the open, probably from this.
We need the EE to get wetter than it is and match the GEFS(which has been too wet and not as good) but it also added rain this afternoon.