KEY EVENTS TO WATCH FOR:
Monday, June 19, 2023
10:00 AM ET. June NAHB Housing Market Index
Housing Mkt Idx (previous 50)
N/A U.S.: Juneteenth. Financial markets closed
The STOCK INDEXES? http://quotes.ino.com/ex?changes/?c=indexes
The Dow closed lower on Friday due to profit taking ahead of the three-day weekend. The low-range close sets the stage for a steady to lower opening when Tuesday's day session begins trading. Stochastics and the RSI are overbought but remain neutral to bullish signaling that sideways to higher prices are possible near-term. If the Dow extends the rally off May's low, the December-2022 high crossing at 34,712.28 is the next upside target. Closes below the 20-day moving average crossing at 33,533.92 would signal that a short-term top has been posted. First resistance is today's high crossing at 34,588.68. Second resistance is the December-2022 high crossing at 34,712.28. First support is the 10-day moving average crossing at 33,947.65. Second support is the 20-day moving average crossing at 33,533.92.
The September NASDAQ 100 closed lower on Friday as it consolidates some of the rally off last-December's low. The low-range close sets the stage for a steady to lower opening when Tuesday's night session begins trading. Stochastics and the RSI are overbought but remain neutral to bullish signaling sideways to higher prices are possible. If September extends this year's rally, the 87% retracement level of the 2021-2022-decline on the weekly continuation chart crossing at 15,957.86 is the next upside target. Closes below the 20-day moving average crossing at 14,615.61 would signal that a short-term top has been posted. First resistance is today's high crossing at 15,475.50. Second resistance is the 87% retracement level of the 2020-2022-decline on the weekly continuation chart crossing at 15,957.86. First support is the 20-day moving average crossing at 14,615.61. Second support is the 50-day moving average crossing at 13,875.51.
The September S&P 500 closed slightly lower on Friday. The low-range close sets the stage for a steady to lower opening when Tuesday's night session begins trading. Stochastics and the RSI are overbought but remain neutral to bullish signaling that sideways to higher prices are possible near-term. If September extends the rally off March's low, the 75% retracement level of the 2022 decline on the weekly chart crossing at 4505.40 is the next upside target. Closes below the 20-day moving average crossing at 4311.64 would signal that a short-term top has been posted. First resistance is today's high crossing at 4493.75. Second resistance is the 75% retracement level of the 2022 decline on the weekly chart crossing at 4505.40. First support is the 10-day moving average crossing at 4383.05. Second support is the 20-day moving average crossing at 4311.64.
INTEREST RATES? http://quotes.ino.com/ex?changes/?c=interest ""
September T-bonds closed down 13/32's at 127-12.
September T-bonds posted an inside day with a lower close on Friday. The mid-range close sets the stage for a steady to lower opening when Tuesday's day session begins trading. Stochastics and the RSI are neutral to bullish signaling that sideways to higher prices are possible near-term. Closes above last-Wednesday's high crossing at 128-16 would confirm that a short-term low has been posted while opening the door for additional gains near-term. If September renews the decline off April's high, the 87% retracement level of the March-April rally crossing at 124-19 is the next downside target. First resistance is last-Wednesday's high crossing at 128-16. Second resistance is the June 1st high crossing at 129-16. First support is the 75% retracement level of the March-April rally crossing at 125-30. Second support is the 87% retracement level of the March- April rally crossing at 124-19.
September T-notes closed down 130-pts. At 113.020.
September T-notes closed lower on Friday. The low-range close sets the stage for a steady to lower opening when Tuesday's day session begins trading. Stochastics and the RSI are turning neutral to bullish signaling that sideways to higher prices are possible near-term. Closes above the 20-day moving average crossing at 113.229 would signal that a short-term low has been posted. If September extends the decline off May's high, the 87% retracement level of March's rally crossing at 111.243 is the next downside target. First resistance is the 20-day moving average crossing at 113.229. Second resistance is June's high crossing at 115.000. First support is the 75% retracement level of March's rally crossing at 112.190. Second support is the 87% retracement level of March's rally crossing at 111.243.
ENERGY MARKETS? http://quotes.ino.com/ex?changes/?c=energy ""
August crude oil closed higher on Friday as it consolidated some of the decline off June's high. The high-range close sets the stage for a steady to higher opening when Tuesday's day session begins. Stochastics and the RSI have turned neutral to bullish signaling that sideways to higher prices are possible near-term. Closes above last-Thursday's high crossing at $73.37 would signal that a short-term low has been posted while opening the door for additional short-term gains. Closes below Monday's low crossing at $66.96 would open the door for a possible test of May's low crossing at $63.90. First resistance is June's high crossing at $75.70. Second resistance is the April 28th high crossing at $76.35. First support is Monday's low crossing at $66.96. Second support is May's low crossing at $64.41.
August heating oil closed higher on Friday as it extends Thursday's breakout above the 50-day moving average crossing at 2.4094 to confirm an upside breakout of the May-June trading range. The high-range close sets the stage for a steady to higher opening when Tuesday's day trading session begins. Stochastics and the RSI are neutral to bullish signaling that sideways to higher prices are possible near-term. If August extends this week's rally, the 38% retracement level of the 2022-2023 decline crossing at 2.6107 is the next upside target. Closes below Monday's low crossing at $2.2876 would signal that a short-term top has been posted. First resistance is the April 24th high crossing at 2.5349. Second resistance is the 38% retracement level of the 2022-2023 decline crossing at 2.6107. First support is Monday's low crossing at $2.2876. Second support is the May 31st low crossing at $2.2301.
August unleaded gas closed higher on Friday as it extended the rally off May's low. The high-range close sets the stage for a steady to higher opening when Tuesday's day session begins trading. Stochastics and the RSI are neutral to bullish signaling that sideways to higher prices are possible near-term. If August extends the rally off May's low, the 87% retracement level of the April-May decline crossing at 2.5766 is the next upside target. Closes below Thursday's low crossing at 2.4415 would signal that a short-term top has been posted. First resistance today's high crossing at 2.5905. Second resistance is the 87% retracement level of the April-May decline crossing at 2.6394. First support is Monday's low crossing at 2.3901. Second support is the June low crossing at 2.3394.
August Henry natural gas closed higher on Friday as it extends this week's rally. The high-range close sets the stage for a steady to higher opening when Tuesday's day session begins trading. Stochastics and the RSI are neutral to bullish signaling that sideways to higher prices are possible near-term. If August extends this week's rally, the May 19th high crossing at 2.885 is the next upside target. If August renews the decline off March's high, the September-2020 low on the monthly continuation chart crossing at 1.795 is the next downside target.First resistance is today's high crossing at 2.733. Second resistance is the May 19th high crossing at 2.885. First support is the June 1st low crossing at 2.244. Second support is the September-2020 low on the monthly continuation chart crossing at 1.795.
CURRENCIES? http://quotes.ino.com/ex?changes/?c=currencies ""
The September Dollar closed slightly higher on Friday but remains below the 50-day moving average crossing at 102.093. The high-range close sets the stage for a steady to higher opening when Tuesday's session begins trading. Stochastics and the RSI are oversold but remain neutral to bearish signaling that sideways to lower prices are possible near-term. If September extends the decline off May's high, May's low crossing at 100.340 is the next downside target. Closes above the 20-day moving average crossing at 103.186 would signal that a short-term low has been posted. First resistance is the 20-day moving average crossing at 103.186. Second resistance is May's high crossing at 104.205. First support is today's low crossing at 101.585. Second support is May's low crossing at 100.340.
The September Euro closed slightly lower on Friday as it consolidates some of the rally off May's low. The mid-range close sets the stage for a steady to lower opening when Tuesday's day session begins trading. Stochastics and the RSI are overbought but remain neutral to bullish signaling that sideways to higher prices is possible near-term. If September extends the rally off May's low, May's high crossing at 1.11710. Closes below the 20-day moving average crossing at $1.08318 would signal that a short-term top has been posted. First resistance is today's high crossing at $1.10225. Second resistance is May's high crossing at 1.11710. First support is the 20-day moving average crossing at 1.08318. Second support is May's low crossing at $1.07025.
The September British Pound closed higher on Friday as it extends the rally off May's low. The high-range close sets the stage for a steady to higher opening when Tuesday's day session begins trading. Stochastics and the RSI are overbought but remain neutral to bullish signaling sideways to higher prices are possible near-term. If September extends the rally off May's low, the 75% retracement level of the 2022-2023 decline crossing at 1.3253 is the next upside target. Closes below the 50-day moving average crossing at 1.2518 is the next downside target. First resistance is today's high crossing at 1.2863. Second resistance is the 75% retracement level of the 2022-2023 decline crossing at 1.3253. First support is the 50-day moving average crossing at 1.2518. Second support is May's low crossing at 1.2333.
The September Swiss Franc closed lower on Friday but remains above the 50-day moving average crossing at 1.12879 signals that a short-term low has been posted. The low-range close sets the stage for a steady to lower opening when Tuesday's day session begins trading. Stochastics and the RSI are overbought but remain neutral to bullish signaling that sideways to higher prices are possible near-term. If September extends this month's rally, May's high crossing at 1.14920 is the next upside target. If September resumes the decline off May's high, the 38% retracement level of 2022-2023 rally crossing at 1.10197 is the next downside target. First resistance is today's high crossing at 1.13410. Second resistance is May's high crossing at 1.14920. First support is the 38% retracement level of 2022-2023 rally crossing at 1.10197. Second support is the 50% retracement level of 2022-2023 rally crossing at 1.08741.
The September Canadian Dollar closed higher on Friday as it extends the rally off May's low. The high-range close sets the stage for a steady to higher opening when Tuesday's day session begins trading. Stochastics and the RSI are overbought but remain neutral to bullish signaling that sideways to higher prices are possible near-term. If September extends the rally off May's low, the 38% retracement level of the 2021-2022 decline crossing at 76.28 is the next upside target. Closes below the 50-day moving average crossing at 74.44 would signal that a short-term top has been posted. First resistance is today's high crossing at 75.99. Second resistance is the 38% retracement level of the 2021-2022 decline crossing at 76.28. First support is the 10-day moving average crossing at 75.14. Second support is the 50-day moving average crossing at 74.44.
The September Japanese Yen closed lower on Friday and closed below the lower boundary of the trading range crossing at 0.072215. The low-range close sets the stage for a steady to lower opening when Tuesday’s day session begins trading. Stochastics and the RSI are turning neutral to bearish signaling that sideways to lower prices are possible near-term. If September extends the decline off March's high, the 87% retracement level of the October-January rally crossing at 0.070777 is the next downside target. Closes above the June 1st high crossing at 0.073430 would signal that a short-term low has been posted. First resistance is the June 1st high crossing at 0.073430. Second resistance is the 50-day moving average crossing at 0.074595. First support is the 75% retracement level of the October-January rally crossing at 0.072174. Second support is the 87% retracement level of the October-January rally crossing at 0.070777.
PRECIOUS METALS? http://quotes.ino.com/ex?changes/?c=metals ""
August gold closed slightly higher on Friday as it extends the trading range of the past five-weeks. The low-range close sets the stage for a steady to slightly higher opening when Tuesday's day session begins trading. Stochastics and the RSI are neutral to bullish signaling that sideways to higher prices are possible near-term. Closes above the 50-day moving average crossing at $2010.70 would signal that a short-term low has been posted. If August renews the decline off May's high, the 50% retracement level of the 2022-2023 rally crossing at $1892.30. First resistance is the June 1st high crossing at $2000.70. Second resistance is the 50-day moving average crossing at $2010.70. First support is the 38% retracement level of the 2022-2023 rally crossing at $1941.90. Second support is the 50% retracement level of the 2022-2023 rally crossing at $1892.30.
July silver closed higher on Friday. The high-range close sets the stage for a steady to higher opening when Tuesday's day session begins trading. Stochastics and the RSI are neutral to bullish signaling that sideways to higher prices are possible near-term. Closes above the 50-day moving average crossing at 24.648 would open the door for additional strength near-term. If July renews the decline off May's high, the 62% retracement level of the March-May rally crossing at 22.546 is the next downside target. First resistance is last-Friday's high crossing at 24.620. Second resistance is the 50-day moving average crossing at 24.648. First support is the 62% retracement level of the March-May rally crossing at 22.546. Second support is the 75% retracement level of the March-May rally crossing at 21.708.
July copper closed lower on Friday as it consolidates some of the rally off May's low. The low-range close sets the stage for a steady to lower opening when Tuesday's day session begins trading. Stochastics and the RSI are overbought but remain neutral to bullish signaling that sideways to higher prices are possible near-term. If July extends the rally off May's low, the May 8th high crossing at 3.9595 is the next upside target. Closes below the 20-day moving average crossing at 3.7379 would signal that a short-term top has been posted. First resistance is the May 8th high crossing at 3.9595. Second resistance is May's high crossing at 4.0050. First support is the 20-day moving average crossing at 3.7379. Second support is May's low crossing at 3.5450.
GRAINS? http://quotes.ino.com/ex?changes/?c=grains "
September Corn closed up $0.24-cents at $5.94.
September corn closed sharply higher for the second day in a row on Friday as it extends the rally off May's low. The high-range close sets the stage for a steady to higher opening when Tuesday's night session begins trading. Stochastics and the RSI are overbought but remain neutral to bullish signaling that sideways to higher prices are possible near-term. If September extends the rally off May's low, the February 13th high crossing at $6.13 3/4 is the next upside target. Closes below Tuesday's low crossing at $5.37 1/2 would signal that a short-term top has been posted. First resistance is the 50% retracement level of the 2022-2023 decline crossing at $5.93 3/4. Second resistance is the February 13th high crossing at $6.13 3/4. First support is the 10-day moving average crossing at $5.44. Second support is Tuesday's low crossing at $5.37 1/2.
September wheat closed up $0.28 3/4-cents at $7.01 1/2.
September wheat closed sharply higher for the second day in a row on Friday as it extends the rally off May's low. The high-range close sets the stage for a steady to higher opening when Tuesday's day session begins trading. Stochastics and the RSI are overbought but remain neutral to bullish signaling signaling that sideways to higher prices are possible near-term. If September extends the rally off May's low, the April 18th high crossing at $7.26 3/4 is the next upside target. Closes below the 20-day moving average crossing at $6.34 3/4 would signal that a short-term top has been posted. First resistance is the April 18th high crossing at $7.26 3/4. Second resistance is March's high crossing at $7.46. First support is the 50-day moving average crossing at $6.55. Second support is the 20-day moving average crossing at $6.34 3/4.
September Kansas City Wheat closed up $0.30 1/4-cents at $8.39.
September Kansas City wheat closed sharply higher on Friday. The high-range close sets the stage for a steady to higher opening when Tuesday's day session begins trading. Stochastics and the RSI have turned neutral to bullish signaling that sideways to higher prices are possible near-term. Closes above the June 6th high crossing at $8.41 would extend the rally off May's low. If September renews the decline off June's high, the May 31st low crossing at $7.61 3/4 is the next downside target. First resistance is the June 6th high crossing at $8.41. Second resistance is May's high crossing at $9.02. First support is the May 31st low crossing at $7.61 3/4. Second support is May's low crossing at $7.33.
September Minneapolis wheat closed up $0.23-cents crossing at $8.56 1/2.
September Minneapolis wheat closed sharply higher for the second day in a row on Friday as it renewed the rally off the May 31st low. The high-range close sets the stage for a steady to higher opening when Tuesday's day session begins trading. Stochastics and the RSI are neutral to bullish signaling that sideways to higher prices are possible near-term. If September extends today's rally, May's high crossing at $8.89 1/2 is the next upside target. Closes below Wednesday's low crossing at $8.01 1/4 would signal that a short-term top has been posted. First resistance is today's high crossing at $8.63 1/4. Second resistance is May's high crossing at $8.89 1/2. First support is Wednesday's low crossing at $8.01 1/.4 Second support is the May 31st low crossing at $7.78 1/4.
SOYBEAN COMPLEX? http://quotes.ino.com/ex?changes/?c=grains "
November soybeans closed up $0.50-cents at $13.42 1/2.
November soybeans close sharply higher for the second day in a row on Friday as it extends the rally off May's low. The high-range close sets the stage for a steady to higher opening when Tuesday's day session begins trading. Stochastics and the RSI are overbought but remain neutral to bullish signaling that sideways to higher prices are possible near-term. If November extends the rally off May's low, March's high crossing at $13.86 1/2 is the next upside target. Closes below the 50-day moving average crossing at $12.43 would signal that a short-term top has been posted. First resistance is today's high crossing at $13.47 1/4. Second resistance is March's high crossing at $13.86 1/2. First support is the 50-day moving average crossing at $12.43. Second support is the 10-day moving average crossing at $12.25 1/2.
July soybean meal closed up $22.20 at $416.40.
July soybean meal closed sharply higher on Friday. The high-range close sets the stage for a steady to higher opening when Tuesday's day session begins trading. Stochastics and the RSI have turned neutral to bullish signaling that sideways to higher prices are possible near-term. If July extends today's rally, the 50-day moving average crossing at $422.60 is the next upside target. If July renews the decline off March's high, the 62% retracement level of the 2020-2023 rally crossing at $365.60 is the next downside target. First resistance is today's high crossing at $417.00. Second resistance is the 50-day moving average crossing at $422.60. First support is May's low crossing at $386.30. Second support is the 62% retracement level of the 2020-2023 rally crossing at $365.60.
July soybean oil closed up 126-pts. at 59.69.
July soybean oil closed higher on Friday as it extended the rally off May's low.The high-range close sets the stage for a steady to higher opening when Tuesday's day session begins trading. Stochastics and the RSI are overbought but remain neutral to bullish signaling that sideways to higher prices are possible near-term. If July extends the aforementioned rally, March's high crossing at 61.83 is the next upside target. Closes below the 50-day moving average crossing at 51.86 would signal that a short-term top has been posted. First resistance is today's high crossing at 60.24. Second resistance is March's high crossing at 61.83. First support is the 10-day moving average crossing at 54.11. Second support is the 50-day moving average crossing at 51.86.
LIVESTOCKhttp://quotes.ino.com/exchanges/?c=livestock
August hogs closed up $0.25 at $90.55.
August hogs closed higher on Friday as it extends the rally off May's low. The mid-range close sets the stage for a steady to higher opening when Tuesday's day session begins trading. Stochastics and the RSI are overbought but remain neutral to bullish signaling that sideways to higher prices are possible near-term. If August extends the rally off May's low, the 62% retracement level of the 2022-2023 decline crossing at $95.45 is the next upside target. Closes below the 20-day moving average crossing at $82.88 would signal that a short-term top has been posted. First resistance is the 50% retracement level of the 2022-2023 decline crossing at $91.25. Second resistance is the 62% retracement level of the 2022-2023 decline crossing at $95.45. First support is the 10-day moving average crossing at $86.89. Second support is the 20-day moving average crossing at $82.88.
August cattle closed up $0.68 at $171.75.
August cattle closed higher on Friday. The mid-range close sets the stage for a steady to higher opening on Tuesday. Stochastics and the RSI are neutral to bearish signaling that sideways to lower prices are possible near-term. If August extends the decline off last-Wednesday's high, the 20-day moving average crossing at $169.58 is the next downside target. If August renews this year's rally unto uncharted territory, upside targets will be hard to project. First resistance is Wednesday's high crossing at $174.40. Second resistance is last-Wednesday's high crossing at $178.10. First support is Thursday's low crossing at $169.65. Second support is the 20-day moving average crossing at $169.58.
August Feeder cattle closed up $0.38 at $234.50.
August Feeder cattle closed higher on Friday and filled Thursday's gap crossing at $235.55. The mid-range close sets the stage for a steady to higher opening when Monday's day session begins trading. Stochastics and the RSI are oversold but remain neutral to bearish signaling that sideways to higher prices are possible near-term. If August extends this month's decline, the 50-day moving average crossing at $231.40 is the next downside target. Closes above Wednesday's high crossing at $241.90 would signal that a short-term low has been posted. First resistance is Wednesday's high crossing at $241.90. Second resistance is last-Wednesday's high crossing at $245.18. First support is the 50-day moving average crossing at $231.40. Second support is May's low crossing at $221.15.
FOOD & FIBERhttp://quotes.ino.com/ex changes/?c=food
September coffee closed lower on Friday. The low-range close sets the stage for a steady to lower opening on Tuesday. Stochastics and the RSI are neutral to bullish signaling sideways to higher prices are possible near-term. Closes above last-Friday's high crossing at $19.18 would open the door for a possible test of April's high crossing at $20.18. If September renews the decline off last-Friday's high, May's low crossing at $17.32 is the next downside target. First resistance is last-Friday's high crossing at $19.18. Second resistance is April's high crossing at $19.64. First support is May's low crossing at $17.32. Second support is March's low crossing at $16.44.
September cocoa posted an inside day with a lower close on Friday. The mid-range close sets the stage for a steady to lower opening on Tuesday. Stochastics and the RSI are overbought but remain neutral to bullish signaling that sideways to higher prices are possible near-term. If September extends the rally off March's low, monthly resistance crossing at 34.29 is the next upside target. Closes below the 20-day moving average crossing at 30.90 would signal that a short-term top has been posted.
October sugar closed higher on Friday, The high-range close sets the stage for a steady to higher opening on Monday. Stochastics and the RSI are neutral to bullish signaling that sideways to higher prices are possible near-term. If October extends this weeks rally, the May 11th high crossing at 26.39 is the next upside target. Closes below Tuesday's low crossing at 24.69 would signal that a short-term top has been posted while opening the door for a possible test of June's low crossing at 24.01.
December cotton closed higher on Friday. The mid-range close sets the stage for a steady to higher opening on Tuesday. Stochastics and the RSI are neutral to bearish signaling sideways to lower prices are possible near-term. If December extends this week's decline, the May 25th low crossing at 78.45 is the next upside target. Closes above the 50-day moving average crossing at 81.48 would signal that a low has been posted.
Thanks tallpine!
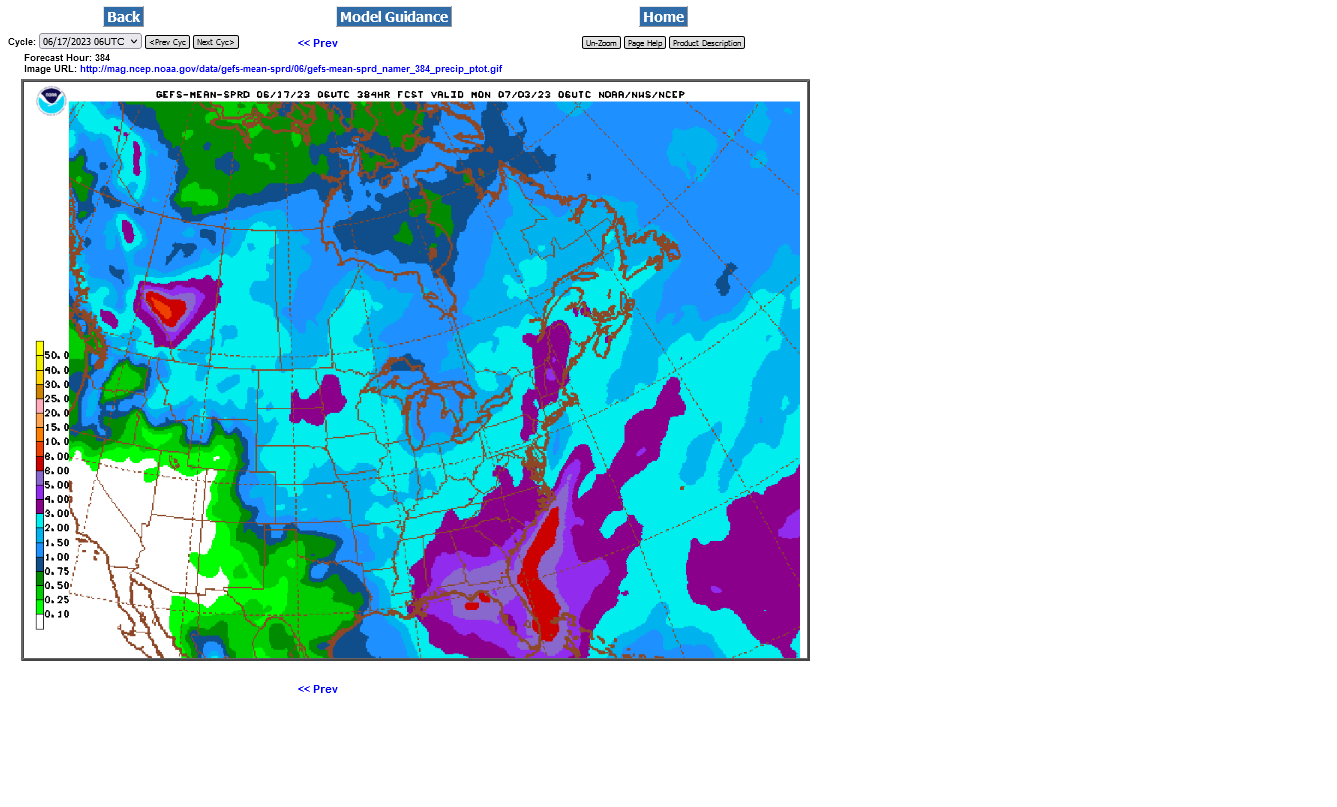
The models were initially all staying pretty dry in the ECB yesterday evening/overnight..then the just updated 6z GEFS came out...........which is the 1st one to finally break thru this block with the El Nino jet/moisture.
It's just one solution. It's either on to something or being misled. Markets are closed for the next 60 hours so this means nothing. Unless you're aggressively long, then its a reason to start sheeting your pants worrying. Been there done that but not this time.
Anyway, it might be wrong and grains still have tremendous upside in that case.