KEY EVENTS TO WATCH FOR:
Friday, June 16, 2023
10:00 AM ET. June University of Michigan Survey of Consumers - preliminary
Mid-Mo Sentiment (expected 60.2; previous 57.7)
Mid-Mo Expectations (previous 53.4)
Mid-Mo Current Idx (previous 64.5)
10:00 AM ET. May State Employment and Unemployment
Monday, June 19, 2023
10:00 AM ET. June NAHB Housing Market Index
Housing Mkt Idx (previous 50)
N/A U.S.: Juneteenth. Financial markets closed
The STOCK INDEXES? http://quotes.ino.com/ex?changes/?c=indexes
The Dow closed sharply higher on Thursday after investors digested the latest-economic data, which showed the economy continues to perform better than feared, particularly when it comes to consumer spending. The high-range close sets the stage for a steady to higher opening when Friday's day session begins trading. Stochastics and the RSI are overbought but remain neutral to bullish signaling that sideways to higher prices are possible near-term. If the Dow extends the rally off May's low, the December-2022 high crossing at 34,712.28 is the next upside target. Closes below the 20-day moving average crossing at 33,495.63 would signal that a short-term top has been posted. First resistance is today's high crossing at 34,411.11. Second resistance is the December-2022 high crossing at 34,712.28. First support is the 10-day moving average crossing at 33,893.42. Second support is the 20-day moving average crossing at 33,495.63.
The September NASDAQ 100 closed higher on Thursday as it extends the rally off last-December's low. The high-range close sets the stage for a steady to higher opening when Friday's day session begins trading. Stochastics and the RSI are overbought but remain neutral to bullish signaling sideways to higher prices are possible. If September extends this year's rally, the 87% retracement level of the 2021-2022-decline on the weekly continuation chart crossing at 15,957.86 is the next upside target. Closes below the 20-day moving average crossing at 14,550.05 would signal that a short-term top has been posted. First resistance is today's high crossing at 15,372.00. Second resistance is the 87% retracement level of the 2020-2022-decline on the weekly continuation chart crossing at 15,957.86. First support is the 20-day moving average crossing at 14,550.00. Second support is the 50-day moving average crossing at 13,832.60.
The September S&P 500 closed higher on Thursday as it extends the rally off March's low. The high-range close sets the stage for a steady to higher opening when Friday's day session begins trading. Stochastics and the RSI are overbought but remain neutral to bullish signaling that sideways to higher prices are possible near-term. If September extends the rally off March's low, the 75% retracement level of the 2022 decline on the weekly chart crossing at 4505.40 is the next upside target. Closes below the 20-day moving average crossing at 4300.70 would signal that a short-term top has been posted. First resistance is today's high crossing at 4471.50. Second resistance is the 75% retracement level of the 2022 decline on the weekly chart crossing at 4505.40. First support is the 10-day moving average crossing at 4368.92. Second support is the 20-day moving average crossing at 4300.
INTEREST RATES? http://quotes.ino.com/ex?changes/?c=interest ""
September T-bonds closed up 28/32's at 127-28.
September T-bonds closed higher on Thursday. The high-range close sets the stage for a steady to higher opening when Friday's day session begins trading. Stochastics and the RSI are turning neutral to bullish signaling that sideways to higher prices are possible near-term. Closes above last-Wednesday's high crossing at 128-16 would confirm that a short-term low has been posted while opening the door for additional gains near-term. If September renews the decline off April's high, the 87% retracement level of the March-April rally crossing at 124-19 is the next downside target. First resistance is last-Wednesday's high crossing at 128-16. Second resistance is the June 1st high crossing at 129-16. First support is the 75% retracement level of the March-April rally crossing at 125-30. Second support is the 87% retracement level of the March- April rally crossing at 124-19.
September T-notes closed up 205-pts. At 113.165.
September T-notes closed higher on Thursday. The high-range close sets the stage for a steady to higher opening when Friday's day session begins trading. Stochastics and the RSI are oversold but are turning neutral to bullish signaling that sideways to higher prices are possible near-term. Closes above the 20-day moving average crossing at 113.256 would signal that a short-term low has been posted. If September extends the decline off May's high, the 87% retracement level of March's rally crossing at 111.243 is the next downside target. First resistance is the 20-day moving average crossing at 113.256. Second resistance is June's high crossing at 115.000. First support is the 75% retracement level of March's rally crossing at 112.190. Second support is the 87% retracement level of March's rally crossing at 111.243.
ENERGY MARKETS? http://quotes.ino.com/ex?changes/?c=energy ""
August crude oil closed sharply higher on Thursday as it consolidated some of the decline off June's high. The high-range close sets the stage for a steady to higher opening when Friday's day session begins. Stochastics and the RSI are turning neutral to bullish signaling that sideways to higher prices are possible near-term. Closes above last-Thursday's high crossing at $73.37 would signal that a short-term low has been posted while opening the door for additional short-term gains. Closes below Monday's low crossing at $66.96 would open the door for a possible test of May's low crossing at $63.90. First resistance is last-Monday's high crossing at $75.70. Second resistance is the April 28th high crossing at $76.35. First support is Monday's low crossing at $66.96. Second support is May's low crossing at $64.41.
August heating oil closed sharply higher on Thursday and above the 50-day moving average crossing at 2.4126 marking an upside breakout of the May-June trading range. The high-range close sets the stage for a steady to higher opening when Friday's day trading session begins. Stochastics and the RSI are neutral to bullish signaling that sideways to higher prices are possible near-term. Closes below Monday's low crossing at $2.2876 would signal that a short-term top has been posted while opening the door for a possible test of the May 31st low crossing at $2.2301. First resistance is the 50-day moving average crossing at 2.4126. Second resistance is the April 24th high crossing at $2.5349. First support is the May 31st low crossing at $2.2301. Second support is May's low crossing at $2.1644.
August unleaded gas closed sharply higher on Thursday. The high-range close sets the stage for a steady to higher opening when Friday's day session begins trading. Stochastics and the RSI have turned neutral to bullish signaling that sideways to higher prices are possible near-term. If August renews the rally off May's low, the 87% retracement level of the April-May decline crossing at 2.5766 is the next upside target. If August extends Monday's decline, the June 1st low crossing at 2.3394 is the next downside target. First resistance last-Thursday's high crossing at 2.5715. Second resistance is the 87% retracement level of the April-May decline crossing at 2.5766. First support is Monday's low crossing at 2.3901. Second support is the June low crossing at 2.3394.
August Henry natural gas closed sharply higher on Thursday and above the 50-day moving average crossing at 2.539 signaling that a short-term low has been posted. The high-range close sets the stage for a steady to higher opening when Friday's day session begins trading. Stochastics and the RSI are neutral to bullish signaling that sideways to higher prices are possible near-term. If August extends today's rally, the May 19th high crossing at 2.885 is the next upside target. If August renews the decline off March's high, the September-2020 low on the monthly continuation chart crossing at 1.795 is the next downside target.First resistance is today's high crossing at 2.639. Second resistance is the May 19th high crossing at 2.885. First support is the June 1st low crossing at 2.244. Second support is the September-2020 low on the monthly continuation chart crossing at 1.795.
CURRENCIES? http://quotes.ino.com/ex?changes/?c=currencies ""
The September Dollar closed sharply lower on Thursday and below the 50-day moving average crossing at 102.081 thereby opening the door for additional weakness near-term. The low-range close sets the stage for a steady to lower opening when Friday's session begins trading. Stochastics and the RSI are oversold but remain neutral to bearish signaling that sideways to lower prices are possible near-term. If September extends the decline off May's high, May's low crossing at 100.340 is the next downside target. Closes above the 20-day moving average crossing at 103.228 would signal that a short-term low has been posted. First resistance is the 20-day moving average crossing at 103.228. Second resistance is May's high crossing at 104.205. First support is today's low crossing at 101.710. Second support is May's low crossing at 100.340.
The September Euro closed sharply higher on Thursday as it extended the rally off May's low. The high-range close sets the stage for a steady to higher opening when Friday's day session begins trading. Stochastics and the RSI are overbought but remain neutral to bullish signaling that sideways to higher prices is possible near-term. Today's close above the 50-day moving average crossing at $1.09569 opens the door for additional gains and a possible test of May's high crossing at 1.11710. Closes below the 20-day moving average crossing at $1.08239 would signal that a short-term top has been posted. First resistance is today's high crossing at $1.10035. Second resistance is May's high crossing at 1.11710. First support is the 20-day moving average crossing at 1.08239. Second support is May's low crossing at $1.07025.
The September British Pound closed higher on Thursday as it extends the rally off May's low. The high-range close sets the stage for a steady to higher opening when Friday's day session begins trading. Stochastics and the RSI are overbought but remain neutral to bullish signaling sideways to higher prices are possible near-term. If September extends the rally off May's low, the 75% retracement level of the 2022-2023 decline crossing at 1.3253 is the next upside target. Closes below the 20-day moving average crossing at 1.2498 is the next downside target. First resistance is today's high crossing at 1.2799. Second resistance is the 75% retracement level of the 2022-2023 decline crossing at 1.3253. First support is the 20-day moving average crossing at 1.2498. Second support is May's low crossing at 1.2333.
The September Swiss Franc closed sharply higher on Thursday and closedabove the 50-day moving average crossing at 1.12869 signals that a short-term low has been posted. The high-range close sets the stage for a steady to higher opening when Friday's day session begins trading. Stochastics and the RSI are neutral to bullish signaling that sideways to higher prices are possible near-term. If September extends this month's rally, May's high crossing at 1.14920 is the next upside target. If September resumes the decline off May's high, the 38% retracement level of 2022-2023 rally crossing at 1.10197 is the next downside target. First resistance is today's high crossing at 1.13335. Second resistance is May's high crossing at 1.14920. First support is the 38% retracement level of 2022-2023 rally crossing at 1.10197. Second support is the 50% retracement level of 2022-2023 rally crossing at 1.08741.
The September Canadian Dollar closed sharply higher on Thursday as it extends the rally off May's low. The high-range close sets the stage for a steady to higher opening when Friday's day session begins trading. Stochastics and the RSI are overbought but remain neutral to bullish signaling that sideways to higher prices are possible near-term. If September extends the rally off May's low, the November 11th -2022 high crossing at 75.91 is the next upside target. Closes below the 50-day moving average crossing at 74.41 would signal that a short-term top has been posted. First resistance is today's high crossing at 75.82. Second resistance is the November-2022 high crossing at 75.91. First support is the 10-day moving average crossing at 74.01. Second support is the 50-day moving average crossing at 74.41.
The September Japanese Yen closed lower on Thursday and spiked below the lower boundary of the trading range crossing at 0.072215. The high-range close sets the stage for a steady to slightly lower opening when Friday’s day session begins trading. Stochastics and the RSI are neutral signaling that sideways trading is possible near-term. If September extends the decline off March's high, the 87% retracement level of the October-January rally crossing at 0.070777 is the next downside target. Closes above the June 1st high crossing at 0.073430 would signal that a short-term low has been posted. First resistance is the June 1st high crossing at 0.073430. Second resistance is the 50-day moving average crossing at 0.074719. First support is the 75% retracement level of the October-January rally crossing at 0.072174. Second support is the 87% retracement level of the October-January rally crossing at 0.070777.
PRECIOUS METALS? http://quotes.ino.com/ex?changes/?c=metals ""
August gold closed slightly higher on Thursday as it extends the trading range of the past five-weeks. The high-range close sets the stage for a steady to higher opening when Friday's day session begins trading. Stochastics and the RSI are neutral to bullish signaling that sideways to higher prices are possible near-term. Closes above the 50-day moving average crossing at $2012.30 would signal that a short-term low has been posted. If August renews the decline off May's high, the 50% retracement level of the 2022-2023 rally crossing at $1892.30. First resistance is the June 1st high crossing at $2000.70. Second resistance is the 50-day moving average crossing at $2012.30. First support is the 38% retracement level of the 2022-2023 rally crossing at $1941.90. Second support is the 50% retracement level of the 2022-2023 rally crossing at $1892.30.
July silver closed slightly lower on Thursday. The high-range close sets the stage for a steady to slightly lower opening when Friday's day session begins trading. Stochastics and the RSI are neutral to bearish signaling that sideways to lower prices are possible near-term. Closes below the 20-day moving average crossing at 23.738 would signal that a short-term top has been posted while opening the door for additional weakness near-term. If July renews the decline off May's high, the 62% retracement level of the March-May rally crossing at 22.546 is the next downside target. If July extends the rally off May's low, the 50-day moving average crossing at 24.669 is the next upside target. First resistance is last-Friday's high crossing at 24.620. Second resistance is the 50-day moving average crossing at 24.669. First support is the 62% retracement level of the March-May rally crossing at 22.546. Second support is the 75% retracement level of the March-May rally crossing at 21.708.
July copper closed higher on Thursday as it extended the rally off May's low. The high-range close sets the stage for a steady to higher opening when Friday's day session begins trading. Stochastics and the RSI are overbought but remain neutral to bullish signaling that sideways to higher prices are possible near-term. This week's closes above the 50-day moving average crossing at 3.8458 opens the door for a possible test of the May 8th high crossing at 3.9595. Closes below the 20-day moving average crossing at 3.7279 would signal that a short-term top has been posted. First resistance is the May 8th high crossing at 3.9595. Second resistance is May's high crossing at 4.0050. First support is the 20-day moving average crossing at 3.7279. Second support is May's low crossing at 3.5450.
GRAINS? http://quotes.ino.com/ex?changes/?c=grains "
September Corn closed up $0.25-cents at $5.70.
September corn closed sharply higher on Thursday as it extends the rally off May's low. The high-range close sets the stage for a steady to slightly higher opening when Friday's night session begins trading. Stochastics and the RSI are overbought but remain neutral to bullish signaling that sideways to higher prices are possible near-term. If September extends the rally off May's low, the April 18th high crossing at $5.79 is the next upside target. Closes below Tuesday's low crossing at $5.37 1/2 would signal that a short-term top has been posted. First resistance is the 38% retracement level of the 2022-2023 decline crossing at $5.68 1/4. Second resistance is the April 18th high crossing at $5.79. First support is the 50-day moving average crossing at $5.35 1/4. Second support is the 20-day moving average crossing at $5.25.
September wheat closed down $0.31 1/2-cents at $6.72 1/4.
September wheat closed sharply higher on Thursday and above the 50-day moving average crossing at $6.55 1/4. The high-range close sets the stage for a steady to higher opening when Friday's day session begins trading. Stochastics and the RSI are neutral to bullish signaling signaling that sideways to higher prices are possible near-term. If September extends the rally off May's low, May's high crossing at $6.80 is the next upside target. Closes below last-Thursday's low crossing at $6.23 1/4 would signal that a short-term top has been posted. First resistance is May's high crossing at $6.80. Second resistance is the April 18th high crossing at $7.26 3/4. First support is last-Thursday's low crossing at $6.23 1/4. Second support is May's low crossing at $5.87 3/4.
September Kansas City Wheat closed up $0.26 1/2-cents at $8.08 3/4.
September Kansas City wheat closed sharply higher on Thursday. The high-range close sets the stage for a steady to higher opening when Friday's day session begins trading. Stochastics and the RSI are turning neutral to bullish signaling that sideways to higher prices are possible near-term. Closes above the 50-day moving average crossing at $8.17 3/4 would signal that a short-term low has been posted. If September renews the decline off June's high, the May 31st low crossing at $7.61 3/4 is the next downside target. First resistance is the 50-day moving average crossing at $8.17 3/4. Second resistance is June's high crossing at $8.41. First support is the May 31st low crossing at $7.61 3/4. Second support is May's low crossing at $7.33.
September Minneapolis wheat closed up $0.25 3/4-cents crossing at $8.33 1/2.
September Minneapolis wheat closed sharply higher on Thursday above the 50-day moving average crossing at $8.31 1/2 signaling that a short-term low has been posted. The high-range close sets the stage for a steady to higher opening when Friday's day session begins trading. Stochastics and the RSI are turning neutral to bullish signaling that sideways to higher prices are possible near-term. Closes above the June 6th high crossing at $8.39 3/4 would mark a resumption of the rally off May's low. If September renews the decline off May's high, the May 31st low crossing at $7.78 1/4 is the next downside target. First resistance is June's high crossing at $8.39 3/4. Second resistance is May's high crossing at $8.89 1/2. First support is the May 31st low crossing at $7.78 1/4. Second support is May's low crossing at $7.71 3/4.
SOYBEAN COMPLEX? http://quotes.ino.com/ex?changes/?c=grains "
November soybeans closed up $0.52 1/4-cents at $12.92 1/4.
November soybeans close sharply higher on Thursday and above the 50-day moving average crossing at $13.34 thereby opening the door for additional gains near-term. The high-range close sets the stage for a steady to higher opening when Friday's day session begins trading. Stochastics and the RSI are overbought but remain neutral to bullish signaling that sideways to higher prices are possible near-term. If November extends the rally off May's low, May's high crossing at $13.82 3/4 is the next upside target. Closes below the 20-day moving average crossing at $12.71 3/4 would signal that a short-term top has been posted.First resistance is May's high crossing at $13.82 3/4. Second resistance is the 62% retracement level of the 2022-2023 decline crossing at $14.03 3/4. First support is the 10-day moving average crossing at $12.93 1/4. Second support is the 20-day moving average crossing at $12.71 3/4.
July soybean meal closed up $4.50 at $394.20.
July soybean meal closed higher on Thursday. The high-range close sets the stage for a steady to higher opening when Friday's day session begins trading. Stochastics and the RSI are neutral to bearish signaling that sideways to lower prices are possible near-term. If July renews the decline off March's high, the 62% retracement level of the 2020-2023 rally crossing at $365.60 is the next downside target. Closes above last-Thursday's high crossing at $408.40 would signal that a short-term low has been posted. First resistance is last-Thursday's high crossing at $408.40. Second resistance is the 50-day moving average crossing at $423.20. First support is May's low crossing at $386.30. Second support is the 62% retracement level of the 2020-2023 rally crossing at $365.60.
July soybean oil closed up 247-pts. at 58.41.
July soybean oil closed sharply higher on Thursday as it extended the rally off May's low.The high-range close sets the stage for a steady to higher opening when Friday's day session begins trading. Stochastics and the RSI are overbought but remain neutral to bullish signaling that sideways to higher prices are possible near-term. If July extends the aforementioned rally, March's high crossing at 61.83 is the next upside target. Closes below the 20-day moving average crossing at 50.39 would signal that a short-term top has been posted. First resistance is today's high crossing at 58.90. Second resistance is March's high crossing at 61.83. First support is the 10-day moving average crossing at 53.10. Second support is the 20-day moving average crossing at 50.39.
LIVESTOCKhttp://quotes.ino.com/exchanges/?c=livestock
August hogs closed up $0.73 at $90.40.
August hogs closed higher on Thursday as it extends the rally off May's low. The mid-range close sets the stage for a steady to higher opening when Friday's day session begins trading. Stochastics and the RSI are overbought but remain neutral to bullish signaling that sideways to higher prices are possible near-term. If August extends the rally off May's low, the 62% retracement level of the 2022-2023 decline crossing at $95.45 is the next upside target. Closes below the 20-day moving average crossing at $82.55 would signal that a short-term top has been posted. First resistance is the 50% retracement level of the 2022-2023 decline crossing at $91.25. Second resistance is the 62% retracement level of the 2022-2023 decline crossing at $95.45. First support is the 10-day moving average crossing at $85.28. Second support is the 20-day moving average crossing at $82.55.
August cattle closed down $0.10 at $170.88.
August cattle closed slightly lower on Thursday following Wednesday's key reversal down. The mid-range close sets the stage for a steady to lower opening on Thursday. Stochastics and the RSI are turning neutral to bearish signaling that sideways to lower prices are possible near-term. If August extends the decline off last-Wednesday's high, the 20-day moving average crossing at $169.17 is the next downside target. If August renews this year's rally unto uncharted territory, upside targets will be hard to project. First resistance is Wednesday's high crossing at $174.40. Second resistance is last-Wednesday's high crossing at $178.10. First support is today's low crossing at $169.65. Second support is the 25% retracement level of the 2022-2023 rally crossing at $169.57.
August Feeder cattle closed down $1.88 at $234.03.
August Feeder cattle gapped down and closed lower on Thursday following yesterday's posting of a key reversal down signal that a short-term top has likely been posted. The high-range close sets the stage for a steady to slightly lower opening when Friday's day session begins trading. Stochastics and the RSI are turning neutral to bearish signaling that sideways to higher prices are possible near-term. If August extends this month's decline, the 50-day moving average crossing at $231.09 is the next downside target. Closes above Wednesday's high crossing at $241.90 would signal that a short-term low has been posted. First resistance is Wednesday's high crossing at $241.90. Second resistance is last-Wednesday's high crossing at $245.18. First support is the 50-day moving average crossing at $231.09. Second support is May's low crossing at $221.15.
FOOD & FIBERhttp://quotes.ino.com/ex changes/?c=food
September coffee closed higher on Thursday. The high-range close sets the stage for a steady to higher opening on Friday. Stochastics and the RSI are turning neutral to bullish signaling sideways to higher prices are possible near-term. Closes above last-Friday's high crossing at $19.18 would open the door for a possible test of April's high crossing at $20.18. If September renews the decline off last-Friday's high, May's low crossing at $17.32 is the next downside target. First resistance is last-Friday's high crossing at $19.18. Second resistance is April's high crossing at $19.64. First support is May's low crossing at $17.32. Second support is March's low crossing at $16.44.
September cocoa closed higher on Thursday as it extends this year's rally. The high-range close sets the stage for a steady to higher opening on Friday. Stochastics and the RSI are overbought but remain neutral to bullish signaling that sideways to higher prices are possible near-term. If September extends the rally off March's low, monthly resistance crossing at 34.29 is the next upside target. Closes below the 20-day moving average crossing at 30.78 would signal that a short-term top has been posted.
October sugar closed higher on Thursday, The high-range close sets the stage for a steady to higher opening on Friday. Stochastics and the RSI are neutral to bullish signaling that sideways to higher prices are possible near-term. If October renews last-week's rally, the May 11th high crossing at 26.39 is the next upside target. Multiple closes below last-Tuesday's low crossing at 24.01 would open the door for additional weakness near-term.
December cotton closed lower on Thursday. The low-range close sets the stage for a steady to lower opening on Friday. Stochastics and the RSI have turned neutral to bearish signaling sideways to lower prices are possible near-term. If December extends this week's decline, the May 25th low crossing at 78.45 is the next upside target. Closes above the 50-day moving average crossing at 81.51 would signal that a low has been posted.
Thanks much tallpine!
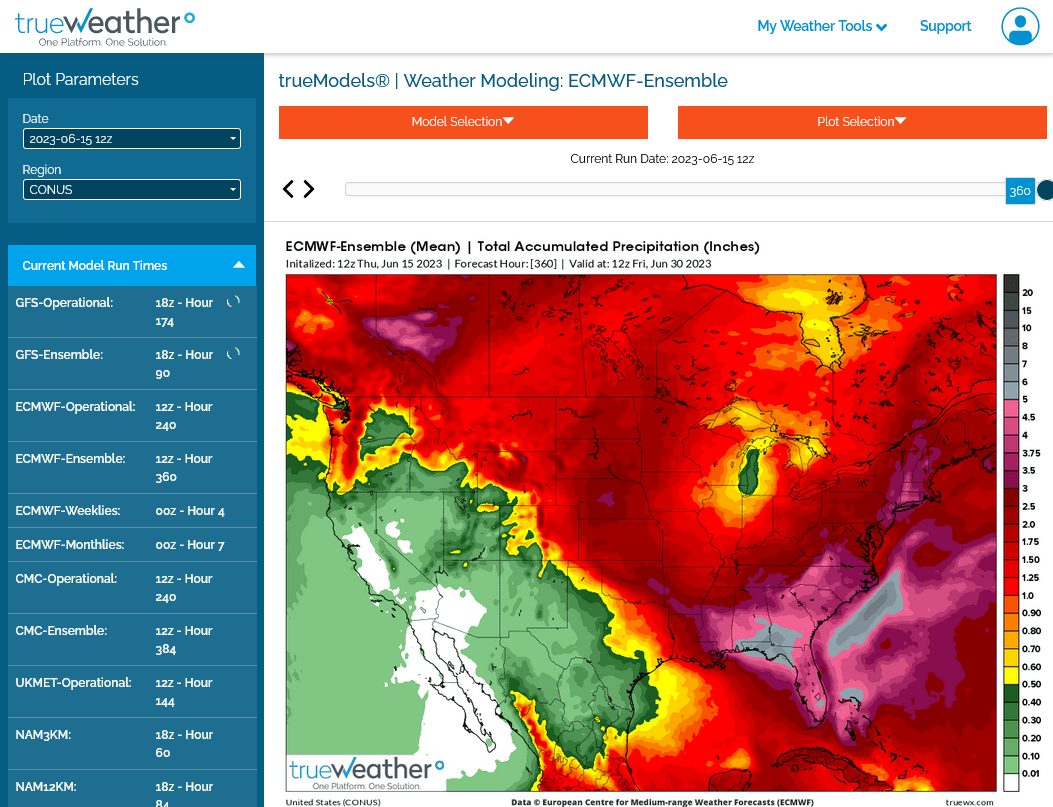
As mentioned the last 2 updates, the drier forecast, especially EE got the grains fired up today.
Here's the 7 day rains from the NWS and the last 12z EE 2 week rains(which is about the same to a very tiny bit wetter but still bullish).
We've come a long way pretty quickly. If that hole in the rains starts filling in, we'll come back down pretty quickly. That could happen over night and even more likely, over a weekend.
This is a very unusual, probably temporary blocking pattern that is not shutting down the rains like the 2012, 1988 or most other Cornbelt domes did in the Summer.
It's going to cause the rains to dry up/lose support heading to the Mississippi River.
There is no rain suppressing dome this time.
If/when this temporary dynamic causing that is removed, El Nino driven rains will have a good chance to march east across the entire belt.
The end of week 2 has often suggested it will break...........but then the break never gets closer........so the models may be missing something.
If we don't have more rain in next weeks forecast, we can go much higher especially with heat, so don't let my current bias right now impact you.
That bias, is to look for a place to sell when rains increase in the forecast and to avoid a long weekend position of any kind.
tjc likes to buy options but they are probably massively overpriced here.
The markets being closed on Monday for the new national holiday "Juneteenth" are the worst time imaginable for the grain markets. I don't have a problem with this holiday but it REALLY, REALLY hurts all trading interests, some in a huge way in a year like this.
Weekends are already extremely risky and bad enough but adding an extra day makes it impossible to consider holding a position unless you want to risk many thousands more on a position.
7 Day Total precipitation below:
http://www.wpc.ncep.noaa.govcdx /qpf/p168i.gif?1530796126